Marion County Investment Properties for Sale
Browse homes for sale and investment properties in Marion County. Refine your search by price, property type, or more.
Best cash flowing properties in Marion County
Active
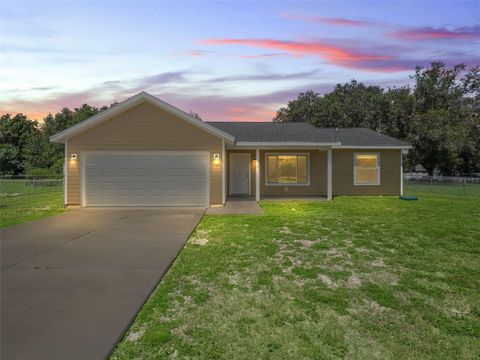
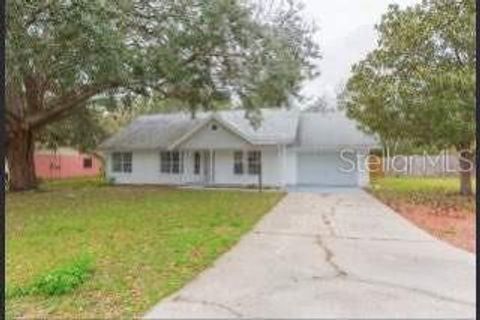
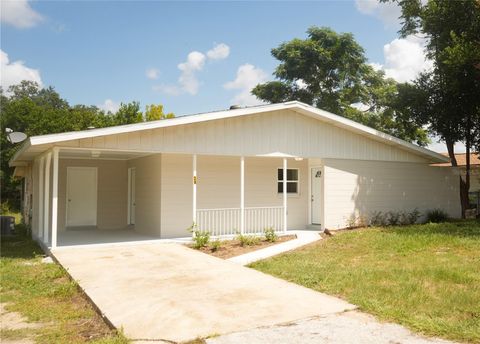
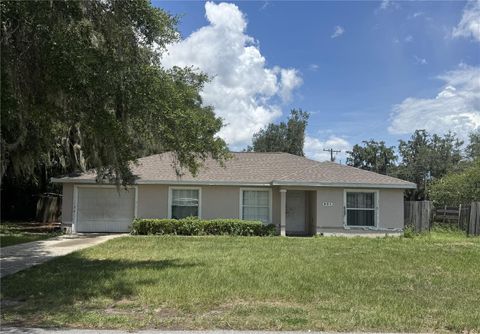
$150,000
2
bds
|
2
ba
|
988
sqft
|
built
1971
464 Lake Rd, Ocala, FL 34472
$-33
Cash flow
-1.1%
Cash-on-Cash Return
5.9%
Cap rate
0.9%
Rent to Value Ratio
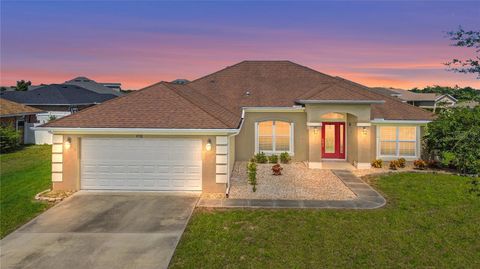
Active
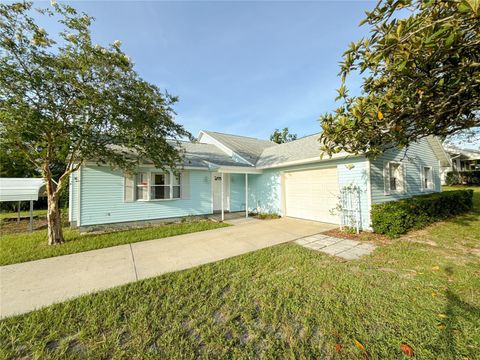
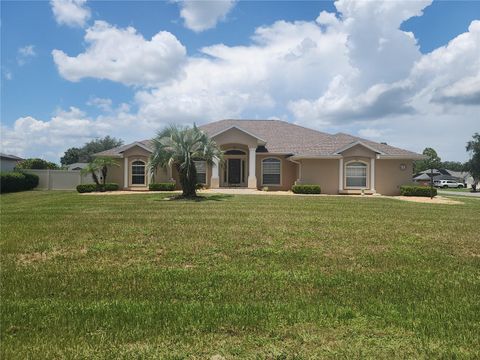
$234,999
3
bds
|
2
ba
|
1,158
sqft
|
built
1989
3551 SE 149th Ln, Summerfield, FL 34491
$-64
Cash flow
-1.4%
Cash-on-Cash Return
5.8%
Cap rate
0.8%
Rent to Value Ratio
626 out of 852 properties for sale in Marion County
Limited Results Shown
Create a free account, or log in to reveal all property listings and enjoy the complete experience.
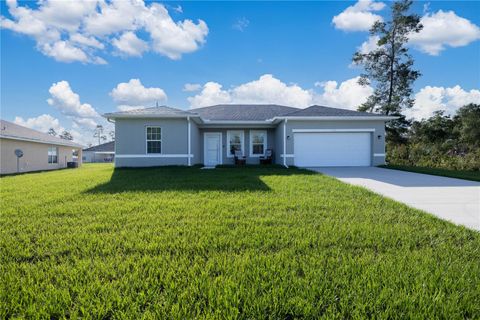
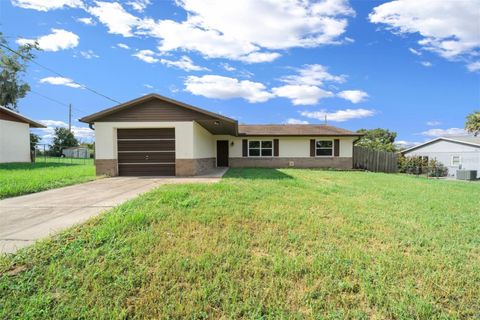
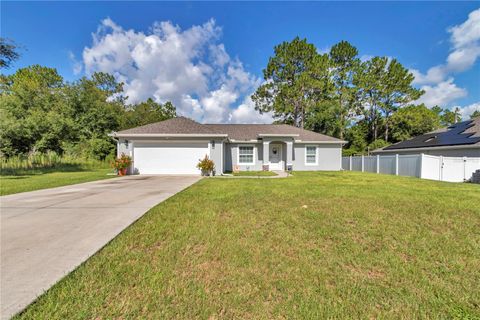
Active
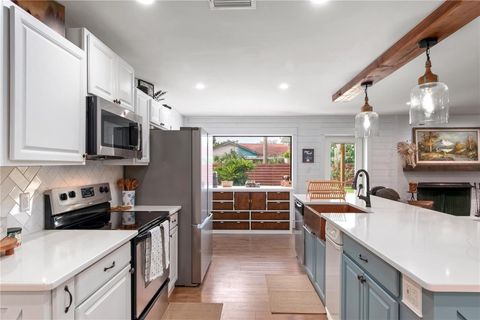
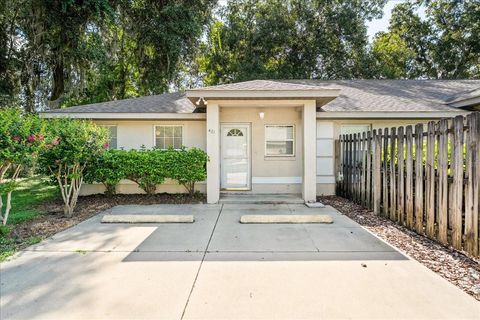
$269,900
3
bds
|
2
ba
|
1,433
sqft
|
built
2022
1918 NE 161st Pl, Citra, FL 32113
$-374
Cash flow
-7.2%
Cash-on-Cash Return
4.5%
Cap rate
0.7%
Rent to Value Ratio
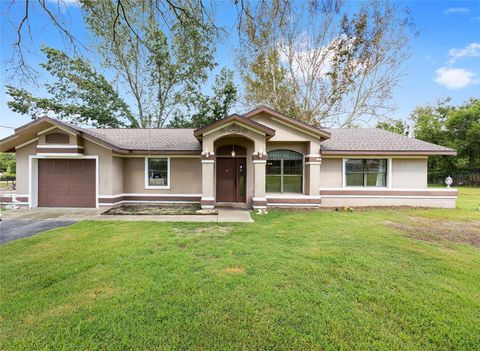
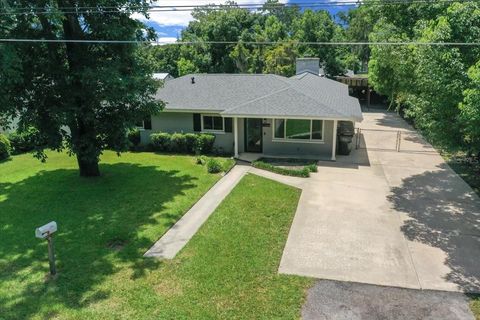
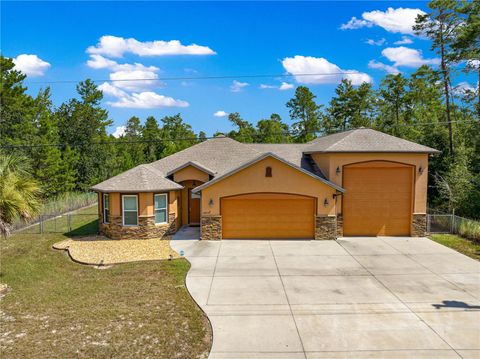
Active
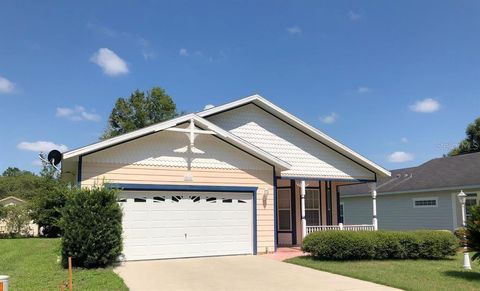
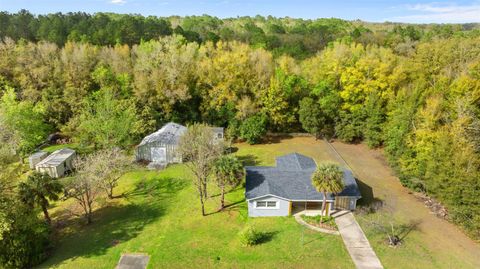
$309,750
3
bds
|
2
ba
|
2,106
sqft
|
built
1990
16789 SE 69th Ln, Ocklawaha, FL 32179
$-395
Cash flow
-6.7%
Cash-on-Cash Return
4.6%
Cap rate
0.7%
Rent to Value Ratio
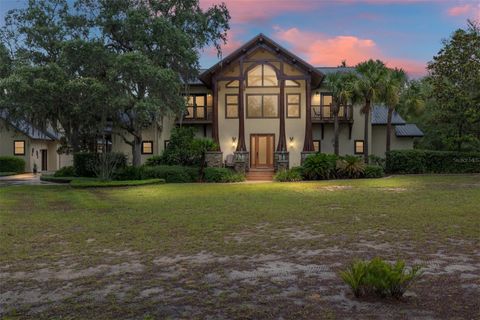
Active
$2,150,000
4
bds
|
4
ba
|
5,825
sqft
|
built
2015
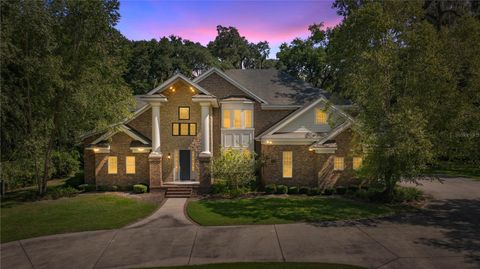
1151 SE 10th St, Ocala, FL 34471
$-9,071
Cash flow
-22.0%
Cash-on-Cash Return
1.1%
Cap rate
0.2%
Rent to Value Ratio
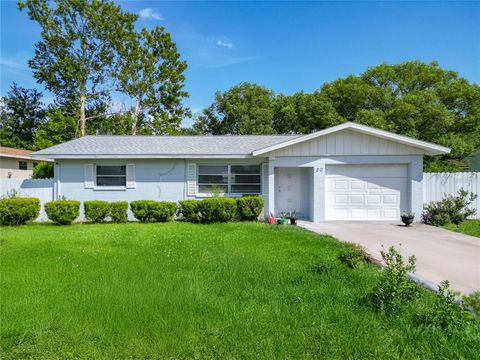
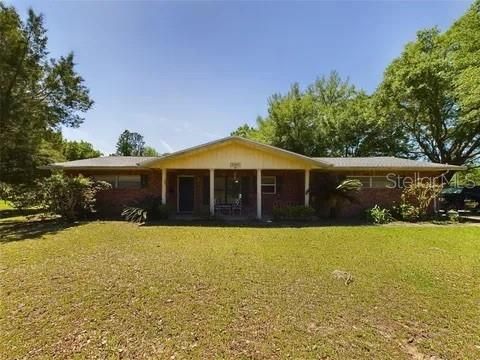
Active
$219,980
2
bds
|
2
ba
|
1,116
sqft
|
built
1971
20 Lake Court Loop, Ocala, FL 34472
$-203
Cash flow
-4.8%
Cash-on-Cash Return
5.0%
Cap rate
0.7%
Rent to Value Ratio
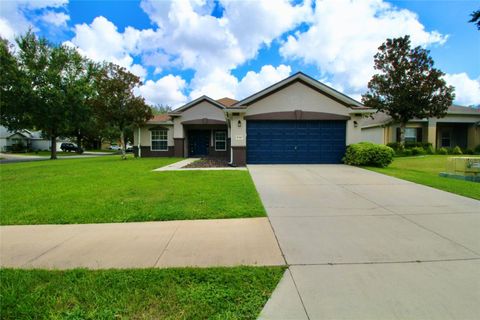
Active
$319,900
4
bds
|
2
ba
|
2,185
sqft
|
built
2006
5739 SW 40th St, Ocala, FL 34474
$-446
Cash flow
-7.3%
Cash-on-Cash Return
4.5%
Cap rate
0.7%
Rent to Value Ratio
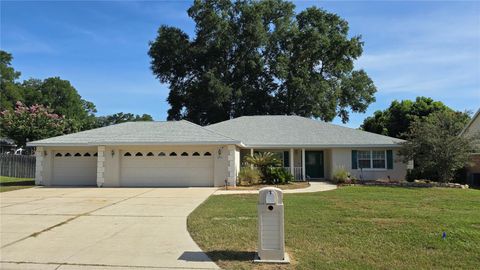
Active
$359,000
3
bds
|
2
ba
|
2,165
sqft
|
built
1998
5075 NE 7th Pl, Ocala, FL 34470
$-470
Cash flow
-6.8%
Cash-on-Cash Return
4.6%
Cap rate
0.6%
Rent to Value Ratio
Active
$294,000
3
bds
|
2
ba
|
1,310
sqft
|
built
2022
11684 SE 84th Ter, Belleview, FL 34420
$-623
Cash flow
-11.1%
Cash-on-Cash Return
3.6%
Cap rate
0.6%
Rent to Value Ratio
Active
$258,000
3
bds
|
3
ba
|
2,366
sqft
|
built
1989
13102 SW 100th Ln, Dunnellon, FL 34432
$-317
Cash flow
-6.4%
Cash-on-Cash Return
4.7%
Cap rate
0.8%
Rent to Value Ratio
Active
$379,000
4
bds
|
2
ba
|
2,010
sqft
|
built
1969
2135 NE 8th St, Ocala, FL 34470
$-792
Cash flow
-10.9%
Cash-on-Cash Return
3.6%
Cap rate
0.6%
Rent to Value Ratio
Active
$274,900
3
bds
|
2
ba
|
1,476
sqft
|
built
2003
2116 NE 40th Ter, Ocala, FL 34470
$-267
Cash flow
-5.1%
Cash-on-Cash Return
5.0%
Cap rate
0.7%
Rent to Value Ratio
Active
$267,900
3
bds
|
2
ba
|
1,335
sqft
|
built
1989
4 Cedar Trace Way, Ocala, FL 34472
$-389
Cash flow
-7.6%
Cash-on-Cash Return
4.4%
Cap rate
0.7%
Rent to Value Ratio
Active
$385,000
4
bds
|
3
ba
|
2,429
sqft
|
built
2003
71 Hickory Loop Way, Ocala, FL 34472
$-564
Cash flow
-7.6%
Cash-on-Cash Return
4.4%
Cap rate
0.6%
Rent to Value Ratio
Active
$169,999
2
bds
|
2
ba
|
1,040
sqft
|
built
2001
11191 SE 55th Avenue Rd, Belleview, FL 34420
$-66
Cash flow
-2.0%
Cash-on-Cash Return
5.7%
Cap rate
0.8%
Rent to Value Ratio
Active
$264,999
3
bds
|
2
ba
|
1,550
sqft
|
built
1977
20639 SW Rainbow Lakes Blvd, Dunnellon, FL 34431
$-496
Cash flow
-9.8%
Cash-on-Cash Return
3.9%
Cap rate
0.6%
Rent to Value Ratio
Active
$274,500
2
bds
|
1
ba
|
1,146
sqft
|
built
1970
23303 NW Mallard Ave, Dunnellon, FL 34431
$-465
Cash flow
-8.8%
Cash-on-Cash Return
4.1%
Cap rate
0.6%
Rent to Value Ratio
Active
$219,000
3
bds
|
2
ba
|
1,678
sqft
|
built
1990
4102 SW 159th Ln, Ocala, FL 34473
$-138
Cash flow
-3.3%
Cash-on-Cash Return
5.4%
Cap rate
0.8%
Rent to Value Ratio
Active
$475,000
4
bds
|
4
ba
|
2,830
sqft
|
built
2019
4514 SW 65th Pl, Ocala, FL 34474
$-1,024
Cash flow
-11.2%
Cash-on-Cash Return
3.6%
Cap rate
0.6%
Rent to Value Ratio
Active
$310,000
3
bds
|
2
ba
|
1,268
sqft
|
built
2020
9343 SE 152nd Pl, Summerfield, FL 34491
$-587
Cash flow
-9.9%
Cash-on-Cash Return
3.9%
Cap rate
0.6%
Rent to Value Ratio
Active
$184,900
2
bds
|
1
ba
|
1,110
sqft
|
built
1971
29 Lake Court Loop, Ocala, FL 34472
$-214
Cash flow
-6.0%
Cash-on-Cash Return
4.8%
Cap rate
0.8%
Rent to Value Ratio
Active
$1,150,000
3
bds
|
5
ba
|
4,911
sqft
|
built
2010
15225 NE 246th Ave, Salt Springs, FL 32134
$-4,281
Cash flow
-19.4%
Cash-on-Cash Return
1.7%
Cap rate
0.3%
Rent to Value Ratio
Active
$299,900
4
bds
|
2
ba
|
1,580
sqft
|
built
2024
3529 SW 157th Loop, Ocala, FL 34473
$-212
Cash flow
-3.7%
Cash-on-Cash Return
5.3%
Cap rate
0.7%
Rent to Value Ratio
Active
$439,900
2
bds
|
2
ba
|
1,112
sqft
|
built
1993
2227 SW 80th Ave, Ocala, FL 34481
$-1,217
Cash flow
-14.4%
Cash-on-Cash Return
2.8%
Cap rate
0.5%
Rent to Value Ratio
Active
$260,000
4
bds
|
2
ba
|
1,898
sqft
|
built
1950
1138 NE 12th St, Ocala, FL 34470
$-391
Cash flow
-7.8%
Cash-on-Cash Return
4.3%
Cap rate
0.7%
Rent to Value Ratio
Active
$695,000
4
bds
|
5
ba
|
3,990
sqft
|
built
1965
2313 SE 7th St, Ocala, FL 34471
$-1,569
Cash flow
-11.8%
Cash-on-Cash Return
3.4%
Cap rate
0.5%
Rent to Value Ratio
Active
$220,000
3
bds
|
2
ba
|
1,014
sqft
|
built
2019
3 Spring Pass, Ocala, FL 34472
$-215
Cash flow
-5.1%
Cash-on-Cash Return
5.0%
Cap rate
0.7%
Rent to Value Ratio
Active
$595,000
3
bds
|
3
ba
|
2,064
sqft
|
built
1995
5700 NW 135th Ave, Morriston, FL 32668
$-2,194
Cash flow
-19.2%
Cash-on-Cash Return
1.7%
Cap rate
0.3%
Rent to Value Ratio
Active
$224,900
3
bds
|
2
ba
|
1,197
sqft
|
built
2006
901 SW 7th St, Ocala, FL 34471
$-168
Cash flow
-3.9%
Cash-on-Cash Return
5.3%
Cap rate
0.8%
Rent to Value Ratio
Active
$407,000
4
bds
|
3
ba
|
2,303
sqft
|
built
2016
9798 SW 56th Cir, Ocala, FL 34476
$-973
Cash flow
-12.5%
Cash-on-Cash Return
3.3%
Cap rate
0.6%
Rent to Value Ratio
Active
$238,000
3
bds
|
2
ba
|
1,204
sqft
|
built
1988
3710 SE 134th Pl, Belleview, FL 34420
$-265
Cash flow
-5.8%
Cash-on-Cash Return
4.8%
Cap rate
0.7%
Rent to Value Ratio
Active
$265,000
3
bds
|
2
ba
|
1,936
sqft
|
built
1963
2930 SE 11th St, Ocala, FL 34471
$-324
Cash flow
-6.4%
Cash-on-Cash Return
4.7%
Cap rate
0.7%
Rent to Value Ratio
Active
$229,900
3
bds
|
2
ba
|
1,228
sqft
|
built
1977
32 Spring Loop Cir, Ocala, FL 34472
$-604
Cash flow
-13.7%
Cash-on-Cash Return
3.0%
Cap rate
0.5%
Rent to Value Ratio
Active
$429,900
3
bds
|
4
ba
|
2,478
sqft
|
built
1982
5370 SE 28th St, Ocala, FL 34480
$-517
Cash flow
-6.3%
Cash-on-Cash Return
4.7%
Cap rate
0.7%
Rent to Value Ratio
Active
$479,000
4
bds
|
3
ba
|
2,302
sqft
|
built
2004
2198 SE 62nd St, Ocala, FL 34480
$-733
Cash flow
-8.0%
Cash-on-Cash Return
4.3%
Cap rate
0.6%
Rent to Value Ratio
Active
$269,900
3
bds
|
2
ba
|
1,238
sqft
|
built
2021
6298 NW 61st Ave, Ocala, FL 34482
$-368
Cash flow
-7.1%
Cash-on-Cash Return
4.5%
Cap rate
0.7%
Rent to Value Ratio
Active
$277,000
3
bds
|
2
ba
|
1,278
sqft
|
built
2022
12824 SW 83rd Ave, Ocala, FL 34473
$-477
Cash flow
-9.0%
Cash-on-Cash Return
4.1%
Cap rate
0.6%
Rent to Value Ratio
Active
$494,492
3
bds
|
2
ba
|
2,449
sqft
|
built
2017
3 Bay Ln, Ocklawaha, FL 32179
$-1,068
Cash flow
-11.3%
Cash-on-Cash Return
3.6%
Cap rate
0.6%
Rent to Value Ratio
Active
$247,000
2
bds
|
2
ba
|
1,195
sqft
|
built
1983
6848 NW 60th St, Ocala, FL 34482
$-81
Cash flow
-1.7%
Cash-on-Cash Return
5.8%
Cap rate
0.7%
Rent to Value Ratio
Active
$390,000
3
bds
|
2
ba
|
1,634
sqft
|
built
1973
7440 SW 83rd Pl, Ocala, FL 34476
$-596
Cash flow
-8.0%
Cash-on-Cash Return
4.3%
Cap rate
0.6%
Rent to Value Ratio