Fort Lauderdale, FL Investment Properties for Sale
Browse homes for sale and investment properties in Fort Lauderdale, FL. Refine your search by price, property type, or more.
Best cash flowing properties in Fort Lauderdale, FL
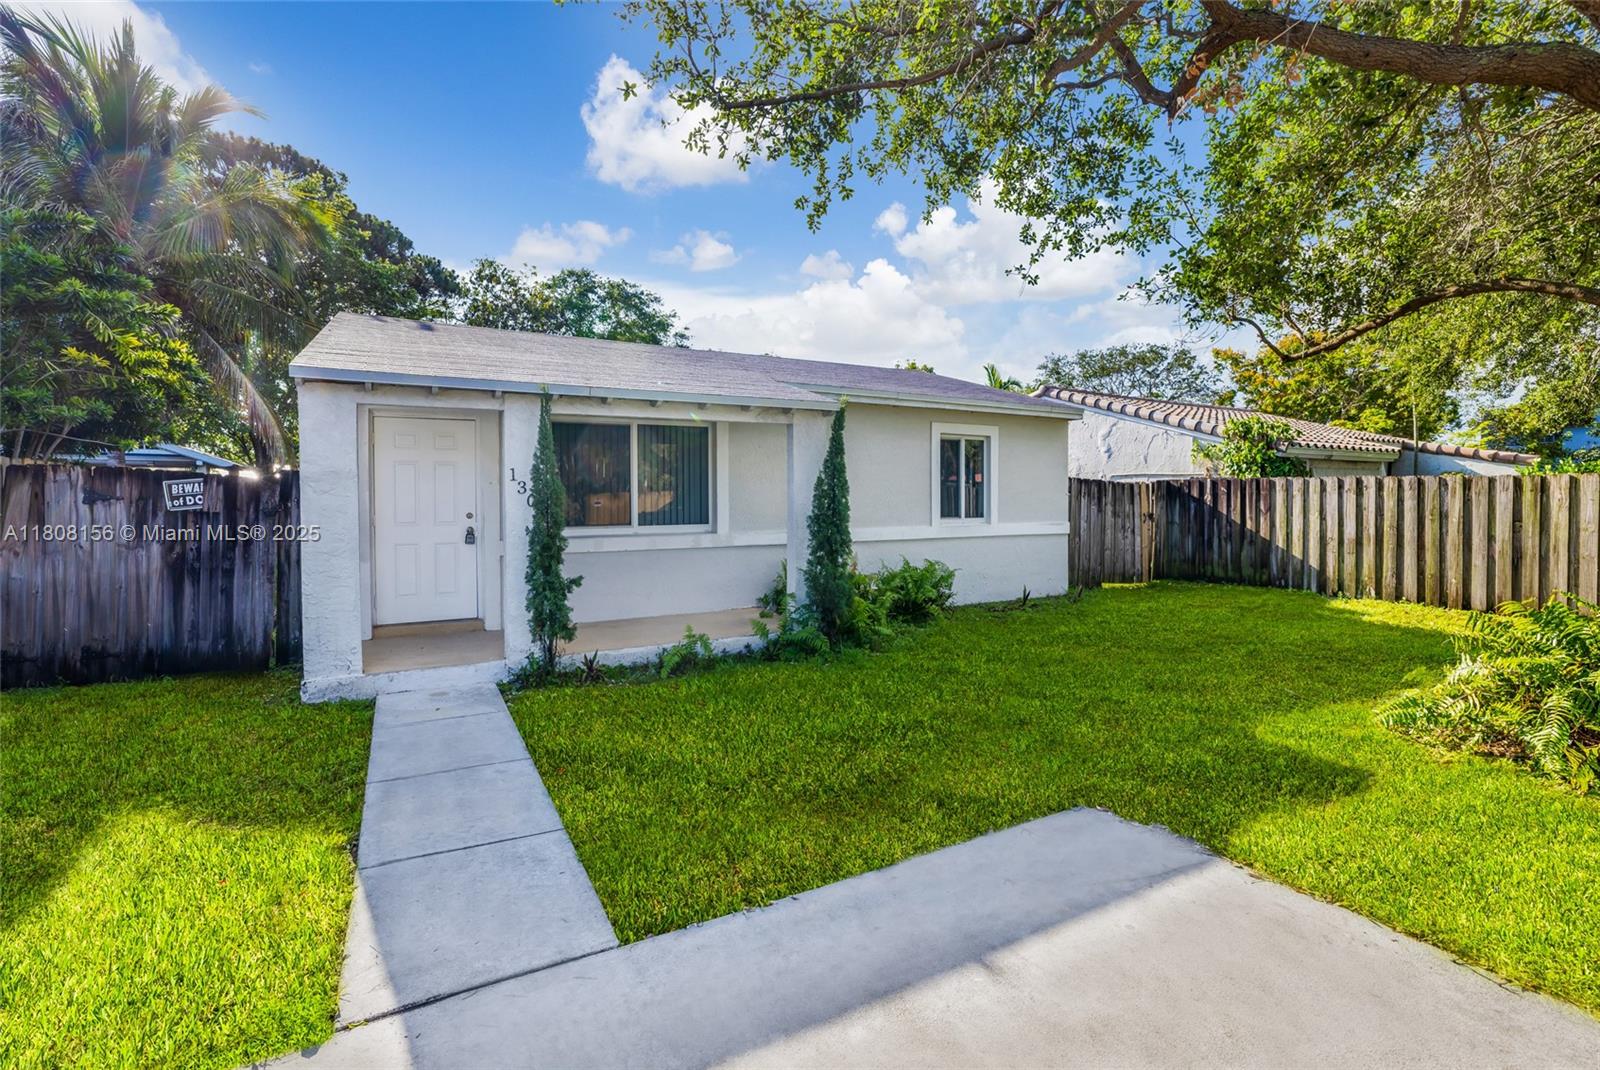
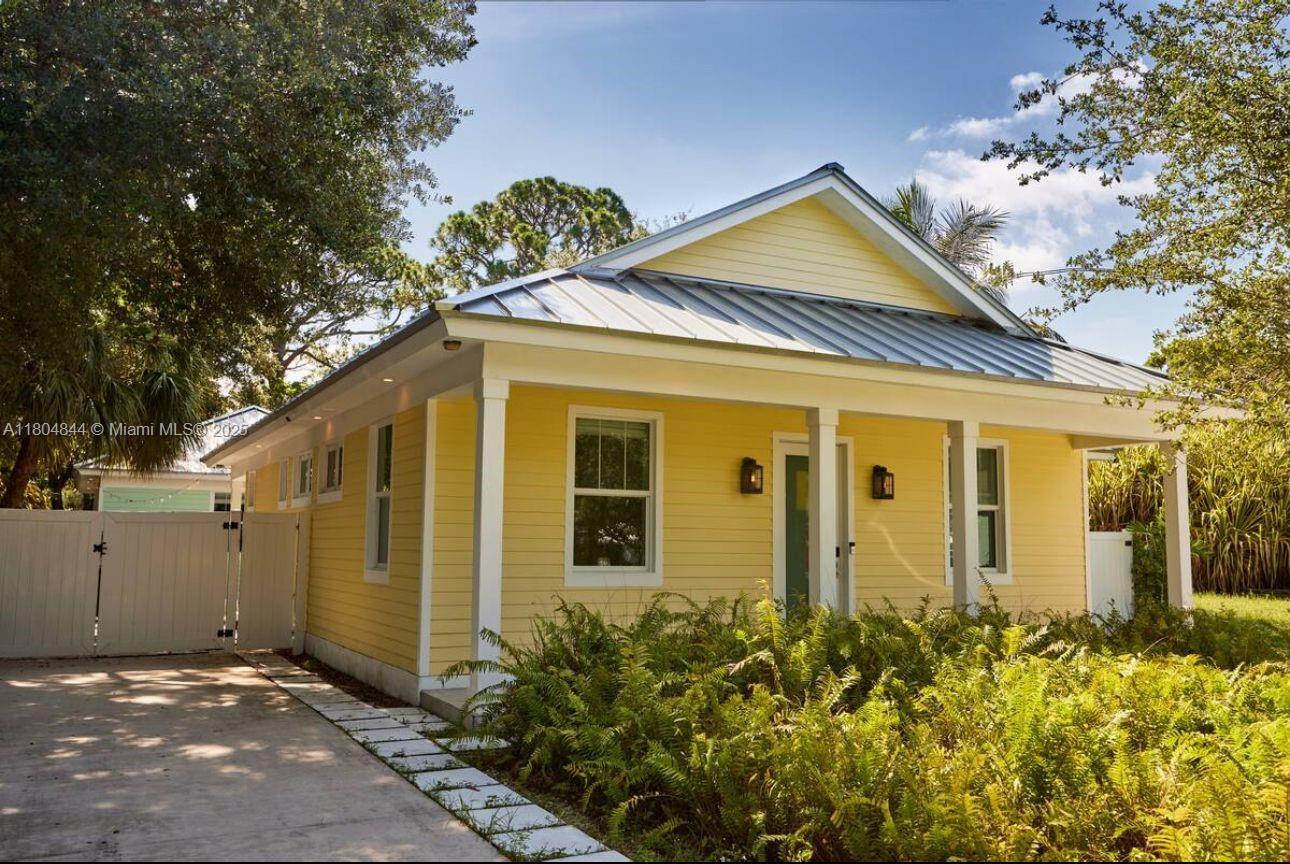
Active
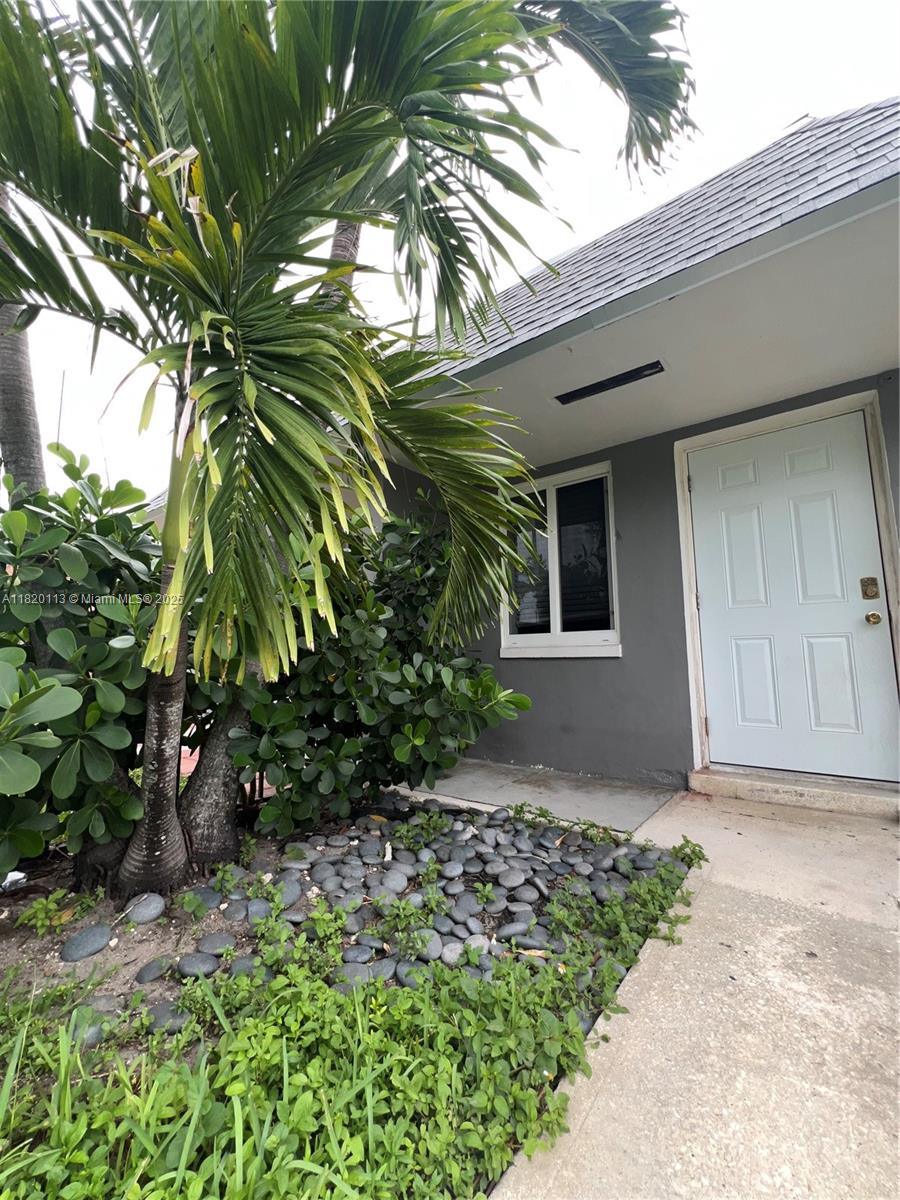
$560,000
3
bds
|
0
ba
|
1,275
sqft
|
built
1952
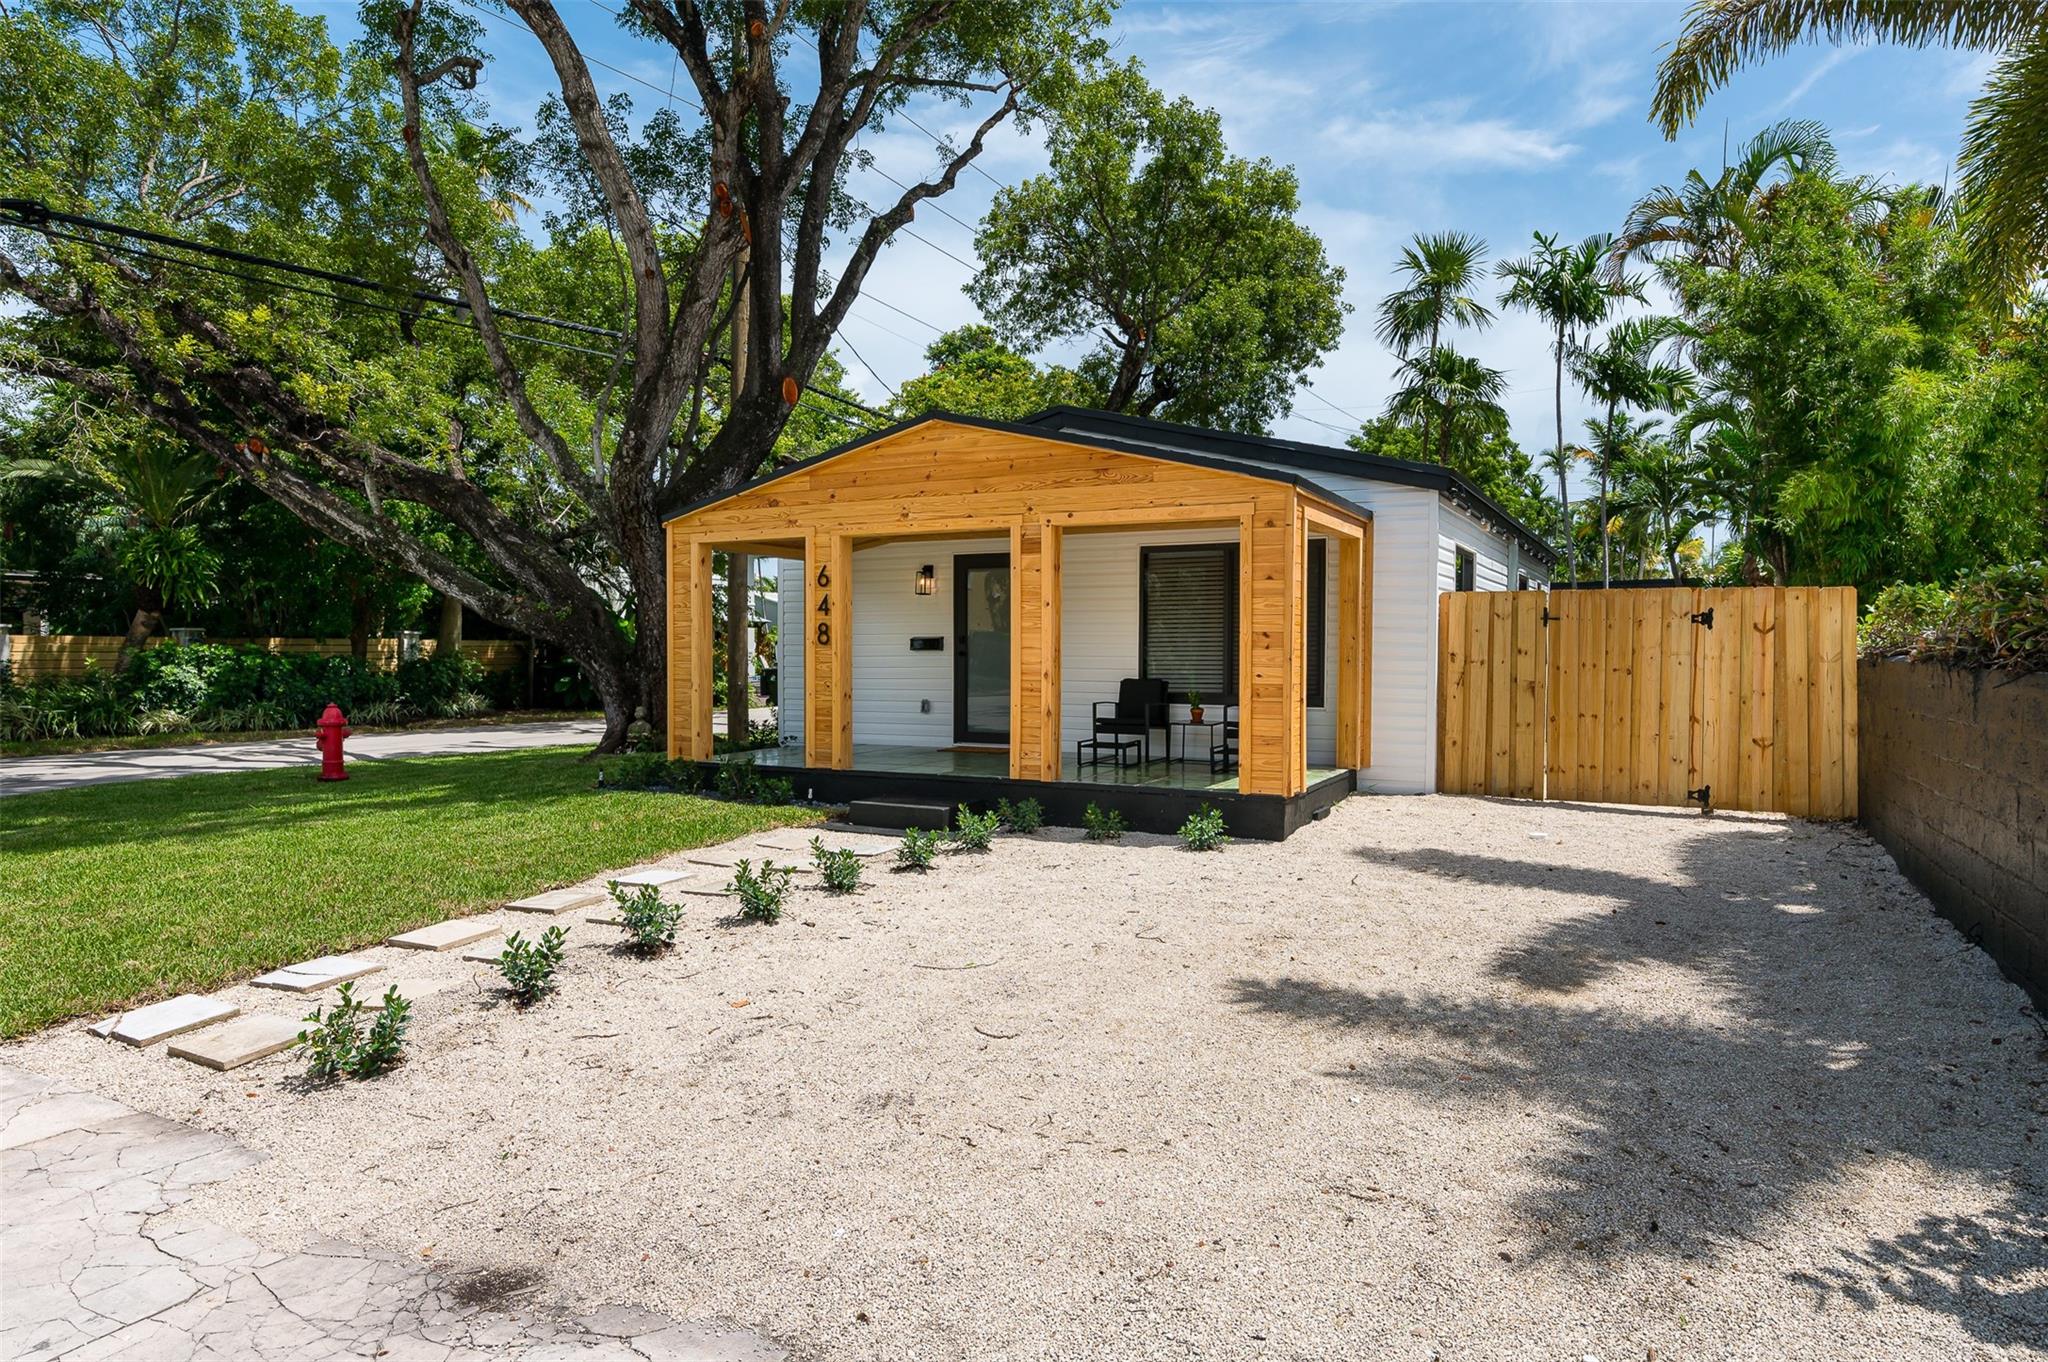
1304 NW 6th Ave, Fort Lauderdale, FL 33311
$-1,128
Cash flow
-10.5%
Cash-on-Cash Return
3.7%
Cap rate
0.6%
Rent to Value Ratio
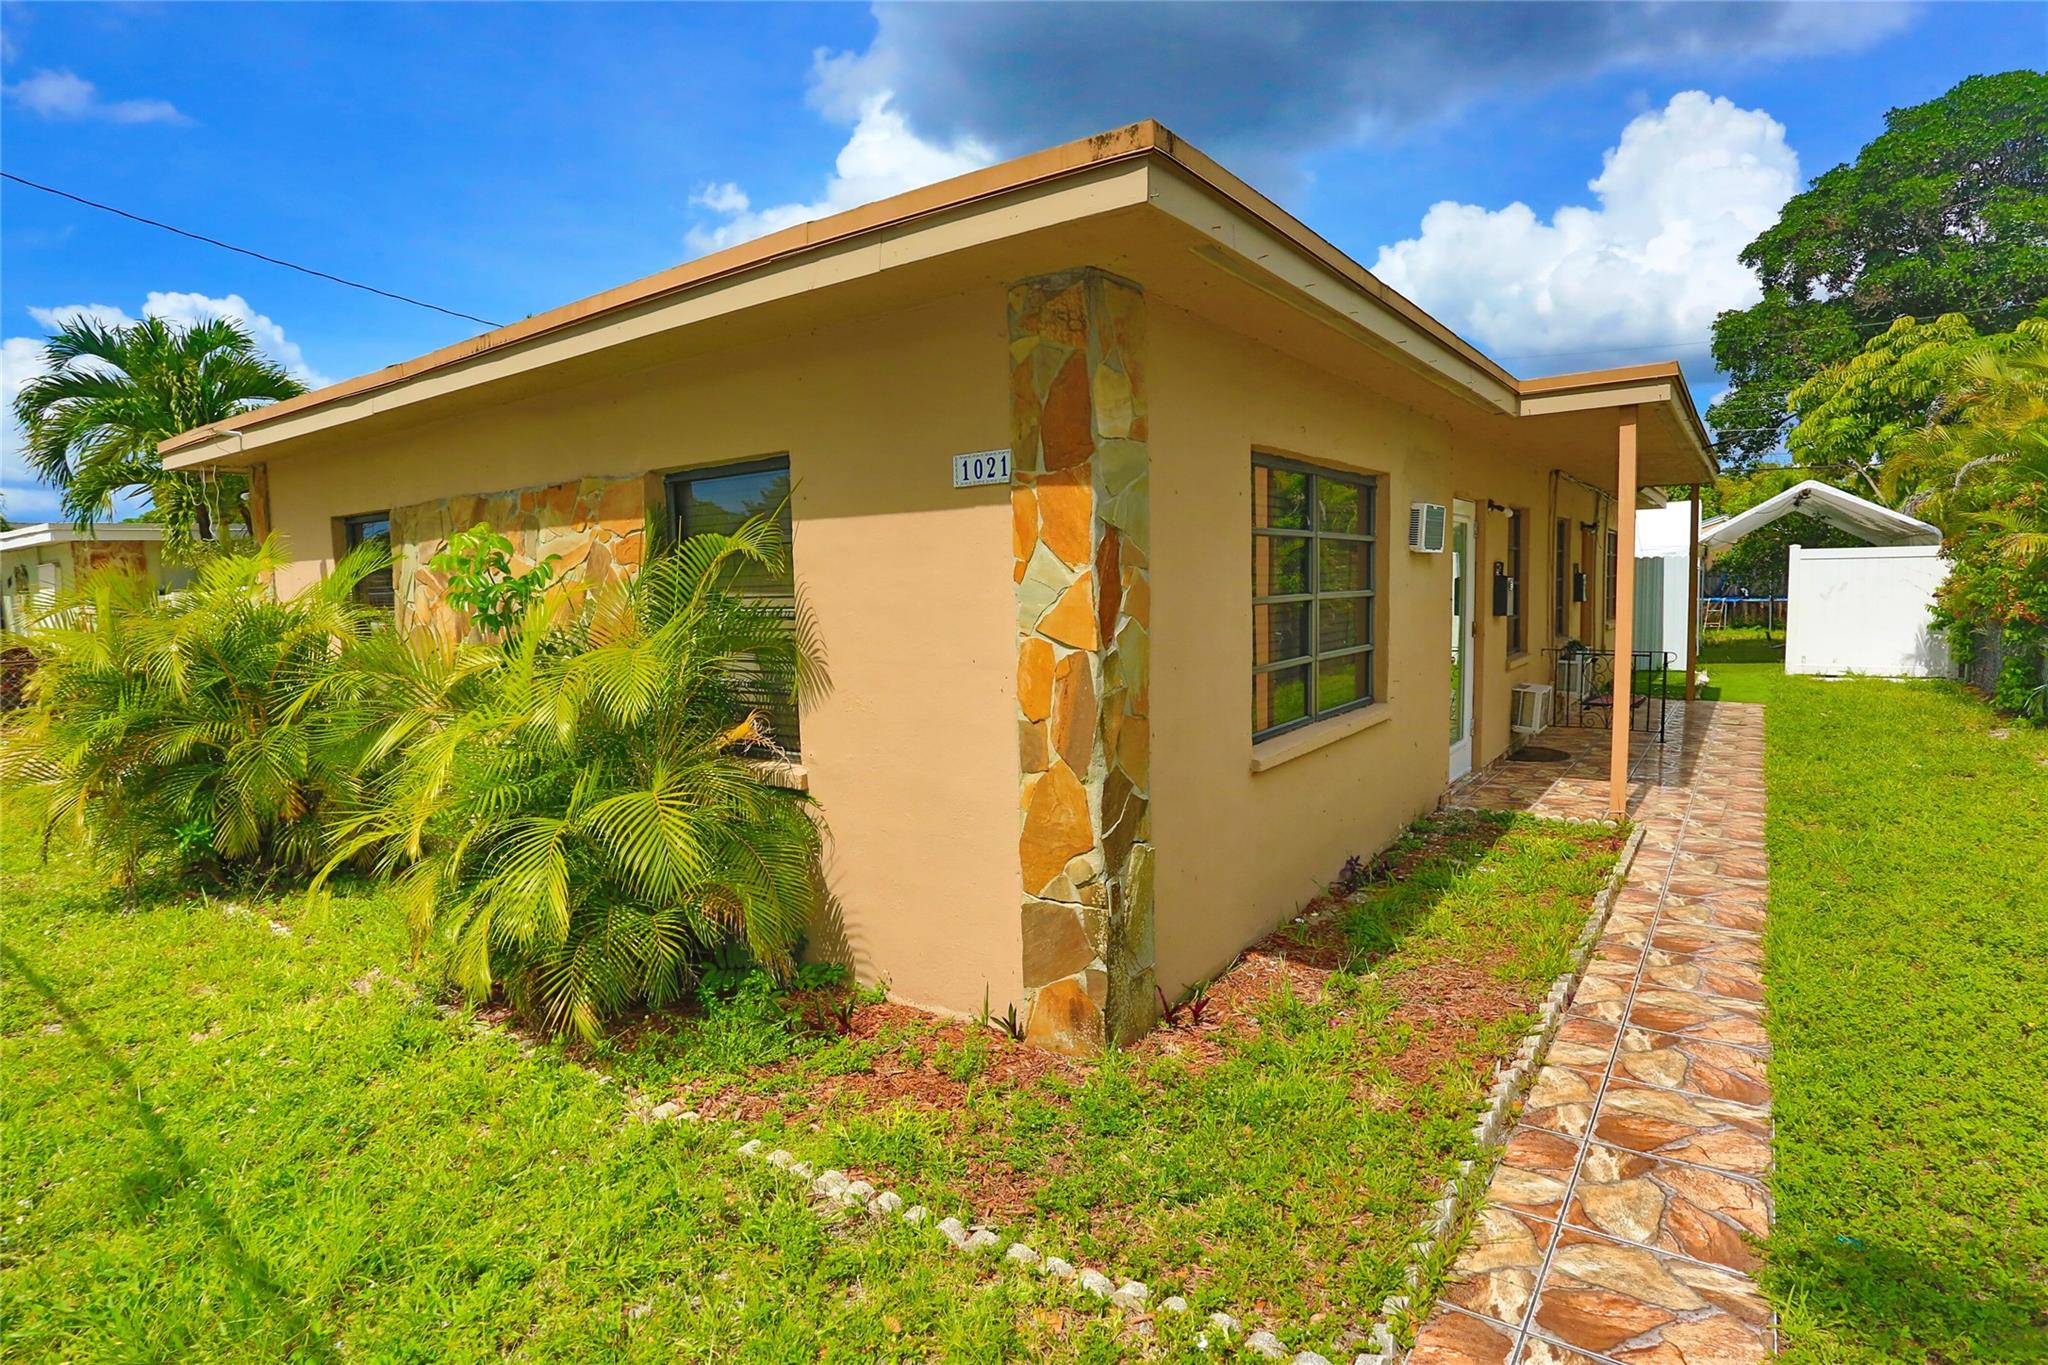
Active
$389,900
bds
|
0
ba
|
1,320
sqft
|
built
1956
1021 SW 24th Ave, Fort Lauderdale, FL 33312
$-1,204
Cash flow
-16.1%
Cash-on-Cash Return
2.4%
Cap rate
0.5%
Rent to Value Ratio
126 out of 168 properties for sale in Fort Lauderdale, FL
Limited Results Shown
Create a free account, or log in to reveal all property listings and enjoy the complete experience.
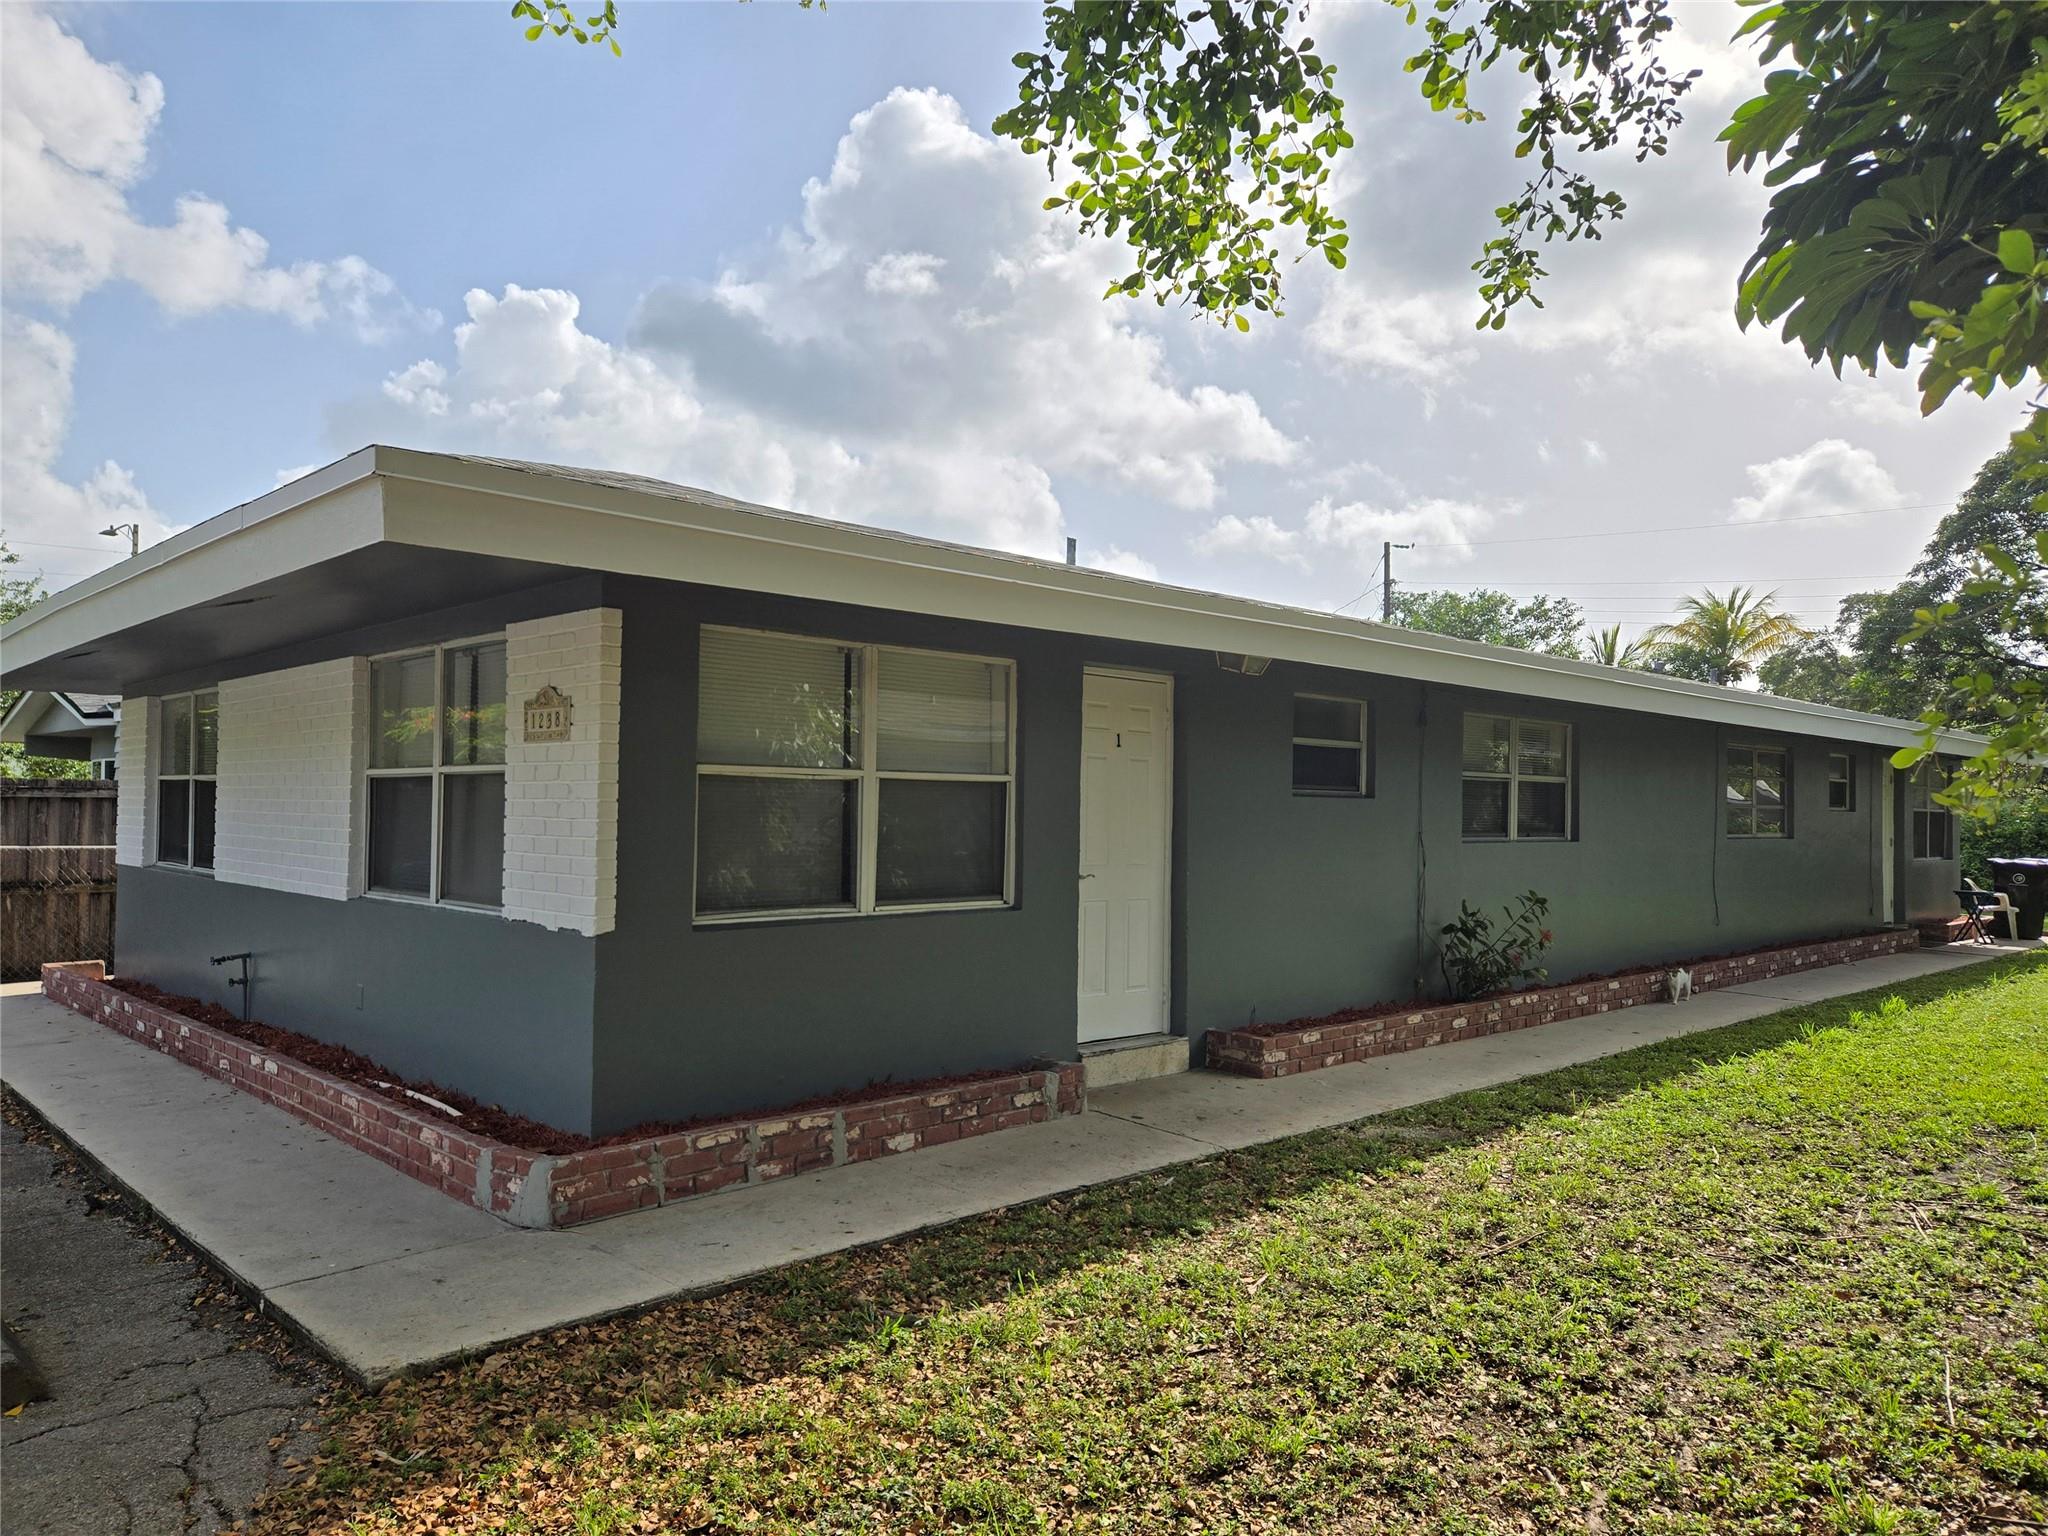
Active
$579,000
bds
|
0
ba
|
1,742
sqft
|
built
1966
1238 NW 5th Ave, Fort Lauderdale, FL 33311
$-2,105
Cash flow
-19.0%
Cash-on-Cash Return
1.8%
Cap rate
0.3%
Rent to Value Ratio
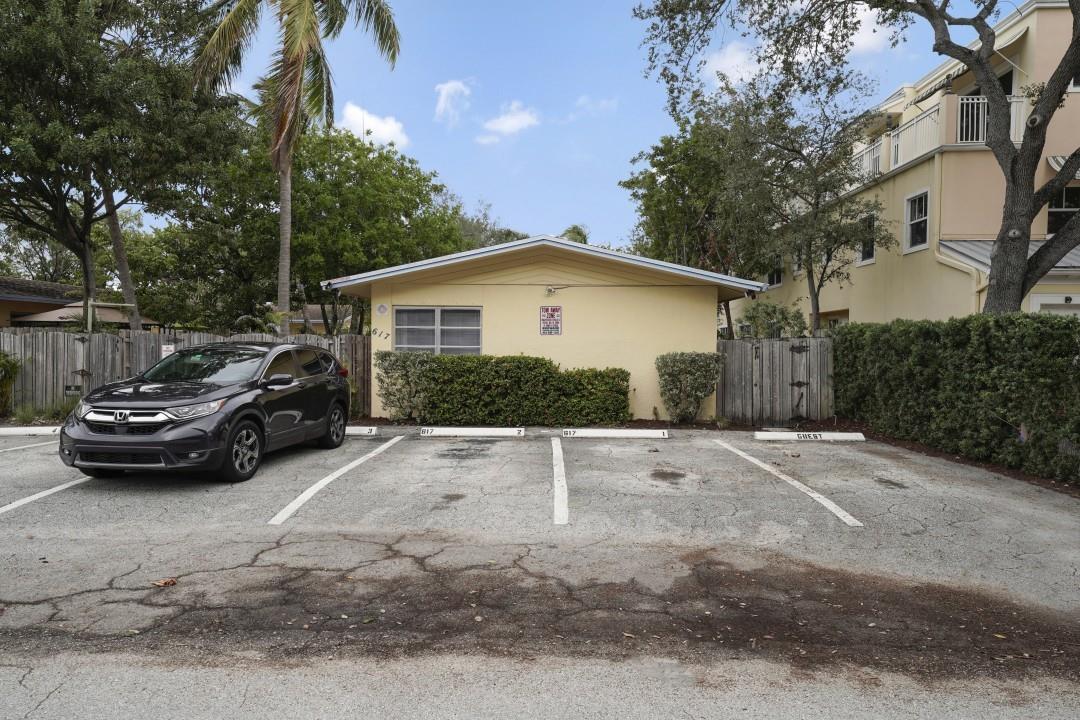
Active
$999,000
bds
|
0
ba
|
2,585
sqft
|
built
1965
617 SE 16th St, Fort Lauderdale, FL 33316
$-4,628
Cash flow
-24.2%
Cash-on-Cash Return
0.6%
Cap rate
0.2%
Rent to Value Ratio
Active
$645,000
bds
|
0
ba
|
2,504
sqft
|
built
1968
1410 NW 8th Ave, Fort Lauderdale, FL 33311
$-2,689
Cash flow
-21.8%
Cash-on-Cash Return
1.1%
Cap rate
0.3%
Rent to Value Ratio
Active
$599,000
bds
|
0
ba
|
1,212
sqft
|
built
1958
516 NW 18th Ave, Fort Lauderdale, FL 33311
$-2,188
Cash flow
-19.1%
Cash-on-Cash Return
1.8%
Cap rate
0.3%
Rent to Value Ratio
Active
$599,000
bds
|
0
ba
|
1,786
sqft
|
built
1961
439 NW 18th Ave, Fort Lauderdale, FL 33311
$-2,327
Cash flow
-20.3%
Cash-on-Cash Return
1.5%
Cap rate
0.3%
Rent to Value Ratio
Active
$560,000
3
bds
|
0
ba
|
1,275
sqft
|
built
1952
1304 NW 6th Ave, Fort Lauderdale, FL 33311
$-1,128
Cash flow
-10.5%
Cash-on-Cash Return
3.7%
Cap rate
0.6%
Rent to Value Ratio
Active
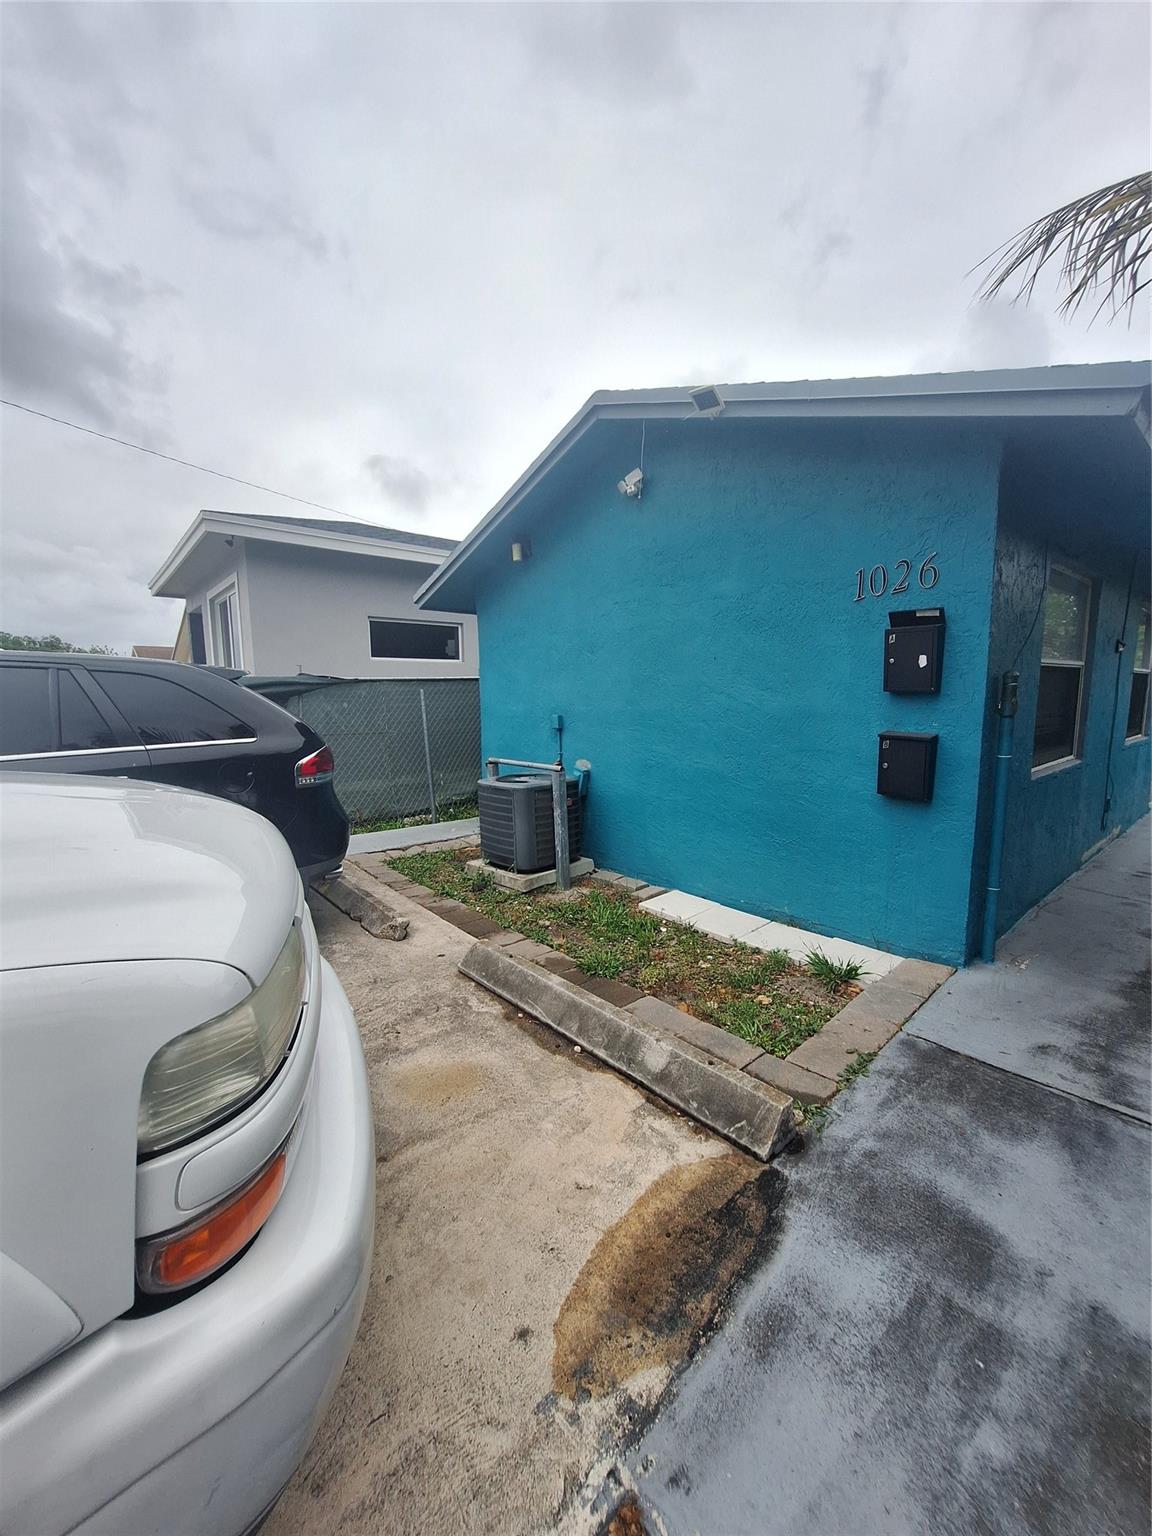
$550,000
bds
|
0
ba
|
1,350
sqft
|
built
1986
1026 NW 8th Ave, Fort Lauderdale, FL 33311
$-2,053
Cash flow
-19.5%
Cash-on-Cash Return
1.7%
Cap rate
0.4%
Rent to Value Ratio
Active
$630,000
bds
|
0
ba
|
1,642
sqft
|
built
1957
1309 NE 3rd Ave, Fort Lauderdale, FL 33304
$-1,945
Cash flow
-16.1%
Cash-on-Cash Return
2.4%
Cap rate
0.4%
Rent to Value Ratio
Active
$1,395,000
4
bds
|
0
ba
|
1,755
sqft
|
built
1954
16 SE 9th Ave, Fort Lauderdale, FL 33301
$-4,892
Cash flow
-18.3%
Cash-on-Cash Return
1.9%
Cap rate
0.4%
Rent to Value Ratio
Active
$1,250,000
bds
|
0
ba
|
2,167
sqft
|
built
1954
843 NE 17th Ave, Fort Lauderdale, FL 33304
$-5,548
Cash flow
-23.2%
Cash-on-Cash Return
0.8%
Cap rate
0.3%
Rent to Value Ratio

Active
$629,000
bds
|
0
ba
|
1,029
sqft
|
built
1951
341 SW 21st St, Fort Lauderdale, FL 33315
$-2,422
Cash flow
-20.1%
Cash-on-Cash Return
1.5%
Cap rate
0.3%
Rent to Value Ratio
Active
$740,000
bds
|
0
ba
|
1,320
sqft
|
built
1964
801 SW 10th St, Fort Lauderdale, FL 33315
$-2,887
Cash flow
-20.4%
Cash-on-Cash Return
1.5%
Cap rate
0.3%
Rent to Value Ratio
Active
$1,250,000
bds
|
0
ba
|
1,484
sqft
|
built
1939
648 NE 16th Ter, Fort Lauderdale, FL 33304
$-5,764
Cash flow
-24.1%
Cash-on-Cash Return
0.6%
Cap rate
0.2%
Rent to Value Ratio
Active
$715,000
bds
|
0
ba
|
1,353
sqft
|
built
1942
218 SW 10th St, Fort Lauderdale, FL 33315
$-2,885
Cash flow
-21.1%
Cash-on-Cash Return
1.3%
Cap rate
0.3%
Rent to Value Ratio
Active
$389,900
bds
|
0
ba
|
1,320
sqft
|
built
1956
1021 SW 24th Ave, Fort Lauderdale, FL 33312
$-1,204
Cash flow
-16.1%
Cash-on-Cash Return
2.4%
Cap rate
0.5%
Rent to Value Ratio
Active
$800,000
bds
|
0
ba
|
1,707
sqft
|
built
1957
1000 NE 17th Ct, Fort Lauderdale, FL 33305
$-3,474
Cash flow
-22.7%
Cash-on-Cash Return
0.9%
Cap rate
0.3%
Rent to Value Ratio
Active
$957,500
2
bds
|
0
ba
|
2,548
sqft
|
built
1962
1641 NE 55th St, Fort Lauderdale, FL 33334
$-3,938
Cash flow
-21.5%
Cash-on-Cash Return
1.2%
Cap rate
0.3%
Rent to Value Ratio
Active
$899,900
bds
|
0
ba
|
2,211
sqft
|
built
1951
319 SW 12th Ct, Fort Lauderdale, FL 33315
$-3,929
Cash flow
-22.8%
Cash-on-Cash Return
0.9%
Cap rate
0.3%
Rent to Value Ratio
Active
$489,000
bds
|
0
ba
|
1,356
sqft
|
built
1953
1025 NW 3rd Ave, Fort Lauderdale, FL 33311
$-1,804
Cash flow
-19.2%
Cash-on-Cash Return
1.7%
Cap rate
0.4%
Rent to Value Ratio
Active
$849,900
bds
|
0
ba
|
1,752
sqft
|
built
1959
1411 NE 12th St, Fort Lauderdale, FL 33304
$-3,111
Cash flow
-19.1%
Cash-on-Cash Return
1.8%
Cap rate
0.4%
Rent to Value Ratio
Active
$600,000
bds
|
0
ba
|
1,613
sqft
|
built
1970
3296 SW 44th St, Fort Lauderdale, FL 33312
$-2,433
Cash flow
-21.2%
Cash-on-Cash Return
1.3%
Cap rate
0.3%
Rent to Value Ratio
Active
$835,000
3
bds
|
0
ba
|
1,844
sqft
|
built
2016
1280 SW 25th Ave, Fort Lauderdale, FL 33312
$-1,753
Cash flow
-11.0%
Cash-on-Cash Return
3.6%
Cap rate
0.6%
Rent to Value Ratio
Active
$905,000
4
bds
|
0
ba
|
1,799
sqft
|
built
1968
5411 NE 22nd Ave, Fort Lauderdale, FL 33308
$-2,327
Cash flow
-13.4%
Cash-on-Cash Return
3.1%
Cap rate
0.6%
Rent to Value Ratio
Active
$555,000
bds
|
0
ba
|
1,960
sqft
|
built
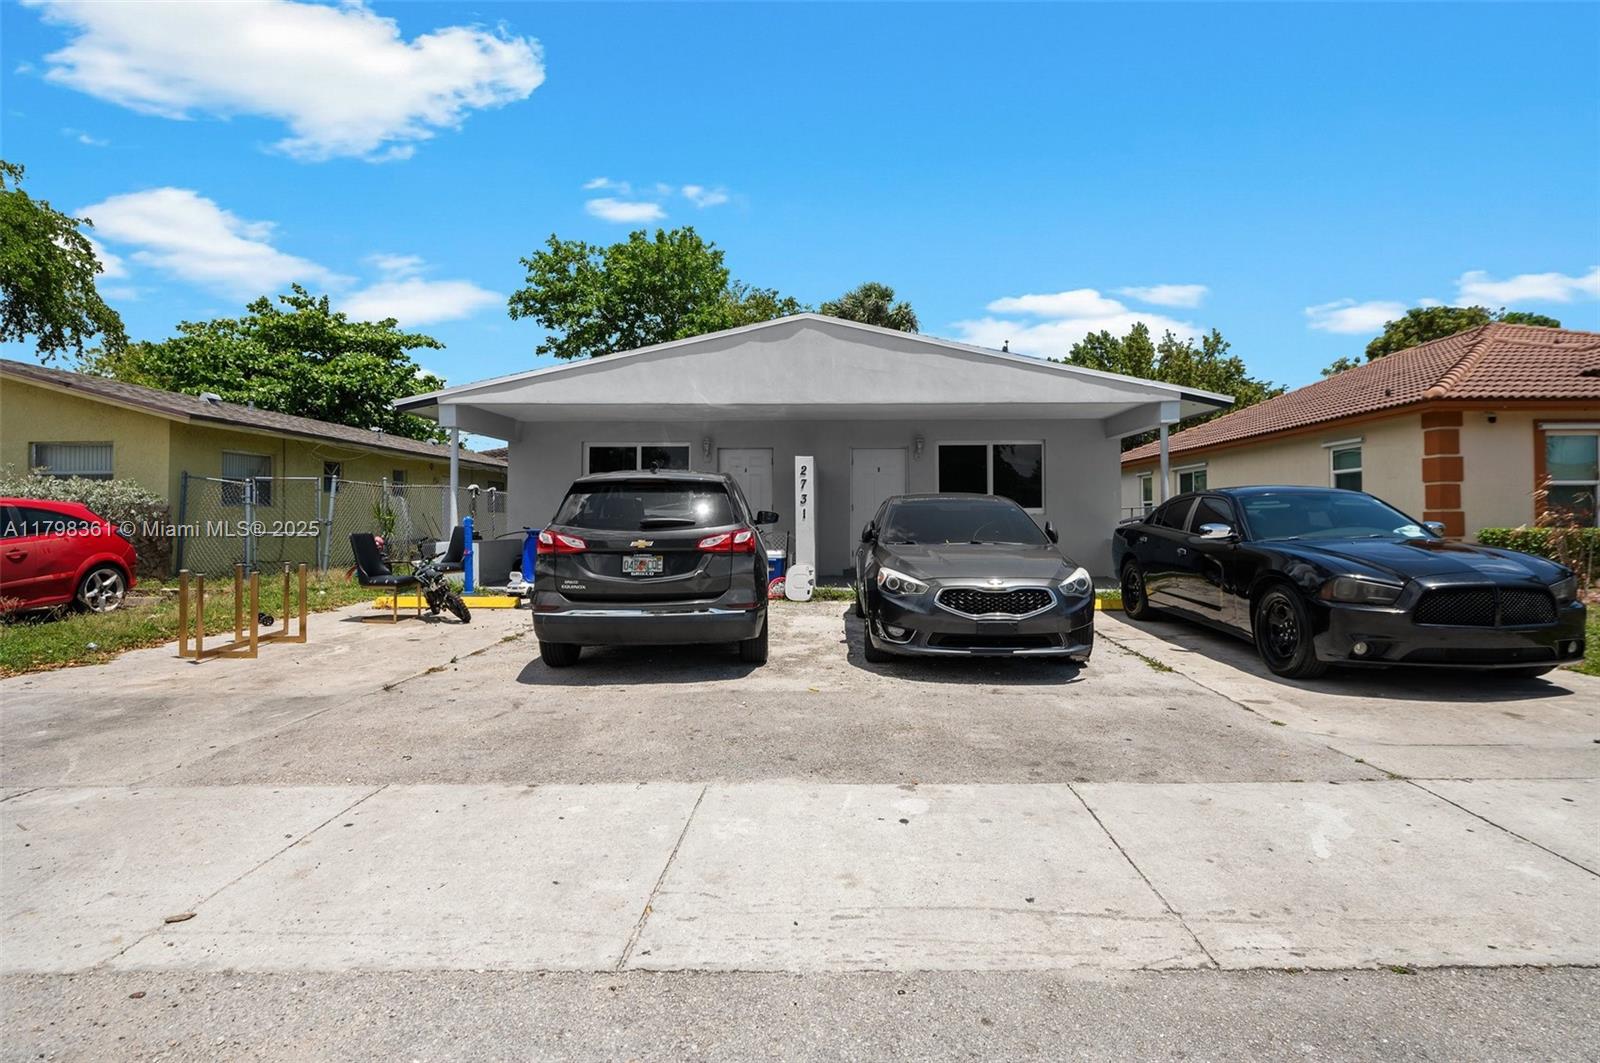
1966
2731 NW 14th St, Fort Lauderdale, FL 33311
$-1,744
Cash flow
-16.4%
Cash-on-Cash Return
2.4%
Cap rate
0.5%
Rent to Value Ratio
Active
$1,495,000
bds
|
0
ba
|
2,504
sqft
|
built
2022
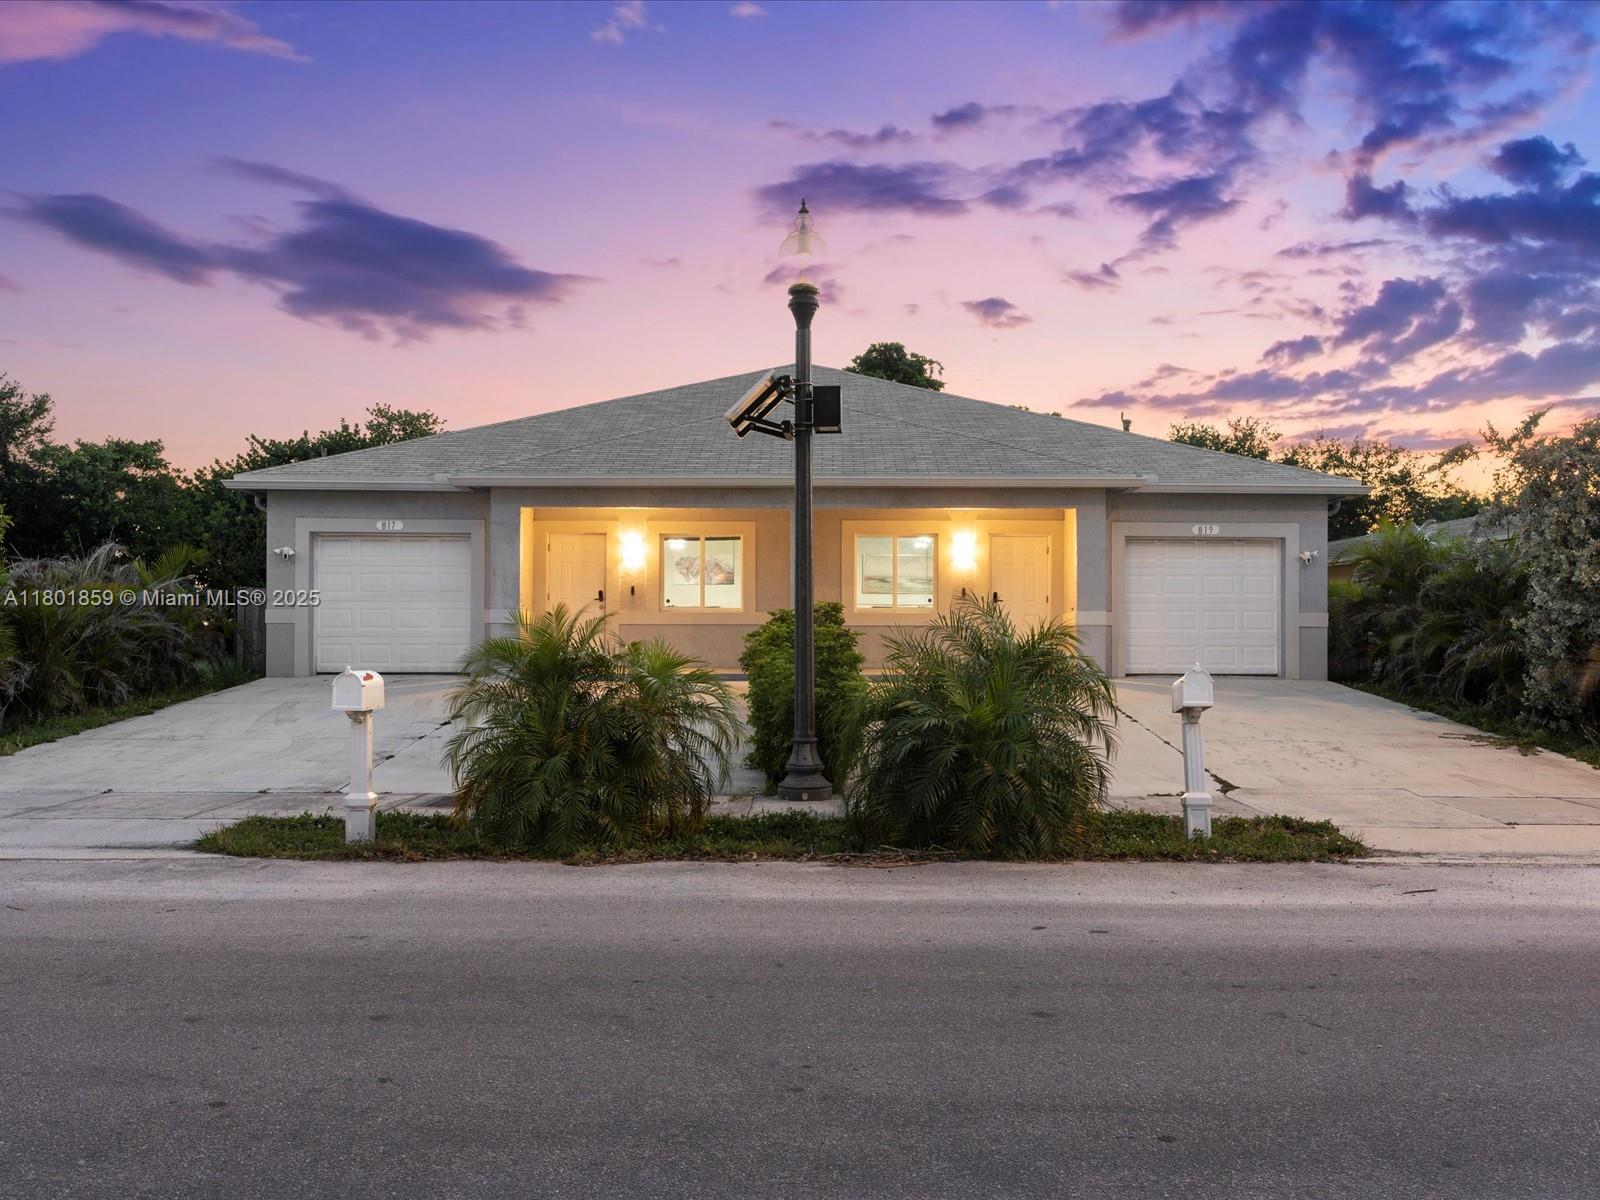
817-819 NW 1st Ave, Fort Lauderdale, FL 33311
$-7,330
Cash flow
-25.6%
Cash-on-Cash Return
0.3%
Cap rate
0.2%
Rent to Value Ratio
Active
$999,000
bds
|
0
ba
|
2,886
sqft
|
built
1958
509 SE 19th St, Fort Lauderdale, FL 33316
$-4,403
Cash flow
-23.0%
Cash-on-Cash Return
0.9%
Cap rate
0.3%
Rent to Value Ratio
Active
$725,000
bds
|
0
ba
|
2,119
sqft
|
built
1959
2631 SW 13th Ave, Fort Lauderdale, FL 33315
$-2,892
Cash flow
-20.8%
Cash-on-Cash Return
1.4%
Cap rate
0.3%
Rent to Value Ratio
Active
$625,000
bds
|
0
ba
|
1,728
sqft
|
built
1968
2641 SW 13th Ave, Fort Lauderdale, FL 33315
$-2,386
Cash flow
-19.9%
Cash-on-Cash Return
1.6%
Cap rate
0.3%
Rent to Value Ratio
Active
$999,500
bds
|
0
ba
|
2,882
sqft
|
built
1956
2808 Middle River Dr, Fort Lauderdale, FL 33306
$-4,407
Cash flow
-23.0%
Cash-on-Cash Return
0.9%
Cap rate
0.3%
Rent to Value Ratio
Active
$980,000
bds
|
0
ba
|
1,820
sqft
|
built
1962
317 Lauderdale Trl, Fort Lauderdale, FL 33312
$-4,661
Cash flow
-24.8%
Cash-on-Cash Return
0.4%
Cap rate
0.3%
Rent to Value Ratio
Active
$480,000
bds
|
0
ba
|
1,290
sqft
|
built
1964
844 NW 18th Ave, Fort Lauderdale, FL 33311
$-1,601
Cash flow
-17.4%
Cash-on-Cash Return
2.1%
Cap rate
0.4%
Rent to Value Ratio
Active
$759,000
bds
|
0
ba
|
1,690
sqft
|
built
1953
901 NE 16th St, Fort Lauderdale, FL 33304
$-2,534
Cash flow
-17.4%
Cash-on-Cash Return
2.1%
Cap rate
0.5%
Rent to Value Ratio
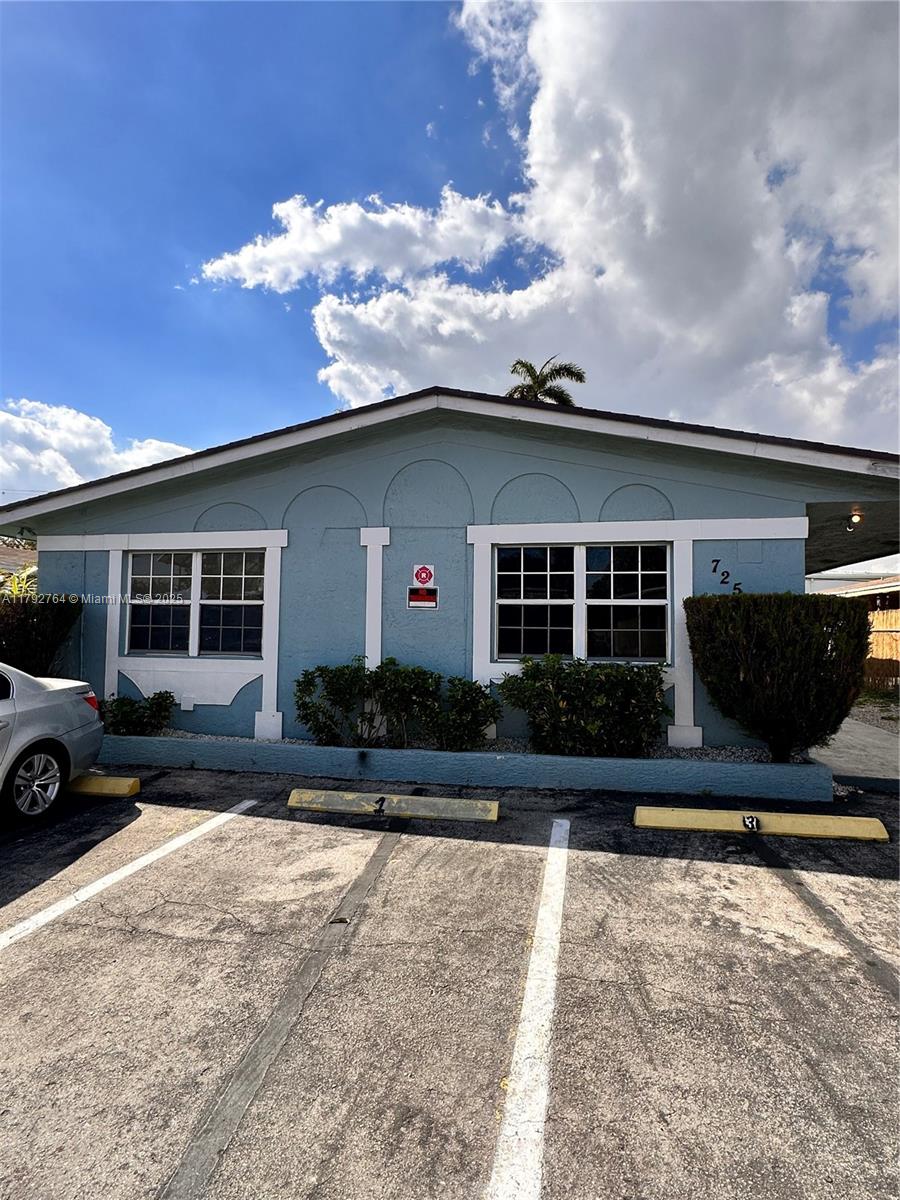
Active
$875,000
1
bds
|
0
ba
|
2,543
sqft
|
built
1962
725 NW 4th Ave, Fort Lauderdale, FL 33311
$-4,479
Cash flow
-26.7%
Cash-on-Cash Return
0.0%
Cap rate
0.2%
Rent to Value Ratio
Pending
$599,900
bds
|
0
ba
|
1,095
sqft
|
built
1954
1517 SW 25th St, Fort Lauderdale, FL 33315
$-2,612
Cash flow
-22.7%
Cash-on-Cash Return
0.9%
Cap rate
0.3%
Rent to Value Ratio
Active
$629,000
bds
|
0
ba
|
1,113
sqft
|
built
1956
1908 SW 28th St, Fort Lauderdale, FL 33315
$-1,993
Cash flow
-16.5%
Cash-on-Cash Return
2.3%
Cap rate
0.4%
Rent to Value Ratio
Active
$699,000
bds
|
0
ba
|
1,741
sqft
|
built
1969
1715 SW 21st St, Fort Lauderdale, FL 33315
$-2,878
Cash flow
-21.5%
Cash-on-Cash Return
1.2%
Cap rate
0.3%
Rent to Value Ratio

Active
$1,289,000
bds
|
0
ba
|
2,642
sqft
|
built
1966
2700 NE 57th St, Fort Lauderdale, FL 33308
$-6,599
Cash flow
-26.7%
Cash-on-Cash Return
0.0%
Cap rate
0.2%
Rent to Value Ratio

Active
$499,950
bds
|
0
ba
|
0
sqft
|
built
1959
626 NW 22nd Rd, Fort Lauderdale, FL 33311
$-1,815
Cash flow
-18.9%
Cash-on-Cash Return
1.8%
Cap rate
0.3%
Rent to Value Ratio
Active
$668,000
bds
|
0
ba
|
2,008
sqft
|
built
1963
5401 NE 18th Ave, Fort Lauderdale, FL 33334
$-3,216
Cash flow
-25.1%
Cash-on-Cash Return
0.4%
Cap rate
0.2%
Rent to Value Ratio
Active
$750,000
bds
|
0
ba
|
2,554
sqft
|
built
1971
1035 NW 8th Ave, Fort Lauderdale, FL 33311
$-3,465
Cash flow
-24.1%
Cash-on-Cash Return
0.6%
Cap rate
0.2%
Rent to Value Ratio