Fort Myers, FL Investment Properties for Sale
Browse homes for sale and investment properties in Fort Myers, FL. Refine your search by price, property type, or more.
Best cash flowing properties in Fort Myers, FL

Active
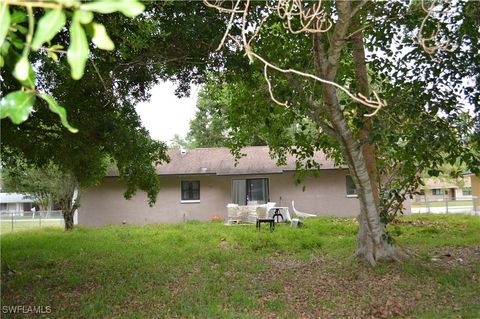
$365,000
3
bds
|
2
ba
|
1,672
sqft
|
built
1984
6181 Plumosa Ave, Fort Myers, FL 33908
$-69
Cash flow
-1.0%
Cash-on-Cash Return
5.9%
Cap rate
0.8%
Rent to Value Ratio
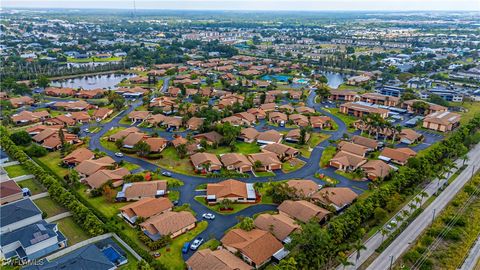
Active
$325,000
3
bds
|
2
ba
|
1,369
sqft
|
built
1958
5521 Granada Rd, Fort Myers, FL 33919
$-151
Cash flow
-2.4%
Cash-on-Cash Return
5.6%
Cap rate
0.7%
Rent to Value Ratio
1,422 out of 1,480 properties for sale in Fort Myers, FL
Limited Results Shown
Create a free account, or log in to reveal all property listings and enjoy the complete experience.
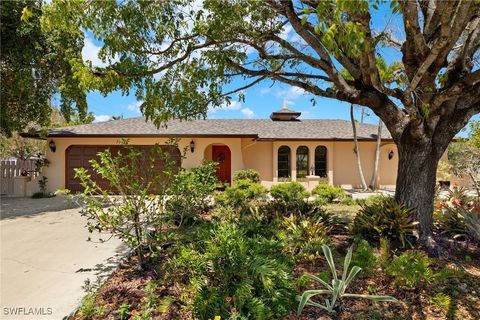
Active
$274,900
3
bds
|
2
ba
|
1,378
sqft
|
built
1982
17348 Birchwood Ln, Fort Myers, FL 33908
$-201
Cash flow
-3.8%
Cash-on-Cash Return
5.3%
Cap rate
0.8%
Rent to Value Ratio
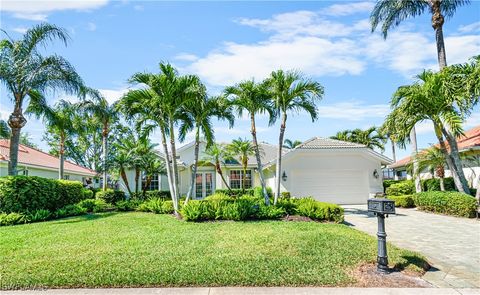
Active
$440,000
4
bds
|
2
ba
|
1,943
sqft
|
built
2003
13432 Bristol Park Way, Fort Myers, FL 33913
$-1,024
Cash flow
-12.1%
Cash-on-Cash Return
3.4%
Cap rate
0.6%
Rent to Value Ratio
Active
$749,000
3
bds
|
2
ba
|
2,624
sqft
|
built
1977
13794 River Forest Dr, Fort Myers, FL 33905
$-1,810
Cash flow
-12.6%
Cash-on-Cash Return
3.2%
Cap rate
0.4%
Rent to Value Ratio

Active
$2,200,000
4
bds
|
4
ba
|
3,925
sqft
|
built
2004
8541 Belle Meade Dr, Fort Myers, FL 33908
$-8,113
Cash flow
-19.2%
Cash-on-Cash Return
1.7%
Cap rate
0.3%
Rent to Value Ratio
Active
$600,000
4
bds
|
3
ba
|
2,677
sqft
|
built
2014
11221 Yellow Poplar Dr, Fort Myers, FL 33913
$-1,630
Cash flow
-14.2%
Cash-on-Cash Return
2.9%
Cap rate
0.6%
Rent to Value Ratio
Active
$700,000
3
bds
|
3
ba
|
2,300
sqft
|
built
1999
8066 Glen Abbey Cir, Fort Myers, FL 33912
$-3,468
Cash flow
-25.8%
Cash-on-Cash Return
0.2%
Cap rate
0.6%
Rent to Value Ratio

Active
$330,000
2
bds
|
2
ba
|
1,306
sqft
|
built
1985
6204 Island Park Ct, Fort Myers, FL 33908
$-419
Cash flow
-6.6%
Cash-on-Cash Return
4.6%
Cap rate
0.6%
Rent to Value Ratio
Active
$615,000
4
bds
|
4
ba
|
3,429
sqft
|
built
1985
14687 Triple Eagle Ct, Fort Myers, FL 33912
$-558
Cash flow
-4.7%
Cash-on-Cash Return
5.1%
Cap rate
0.8%
Rent to Value Ratio

Active
$945,000
5
bds
|
5
ba
|
3,575
sqft
|
built
2006
8945 Tropical Ct, Fort Myers, FL 33908
$-2,080
Cash flow
-11.5%
Cash-on-Cash Return
3.5%
Cap rate
0.6%
Rent to Value Ratio
Active
$325,000
3
bds
|
2
ba
|
1,369
sqft
|
built
1958
5521 Granada Rd, Fort Myers, FL 33919
$-151
Cash flow
-2.4%
Cash-on-Cash Return
5.6%
Cap rate
0.7%
Rent to Value Ratio
Active
$385,000
3
bds
|
3
ba
|
1,620
sqft
|
built
1995
2040 Clarke Ave, Fort Myers, FL 33905
$-678
Cash flow
-9.2%
Cash-on-Cash Return
4.0%
Cap rate
0.6%
Rent to Value Ratio
Active
$799,900
3
bds
|
4
ba
|
2,782
sqft
|
built
2006
16025 Waterleaf Ln, Fort Myers, FL 33908
$-1,745
Cash flow
-11.4%
Cash-on-Cash Return
3.5%
Cap rate
0.6%
Rent to Value Ratio
Active
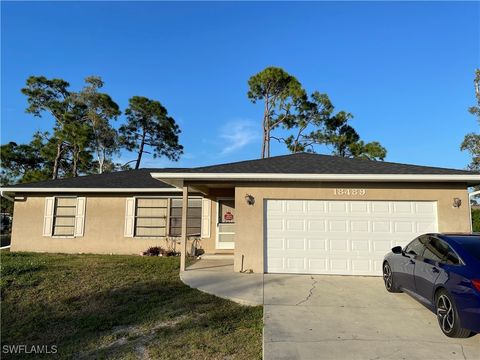
$355,000
3
bds
|
2
ba
|
1,205
sqft
|
built
1990
18489 Sunflower Rd, Fort Myers, FL 33967
$-596
Cash flow
-8.8%
Cash-on-Cash Return
4.1%
Cap rate
0.6%
Rent to Value Ratio
Active
$419,900
3
bds
|
2
ba
|
1,820
sqft
|
built
2003
11700 Pine Timber Ln, Fort Myers, FL 33913
$-707
Cash flow
-8.8%
Cash-on-Cash Return
4.1%
Cap rate
0.7%
Rent to Value Ratio
Active
$625,000
3
bds
|
4
ba
|
2,099
sqft
|
built
2020
19657 Estero Pointe Ln, Fort Myers, FL 33908
$-1,226
Cash flow
-10.2%
Cash-on-Cash Return
3.8%
Cap rate
0.6%
Rent to Value Ratio
Active
$249,900
3
bds
|
2
ba
|
984
sqft
|
built
1995
13831 3rd St, Fort Myers, FL 33905
$-259
Cash flow
-5.4%
Cash-on-Cash Return
4.9%
Cap rate
0.7%
Rent to Value Ratio
Active
$239,000
2
bds
|
2
ba
|
1,138
sqft
|
built
1984
6454 Royal Woods Dr, Fort Myers, FL 33908
$-402
Cash flow
-8.8%
Cash-on-Cash Return
4.1%
Cap rate
0.8%
Rent to Value Ratio
Active
$575,000
3
bds
|
2
ba
|
1,785
sqft
|
built
1998
11146 Callaway Greens Dr, Fort Myers, FL 33913
$-1,060
Cash flow
-9.6%
Cash-on-Cash Return
3.9%
Cap rate
0.7%
Rent to Value Ratio

Active
$2,800,000
6
bds
|
7
ba
|
5,031
sqft
|
built
2006
12581 Vittoria Way, Fort Myers, FL 33912
$-12,860
Cash flow
-24.0%
Cash-on-Cash Return
0.6%
Cap rate
0.2%
Rent to Value Ratio
Active
$485,000
3
bds
|
3
ba
|
1,858
sqft
|
built
1984
1011 El Mar Ave, Fort Myers, FL 33919
$-791
Cash flow
-8.5%
Cash-on-Cash Return
4.2%
Cap rate
0.6%
Rent to Value Ratio
Active
$899,900
3
bds
|
3
ba
|
2,312
sqft
|
built
2022
8517 S Lake Cir, Fort Myers, FL 33908
$-2,771
Cash flow
-16.1%
Cash-on-Cash Return
2.5%
Cap rate
0.4%
Rent to Value Ratio
Active
$365,000
3
bds
|
2
ba
|
1,672
sqft
|
built
1984
6181 Plumosa Ave, Fort Myers, FL 33908
$-69
Cash flow
-1.0%
Cash-on-Cash Return
5.9%
Cap rate
0.8%
Rent to Value Ratio
Active
$495,000
2
bds
|
2
ba
|
1,525
sqft
|
built
1964
6325 Park Rd, Fort Myers, FL 33908
$-366
Cash flow
-3.9%
Cash-on-Cash Return
5.3%
Cap rate
0.7%
Rent to Value Ratio

Active
$415,000
3
bds
|
2
ba
|
1,888
sqft
|
built
1956
3717 Rogers St, Fort Myers, FL 33901
$-719
Cash flow
-9.0%
Cash-on-Cash Return
4.1%
Cap rate
0.6%
Rent to Value Ratio
Active
$1,675,000
3
bds
|
3
ba
|
2,488
sqft
|
built
2020
19129 Aqua Shore Dr, Fort Myers, FL 33913
$-5,015
Cash flow
-15.6%
Cash-on-Cash Return
2.6%
Cap rate
0.4%
Rent to Value Ratio

Active
$865,000
4
bds
|
3
ba
|
2,797
sqft
|
built
1958
3835 Harold Ave, Fort Myers, FL 33901
$-1,954
Cash flow
-11.8%
Cash-on-Cash Return
3.4%
Cap rate
0.5%
Rent to Value Ratio
Active
$372,000
3
bds
|
2
ba
|
1,618
sqft
|
built
1985
8429 Winged Foot Dr, Fort Myers, FL 33967
$-534
Cash flow
-7.5%
Cash-on-Cash Return
4.4%
Cap rate
0.7%
Rent to Value Ratio
Active
$739,000
3
bds
|
4
ba
|
2,382
sqft
|
built
2007
18200 Creekside View Dr, Fort Myers, FL 33908
$-1,968
Cash flow
-13.9%
Cash-on-Cash Return
3.0%
Cap rate
0.6%
Rent to Value Ratio
Active
$699,000
4
bds
|
4
ba
|
2,466
sqft
|
built
2002
8452 Southwind Bay Cir, Fort Myers, FL 33908
$-1,777
Cash flow
-13.3%
Cash-on-Cash Return
3.1%
Cap rate
0.6%
Rent to Value Ratio
Active
$425,000
3
bds
|
2
ba
|
1,661
sqft
|
built
2004
3180 Bramble Cove Ct, Fort Myers, FL 33905
$-1,227
Cash flow
-15.1%
Cash-on-Cash Return
2.7%
Cap rate
0.7%
Rent to Value Ratio
Active
$595,000
4
bds
|
3
ba
|
2,032
sqft
|
built
2020
11690 Timber Creek Dr, Fort Myers, FL 33913
$-1,098
Cash flow
-9.6%
Cash-on-Cash Return
3.9%
Cap rate
0.7%
Rent to Value Ratio
Active
$609,000
4
bds
|
3
ba
|
2,752
sqft
|
built
2004
7709 Victoria Cove Ct, Fort Myers, FL 33908
$-1,124
Cash flow
-9.6%
Cash-on-Cash Return
3.9%
Cap rate
0.6%
Rent to Value Ratio
Active
$769,000
4
bds
|
3
ba
|
2,688
sqft
|
built
2001
15420 Greenock Ln, Fort Myers, FL 33912
$-3,418
Cash flow
-23.2%
Cash-on-Cash Return
0.8%
Cap rate
0.5%
Rent to Value Ratio
Active
$414,900
3
bds
|
3
ba
|
1,958
sqft
|
built
2014
11211 Yellow Poplar Dr, Fort Myers, FL 33913
$-1,392
Cash flow
-17.5%
Cash-on-Cash Return
2.1%
Cap rate
0.6%
Rent to Value Ratio
Active
$1,799,000
4
bds
|
3
ba
|
2,709
sqft
|
built
1995
14971 David Dr, Fort Myers, FL 33908
$-5,735
Cash flow
-16.6%
Cash-on-Cash Return
2.3%
Cap rate
0.3%
Rent to Value Ratio
Active
$1,350,000
3
bds
|
2
ba
|
2,103
sqft
|
built
1974
14701 Eden St, Fort Myers, FL 33908
$-3,586
Cash flow
-13.9%
Cash-on-Cash Return
3.0%
Cap rate
0.5%
Rent to Value Ratio
Active
$895,000
4
bds
|
3
ba
|
2,479
sqft
|
built
2004
8860 New Castle Dr, Fort Myers, FL 33908
$-3,036
Cash flow
-17.7%
Cash-on-Cash Return
2.1%
Cap rate
0.4%
Rent to Value Ratio
Active
$342,500
3
bds
|
2
ba
|
1,508
sqft
|
built
1972
18215 Iris Rd, Fort Myers, FL 33967
$-428
Cash flow
-6.5%
Cash-on-Cash Return
4.6%
Cap rate
0.7%
Rent to Value Ratio

Active
$355,000
3
bds
|
2
ba
|
1,667
sqft
|
built
2011
10486 Winged Elm Ln, Fort Myers, FL 33913
$-532
Cash flow
-7.8%
Cash-on-Cash Return
4.3%
Cap rate
0.8%
Rent to Value Ratio
Active
$2,050,000
5
bds
|
5
ba
|
4,023
sqft
|
built
1998
11133 Harbour Estates Cir, Fort Myers, FL 33908
$-7,801
Cash flow
-19.9%
Cash-on-Cash Return
1.6%
Cap rate
0.3%
Rent to Value Ratio