Fort Myers, FL Investment Properties for Sale
Browse homes for sale and investment properties in Fort Myers, FL. Refine your search by price, property type, or more.
Best cash flowing properties in Fort Myers, FL
Active
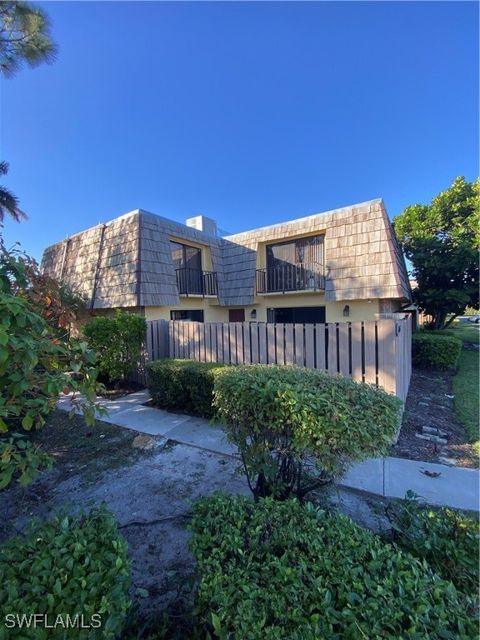
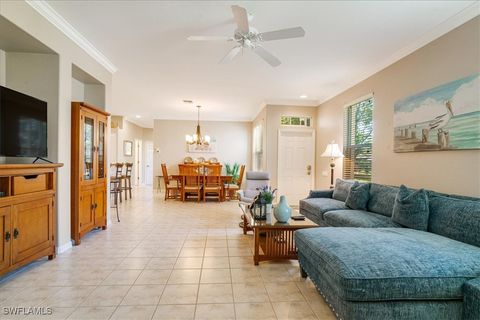
$225,000
2
bds
|
2
ba
|
1,221
sqft
|
built
1980
4140 Steamboat Bnd E, Fort Myers, FL 33919
$1,507
Cash flow
34.9%
Cash-on-Cash Return
14.3%
Cap rate
1.7%
Rent to Value Ratio
Active
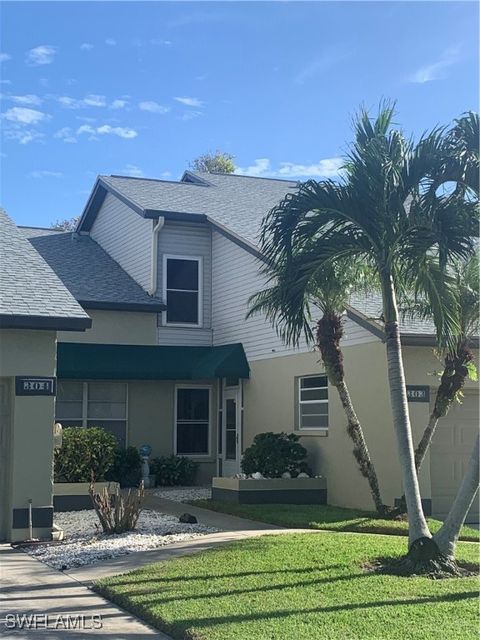
$140,000
2
bds
|
2
ba
|
1,130
sqft
|
built
1984
13508 Siesta Pines Ct, Fort Myers, FL 33908
$497
Cash flow
18.5%
Cash-on-Cash Return
10.5%
Cap rate
1.3%
Rent to Value Ratio
2,868 out of 3,028 properties for sale in Fort Myers, FL
Limited Results Shown
Create a free account, or log in to reveal all property listings and enjoy the complete experience.
Active
$895,000
3
bds
|
3
ba
|
2,259
sqft
|
built
1981
381 Norwood Ct, Fort Myers, FL 33919
$-1,209
Cash flow
-7.0%
Cash-on-Cash Return
4.6%
Cap rate
0.6%
Rent to Value Ratio

Active
$239,000
2
bds
|
2
ba
|
1,333
sqft
|
built
2005
9583 Hemingway Ln, Fort Myers, FL 33913
$-333
Cash flow
-7.3%
Cash-on-Cash Return
4.6%
Cap rate
0.9%
Rent to Value Ratio
Active
$555,000
4
bds
|
3
ba
|
3,036
sqft
|
built
2004
9883 Blue Stone Cir, Fort Myers, FL 33913
$-952
Cash flow
-8.9%
Cash-on-Cash Return
4.2%
Cap rate
0.7%
Rent to Value Ratio
Active
$1,299,000
3
bds
|
4
ba
|
3,588
sqft
|
built
2007
6740 Mossy Glen Dr, Fort Myers, FL 33908
$-3,679
Cash flow
-14.8%
Cash-on-Cash Return
2.9%
Cap rate
0.5%
Rent to Value Ratio
Active
$560,000
4
bds
|
3
ba
|
2,032
sqft
|
built
2018
10708 Essex Square Blvd, Fort Myers, FL 33913
$-1,205
Cash flow
-11.2%
Cash-on-Cash Return
3.7%
Cap rate
0.7%
Rent to Value Ratio
Active
$2,795,000
6
bds
|
7
ba
|
6,807
sqft
|
built
1975
13580 Brynwood Ln, Fort Myers, FL 33912
$-9,879
Cash flow
-18.4%
Cash-on-Cash Return
2.0%
Cap rate
0.3%
Rent to Value Ratio
Active
$639,500
4
bds
|
3
ba
|
2,780
sqft
|
built
2007
6681 Dabney St, Fort Myers, FL 33966
$-776
Cash flow
-6.3%
Cash-on-Cash Return
4.8%
Cap rate
0.6%
Rent to Value Ratio
Active
$199,000
2
bds
|
2
ba
|
1,260
sqft
|
built
1980
1607 Park Meadows Dr, Fort Myers, FL 33907
$-172
Cash flow
-4.5%
Cash-on-Cash Return
5.2%
Cap rate
0.9%
Rent to Value Ratio

Active
$339,000
4
bds
|
2
ba
|
0
sqft
|
built
1971
648 Carolina Ave, Fort Myers, FL 33905
$-860
Cash flow
-13.2%
Cash-on-Cash Return
3.2%
Cap rate
0.5%
Rent to Value Ratio
Active
$559,000
3
bds
|
2
ba
|
2,142
sqft
|
built
1993
9548 Mariners Cove Ln, Fort Myers, FL 33919
$-813
Cash flow
-7.6%
Cash-on-Cash Return
4.5%
Cap rate
0.7%
Rent to Value Ratio
Active
$850,000
4
bds
|
3
ba
|
2,613
sqft
|
built
1980
13750 Mc Gregor Blvd, Fort Myers, FL 33919
$-1,092
Cash flow
-6.7%
Cash-on-Cash Return
4.7%
Cap rate
0.6%
Rent to Value Ratio

Active
$900,000
4
bds
|
3
ba
|
3,018
sqft
|
built
2002
8921 Crown Colony Blvd, Fort Myers, FL 33908
$-1,445
Cash flow
-8.4%
Cash-on-Cash Return
4.3%
Cap rate
0.7%
Rent to Value Ratio
Active
$199,900
2
bds
|
2
ba
|
1,058
sqft
|
built
1991
17160 Hawks Nest, Fort Myers, FL 33908
$-731
Cash flow
-19.1%
Cash-on-Cash Return
1.9%
Cap rate
0.9%
Rent to Value Ratio
Active
$345,000
3
bds
|
2
ba
|
1,383
sqft
|
built
1999
8784 Middlebrook Dr, Fort Myers, FL 33908
$-637
Cash flow
-9.6%
Cash-on-Cash Return
4.0%
Cap rate
0.7%
Rent to Value Ratio
Pending
$259,000
3
bds
|
3
ba
|
1,653
sqft
|
built
1989
303 Mc Gregor Park Cir, Fort Myers, FL 33908
$-618
Cash flow
-12.4%
Cash-on-Cash Return
3.4%
Cap rate
0.8%
Rent to Value Ratio
Active
$225,000
2
bds
|
2
ba
|
1,221
sqft
|
built
1980
4140 Steamboat Bnd E, Fort Myers, FL 33919
$1,507
Cash flow
34.9%
Cash-on-Cash Return
14.3%
Cap rate
1.7%
Rent to Value Ratio
Active
$140,000
2
bds
|
2
ba
|
1,130
sqft
|
built
1984
13508 Siesta Pines Ct, Fort Myers, FL 33908
$497
Cash flow
18.5%
Cash-on-Cash Return
10.5%
Cap rate
1.3%
Rent to Value Ratio
Active
$589,500
4
bds
|
3
ba
|
2,609
sqft
|
built
2023
6692 Estero Bay Dr, Fort Myers, FL 33908
$-1,160
Cash flow
-10.3%
Cash-on-Cash Return
3.9%
Cap rate
0.6%
Rent to Value Ratio

Active
$995,000
3
bds
|
3
ba
|
2,851
sqft
|
built
1995
6090 Tidewater Island Cir, Fort Myers, FL 33908
$-1,596
Cash flow
-8.4%
Cash-on-Cash Return
4.3%
Cap rate
0.6%
Rent to Value Ratio
Active
$254,000
3
bds
|
2
ba
|
1,223
sqft
|
built
2006
3525 Milan Dr, Fort Myers, FL 33916
$-328
Cash flow
-6.7%
Cash-on-Cash Return
4.7%
Cap rate
0.8%
Rent to Value Ratio
Active
$257,500
2
bds
|
2
ba
|
1,112
sqft
|
built
1988
16500 Ginger Ln, Fort Myers, FL 33908
$-823
Cash flow
-16.7%
Cash-on-Cash Return
2.4%
Cap rate
0.8%
Rent to Value Ratio
Active
$300,000
3
bds
|
2
ba
|
1,346
sqft
|
built
1964
1900 Clifford St, Fort Myers, FL 33901
$-1,914
Cash flow
-33.3%
Cash-on-Cash Return
-1.4%
Cap rate
0.7%
Rent to Value Ratio
Active
$400,000
3
bds
|
2
ba
|
1,860
sqft
|
built
1970
5051 Nature Way, Fort Myers, FL 33905
$-712
Cash flow
-9.3%
Cash-on-Cash Return
4.1%
Cap rate
0.7%
Rent to Value Ratio

Active
$379,900
4
bds
|
3
ba
|
0
sqft
|
built
2002
127 Blackstone Dr, Fort Myers, FL 33913
$-641
Cash flow
-8.8%
Cash-on-Cash Return
4.2%
Cap rate
0.6%
Rent to Value Ratio

Active
$624,900
3
bds
|
3
ba
|
2,465
sqft
|
built
2002
8500 Southwind Bay Cir, Fort Myers, FL 33908
$-750
Cash flow
-6.3%
Cash-on-Cash Return
4.8%
Cap rate
0.7%
Rent to Value Ratio
Active
$309,900
3
bds
|
2
ba
|
1,738
sqft
|
built
2004
10009 Sky View Way, Fort Myers, FL 33913
$-1,194
Cash flow
-20.1%
Cash-on-Cash Return
1.6%
Cap rate
0.7%
Rent to Value Ratio
Active
$659,000
3
bds
|
2
ba
|
2,009
sqft
|
built
2017
11837 Darcy Pl, Fort Myers, FL 33913
$-1,737
Cash flow
-13.8%
Cash-on-Cash Return
3.1%
Cap rate
0.6%
Rent to Value Ratio
Active
$375,000
2
bds
|
2
ba
|
1,926
sqft
|
built
1983
5260 S Landings Dr, Fort Myers, FL 33919
$-824
Cash flow
-11.5%
Cash-on-Cash Return
3.6%
Cap rate
0.7%
Rent to Value Ratio
Active
$124,900
2
bds
|
2
ba
|
988
sqft
|
built
1979
7023 Cedarhurst Dr, Fort Myers, FL 33919
$-246
Cash flow
-10.3%
Cash-on-Cash Return
3.9%
Cap rate
1.1%
Rent to Value Ratio

Active
$1,500,000
4
bds
|
4
ba
|
3,445
sqft
|
built
1961
2943 Valencia Way, Fort Myers, FL 33901
$-3,462
Cash flow
-12.0%
Cash-on-Cash Return
3.5%
Cap rate
0.5%
Rent to Value Ratio

Active
$2,695,000
4
bds
|
6
ba
|
4,531
sqft
|
built
2021
11501 Venetian Lagoon Dr, Fort Myers, FL 33913
$-9,861
Cash flow
-19.1%
Cash-on-Cash Return
1.9%
Cap rate
0.4%
Rent to Value Ratio

Active
$975,000
4
bds
|
2
ba
|
2,267
sqft
|
built
1973
14690 Eden St, Fort Myers, FL 33908
$-1,367
Cash flow
-7.3%
Cash-on-Cash Return
4.6%
Cap rate
0.6%
Rent to Value Ratio

Active
$300,000
2
bds
|
2
ba
|
1,312
sqft
|
built
1966
3834 La Palma St, Fort Myers, FL 33901
$-374
Cash flow
-6.5%
Cash-on-Cash Return
4.8%
Cap rate
0.7%
Rent to Value Ratio
Active
$389,000
2
bds
|
1
ba
|
1,520
sqft
|
built
1977
2199 Santiago Ave, Fort Myers, FL 33905
$-449
Cash flow
-6.0%
Cash-on-Cash Return
4.9%
Cap rate
0.6%
Rent to Value Ratio

Active
$220,000
2
bds
|
2
ba
|
1,342
sqft
|
built
1986
7119 Lakeridge View Ct, Fort Myers, FL 33907
$-140
Cash flow
-3.3%
Cash-on-Cash Return
5.5%
Cap rate
0.9%
Rent to Value Ratio
Active
$145,000
2
bds
|
2
ba
|
1,080
sqft
|
built
1979
2366 E Mall Dr, Fort Myers, FL 33901
$-349
Cash flow
-12.6%
Cash-on-Cash Return
3.4%
Cap rate
1.1%
Rent to Value Ratio
Active
$2,925,000
4
bds
|
6
ba
|
4,513
sqft
|
built
2020
11451 Venetian Lagoon Dr, Fort Myers, FL 33913
$-10,884
Cash flow
-19.4%
Cash-on-Cash Return
1.8%
Cap rate
0.3%
Rent to Value Ratio

Active
$789,900
3
bds
|
2
ba
|
2,116
sqft
|
built
1996
14811 Laguna Dr, Fort Myers, FL 33908
$-2,471
Cash flow
-16.3%
Cash-on-Cash Return
2.5%
Cap rate
0.6%
Rent to Value Ratio

Active
$360,000
3
bds
|
2
ba
|
1,670
sqft
|
built
1981
6030 Perthshire Ln, Fort Myers, FL 33908
$-277
Cash flow
-4.0%
Cash-on-Cash Return
5.3%
Cap rate
0.8%
Rent to Value Ratio

Active
$329,900
2
bds
|
2
ba
|
1,586
sqft
|
built
1998
16491 Millstone Cir, Fort Myers, FL 33908
$-1,113
Cash flow
-17.6%
Cash-on-Cash Return
2.2%
Cap rate
0.8%
Rent to Value Ratio