Fort Myers, FL Investment Properties for Sale
Browse homes for sale and investment properties in Fort Myers, FL. Refine your search by price, property type, or more.
Best cash flowing properties in Fort Myers, FL
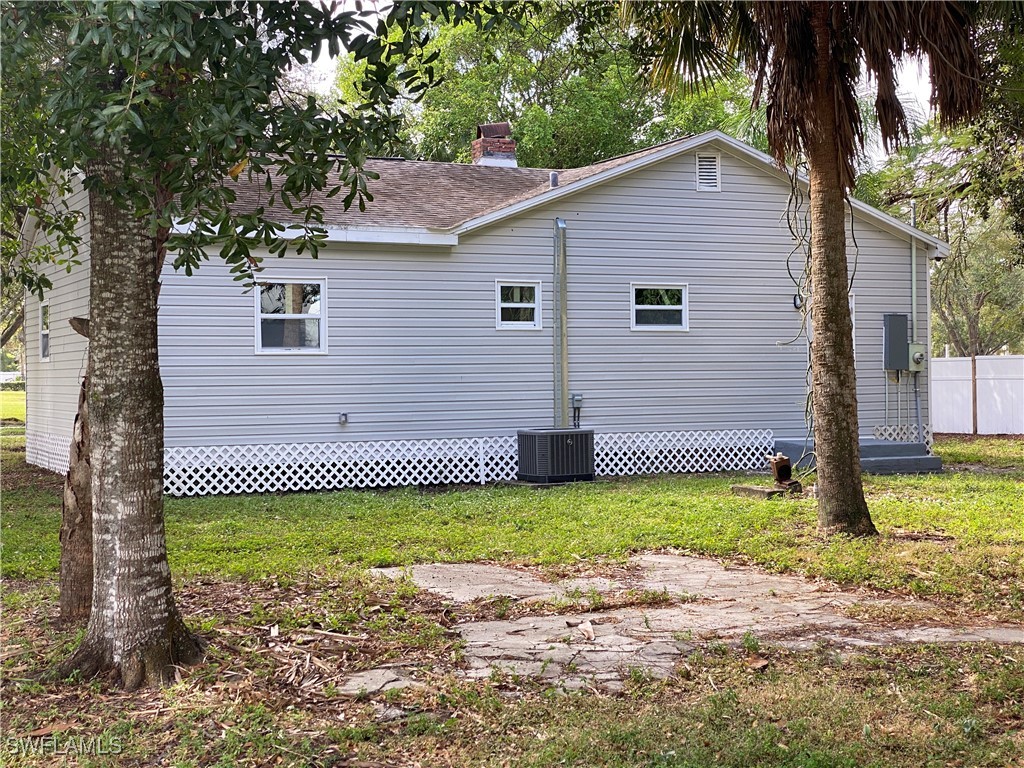
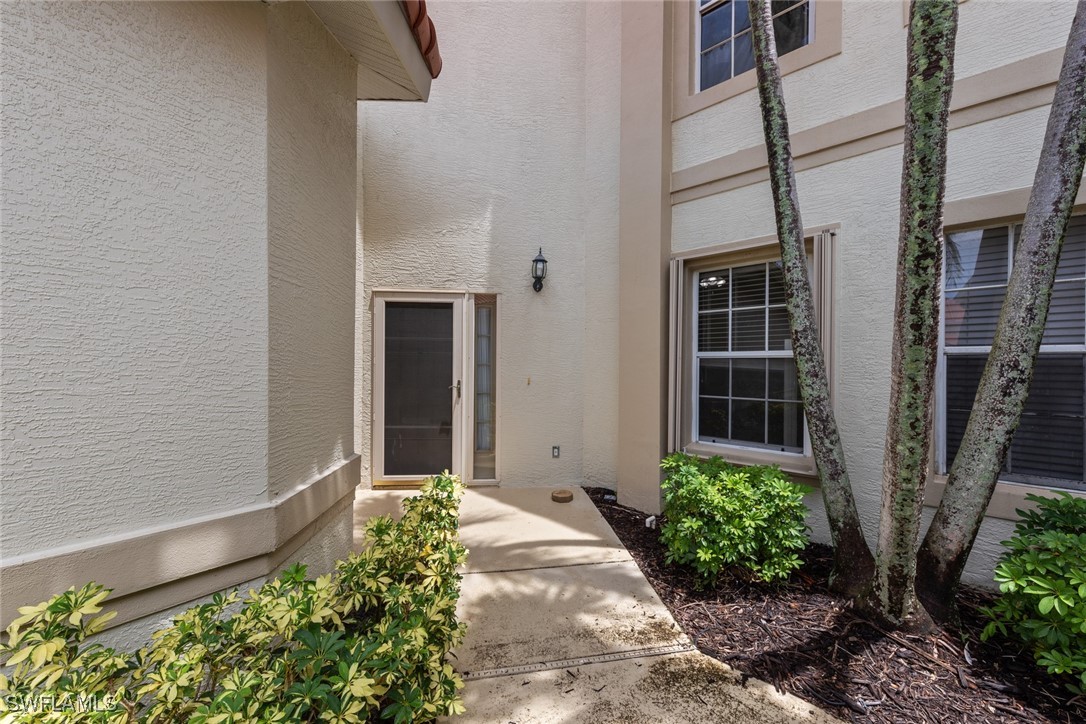
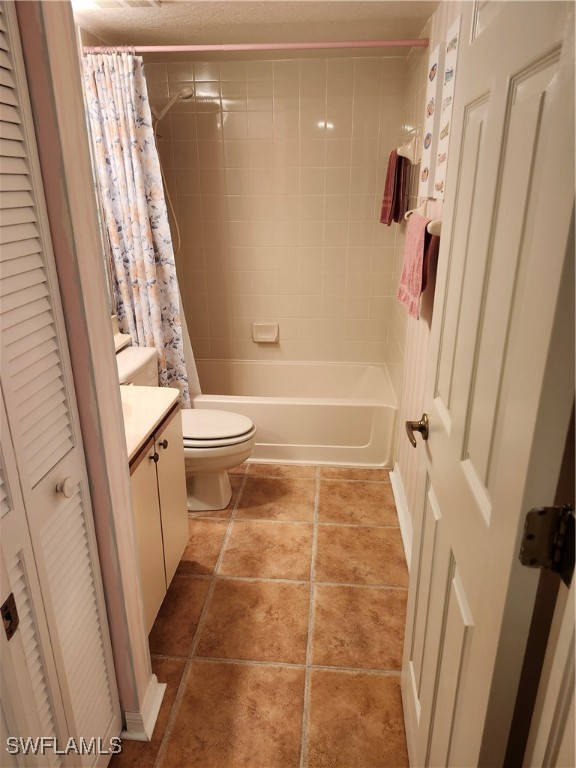
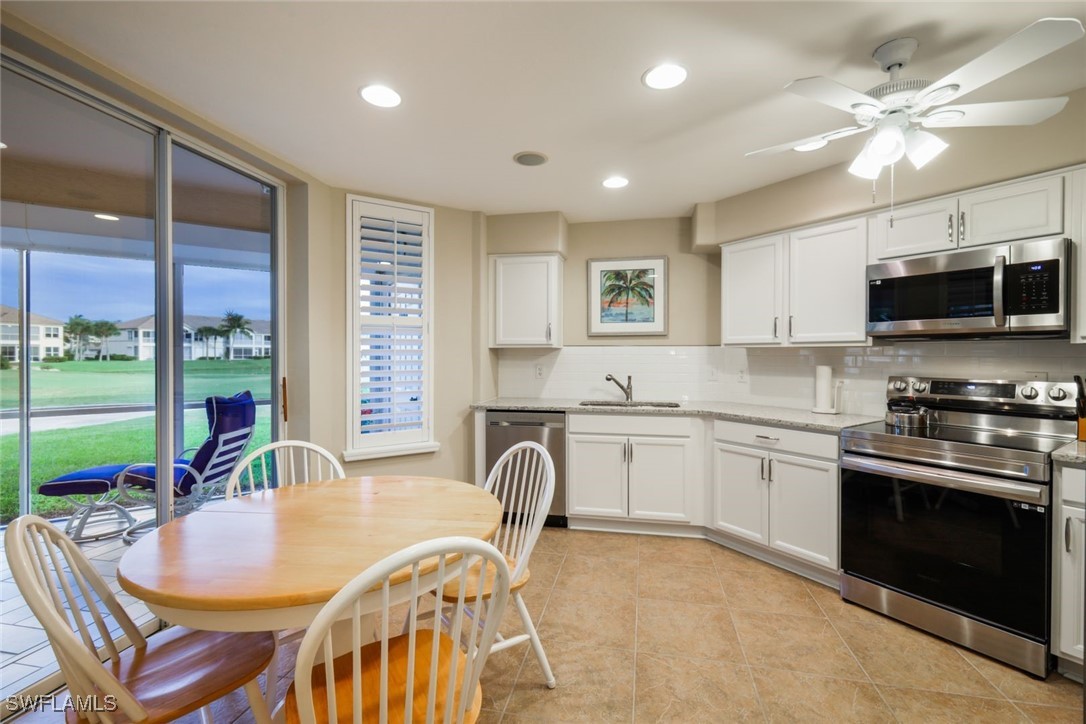
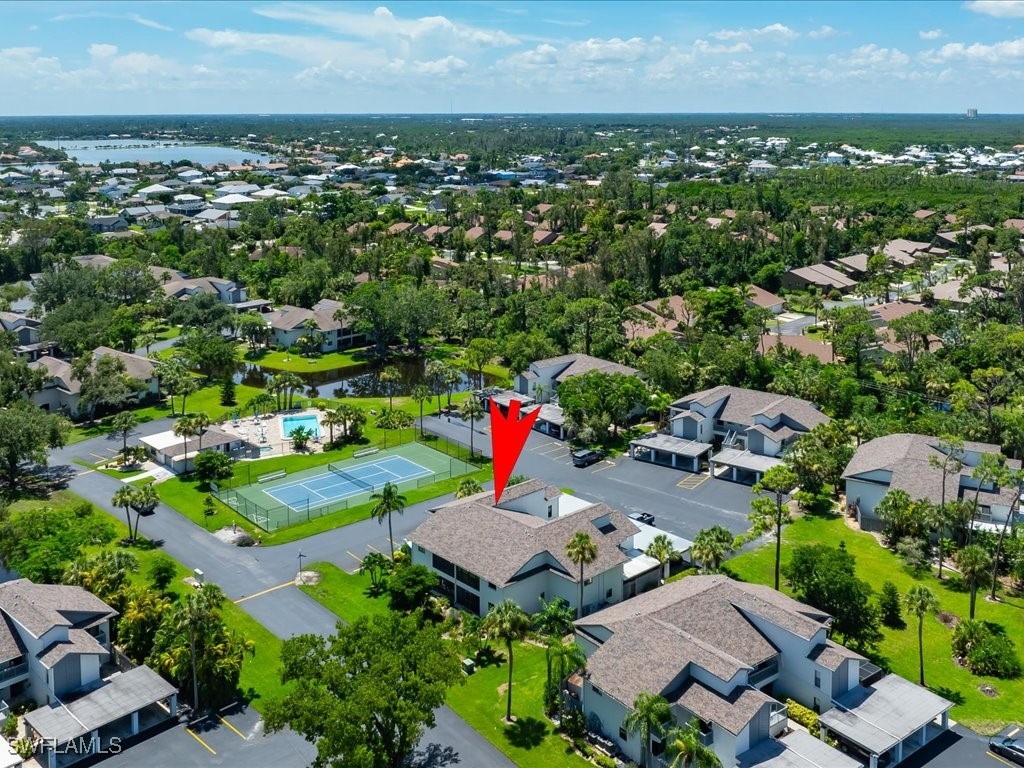
Active under contract
$229,999
2
bds
|
2
ba
|
1,108
sqft
|
built
1988
16600 Ginger Ln, Fort Myers, FL 33908
$194
Cash flow
4.4%
Cash-on-Cash Return
7.2%
Cap rate
0.9%
Rent to Value Ratio
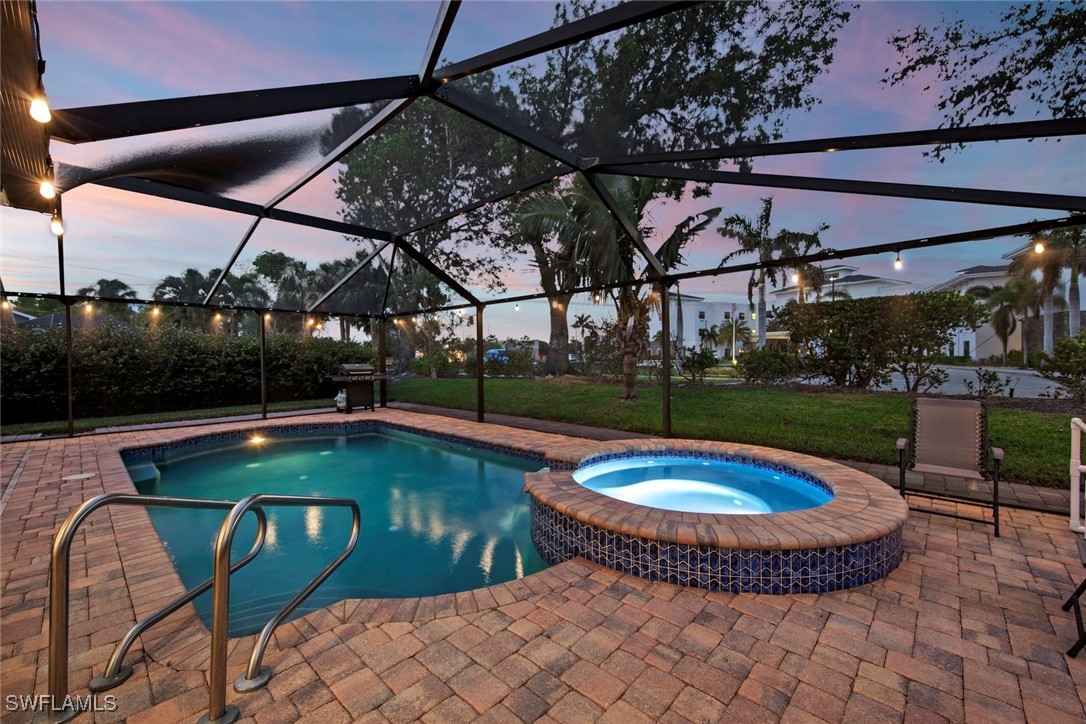
Active
$244,900
2
bds
|
2
ba
|
1,387
sqft
|
built
1996
15000 Bridgeway Ln, Fort Myers, FL 33919
$60
Cash flow
1.3%
Cash-on-Cash Return
6.4%
Cap rate
0.8%
Rent to Value Ratio
2,879 out of 3,043 properties for sale in Fort Myers, FL
Limited Results Shown
Create a free account, or log in to reveal all property listings and enjoy the complete experience.
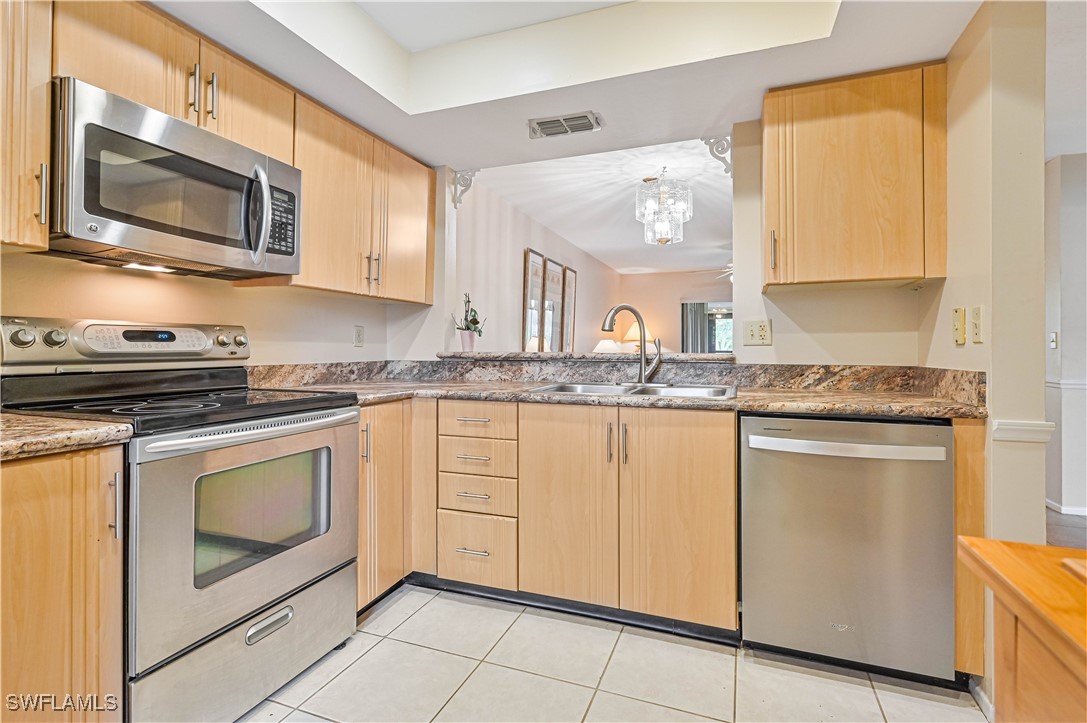
Active
$179,000
2
bds
|
2
ba
|
1,358
sqft
|
built
1981
137 Pinebrook Dr, Fort Myers, FL 33907
$-639
Cash flow
-18.6%
Cash-on-Cash Return
1.9%
Cap rate
1.0%
Rent to Value Ratio
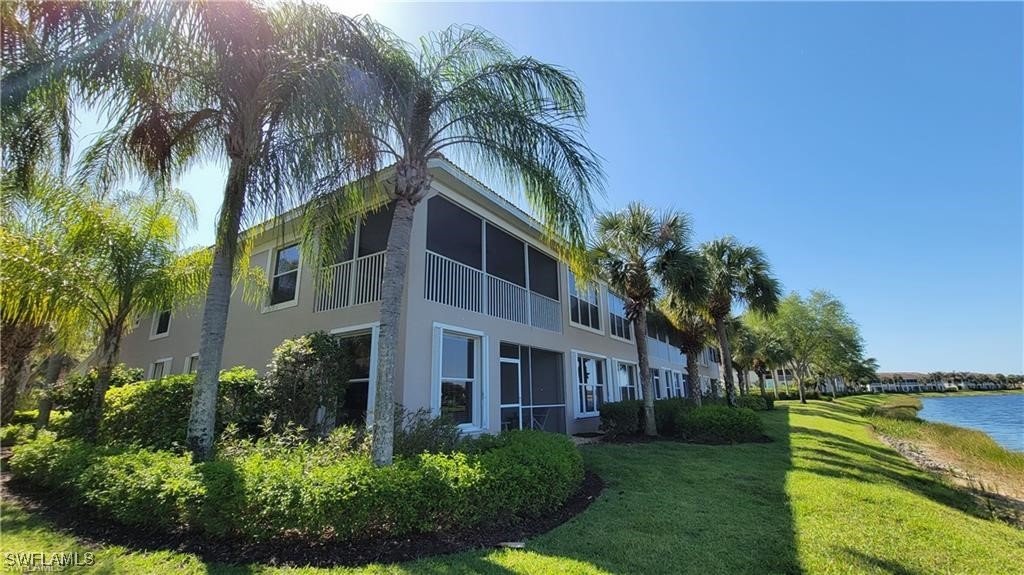
Active
$575,000
3
bds
|
3
ba
|
1,898
sqft
|
built
1995
15100 Ports Of Iona Dr, Fort Myers, FL 33908
$-1,178
Cash flow
-10.7%
Cash-on-Cash Return
3.7%
Cap rate
0.6%
Rent to Value Ratio
Active
$190,000
2
bds
|
2
ba
|
1,025
sqft
|
built
2005
9005 Colby Dr, Fort Myers, FL 33919
$-361
Cash flow
-9.9%
Cash-on-Cash Return
3.9%
Cap rate
0.9%
Rent to Value Ratio
Active
$550,000
3
bds
|
2
ba
|
2,149
sqft
|
built
2006
16181 Coco Hammock Way, Fort Myers, FL 33908
$-605
Cash flow
-5.7%
Cash-on-Cash Return
4.8%
Cap rate
0.8%
Rent to Value Ratio
Active
$999,000
4
bds
|
4
ba
|
3,439
sqft
|
built
2005
15120 Blackhawk Dr, Fort Myers, FL 33912
$-1,678
Cash flow
-8.8%
Cash-on-Cash Return
4.1%
Cap rate
0.6%
Rent to Value Ratio
Active under contract
$229,999
2
bds
|
2
ba
|
1,108
sqft
|
built
1988
16600 Ginger Ln, Fort Myers, FL 33908
$194
Cash flow
4.4%
Cash-on-Cash Return
7.2%
Cap rate
0.9%
Rent to Value Ratio
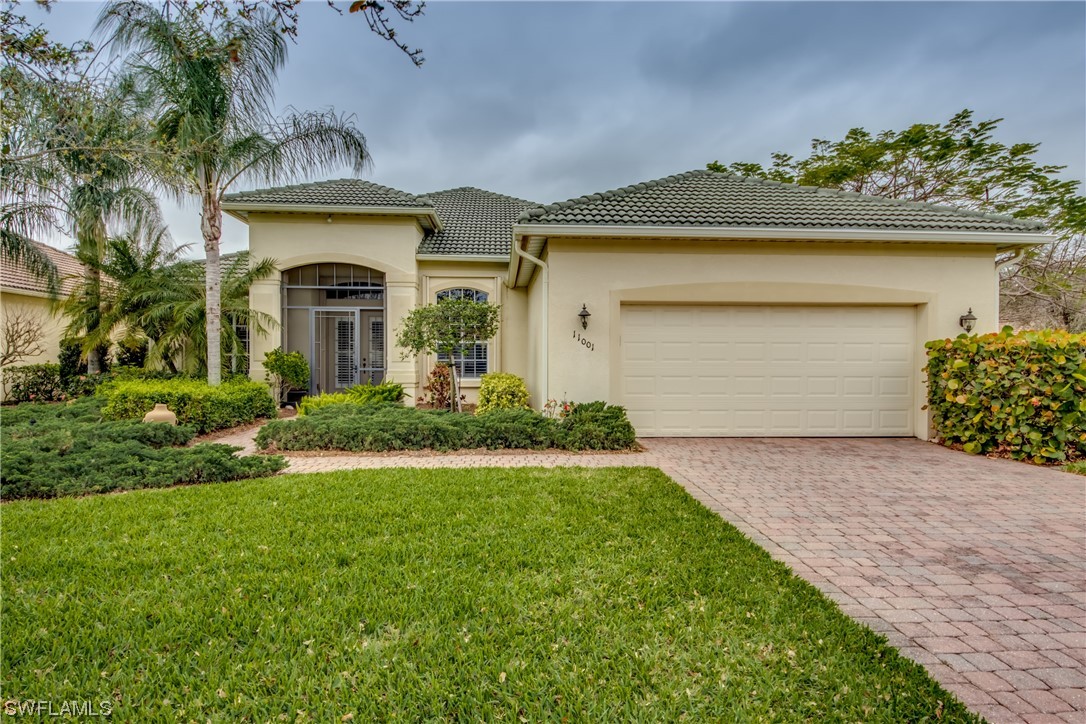
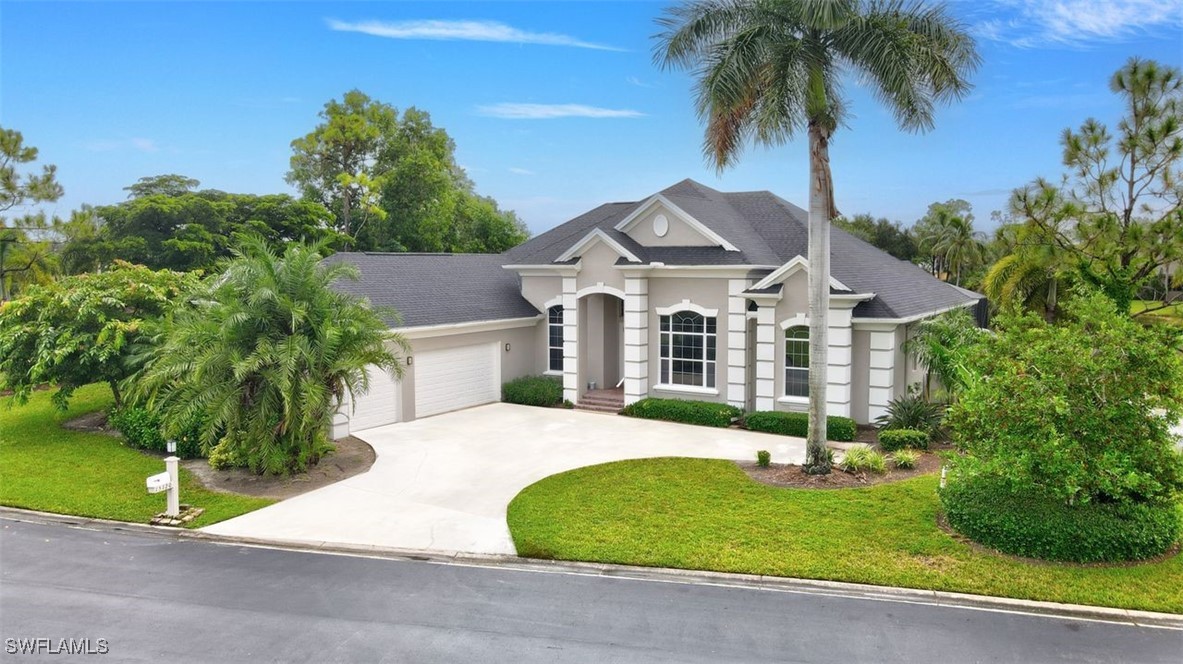
Closed
$362,500
2
bds
|
2
ba
|
2,136
sqft
|
built
2005
11001 Sea Tropic Ln, Fort Myers, FL 33908
$-173
Cash flow
-2.5%
Cash-on-Cash Return
5.6%
Cap rate
1.0%
Rent to Value Ratio
Active
$299,000
3
bds
|
2
ba
|
1,405
sqft
|
built
1964
2371 Lafayette St, Fort Myers, FL 33901
$-310
Cash flow
-5.4%
Cash-on-Cash Return
4.9%
Cap rate
0.7%
Rent to Value Ratio
Active
$629,000
4
bds
|
2
ba
|
1,943
sqft
|
built
2001
15817 Beachcomber Ave, Fort Myers, FL 33908
$-1,381
Cash flow
-11.5%
Cash-on-Cash Return
3.5%
Cap rate
0.6%
Rent to Value Ratio
Active
$208,900
2
bds
|
2
ba
|
825
sqft
|
built
1987
8366 Charter Club Cir, Fort Myers, FL 33919
$-2
Cash flow
0.0%
Cash-on-Cash Return
6.1%
Cap rate
0.9%
Rent to Value Ratio
Active
$289,000
2
bds
|
2
ba
|
1,382
sqft
|
built
2006
9648 Hemingway Ln, Fort Myers, FL 33913
$-564
Cash flow
-10.2%
Cash-on-Cash Return
3.8%
Cap rate
0.9%
Rent to Value Ratio
Active
$244,900
2
bds
|
2
ba
|
1,387
sqft
|
built
1996
15000 Bridgeway Ln, Fort Myers, FL 33919
$60
Cash flow
1.3%
Cash-on-Cash Return
6.4%
Cap rate
0.8%
Rent to Value Ratio
Active
$650,000
3
bds
|
3
ba
|
1,907
sqft
|
built
1961
905 Dean Way, Fort Myers, FL 33919
$-1,168
Cash flow
-9.4%
Cash-on-Cash Return
4.0%
Cap rate
0.6%
Rent to Value Ratio
Active
$704,999
4
bds
|
4
ba
|
2,736
sqft
|
built
2017
10860 Essex Square Blvd, Fort Myers, FL 33913
$-1,447
Cash flow
-10.7%
Cash-on-Cash Return
3.7%
Cap rate
0.6%
Rent to Value Ratio
Active
$2,400,000
6
bds
|
6
ba
|
4,928
sqft
|
built
1910
100 Fairview Ave, Fort Myers, FL 33905
$-9,096
Cash flow
-19.8%
Cash-on-Cash Return
1.6%
Cap rate
0.4%
Rent to Value Ratio
Active
$244,000
2
bds
|
2
ba
|
1,209
sqft
|
built
2004
10118 Colonial Country Club Blvd, Fort Myers, FL 33913
$-720
Cash flow
-15.4%
Cash-on-Cash Return
2.6%
Cap rate
0.9%
Rent to Value Ratio
Active
$489,000
3
bds
|
2
ba
|
2,016
sqft
|
built
1991
13460 Marquette Blvd, Fort Myers, FL 33905
$-813
Cash flow
-8.7%
Cash-on-Cash Return
4.2%
Cap rate
0.6%
Rent to Value Ratio
Active
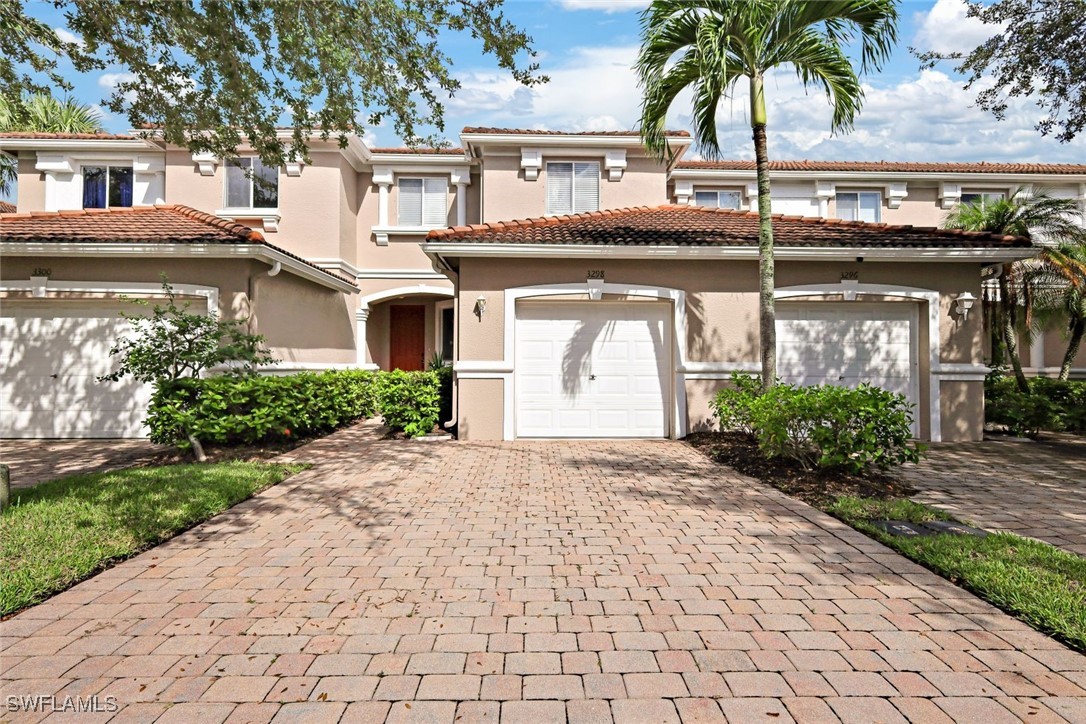
$289,900
3
bds
|
3
ba
|
1,711
sqft
|
built
2005
3298 Antica St, Fort Myers, FL 33905
$-595
Cash flow
-10.7%
Cash-on-Cash Return
3.7%
Cap rate
0.8%
Rent to Value Ratio
Active
$450,000
2
bds
|
2
ba
|
2,053
sqft
|
built
1983
5260 S Landings Dr, Fort Myers, FL 33919
$-2,782
Cash flow
-32.3%
Cash-on-Cash Return
-1.3%
Cap rate
0.7%
Rent to Value Ratio
Active
$399,999
4
bds
|
3
ba
|
2,606
sqft
|
built
2022
14701 Cantabria Dr, Fort Myers, FL 33905
$-463
Cash flow
-6.0%
Cash-on-Cash Return
4.8%
Cap rate
0.8%
Rent to Value Ratio
Active
$295,000
2
bds
|
2
ba
|
1,561
sqft
|
built
2001
15201 Royal Windsor Ln, Fort Myers, FL 33919
$-990
Cash flow
-17.5%
Cash-on-Cash Return
2.1%
Cap rate
0.7%
Rent to Value Ratio
Active
$245,900
3
bds
|
2
ba
|
1,169
sqft
|
built
1990
5885 Trailwinds Dr, Fort Myers, FL 33907
$-854
Cash flow
-18.1%
Cash-on-Cash Return
2.0%
Cap rate
0.8%
Rent to Value Ratio
Active
$326,000
3
bds
|
2
ba
|
1,499
sqft
|
built
1996
16421 Millstone Cir, Fort Myers, FL 33908
$-957
Cash flow
-15.3%
Cash-on-Cash Return
2.6%
Cap rate
0.8%
Rent to Value Ratio
Active
$195,000
2
bds
|
2
ba
|
1,093
sqft
|
built
1986
17452 Woodland Trce, Fort Myers, FL 33908
$-263
Cash flow
-7.0%
Cash-on-Cash Return
4.5%
Cap rate
0.9%
Rent to Value Ratio
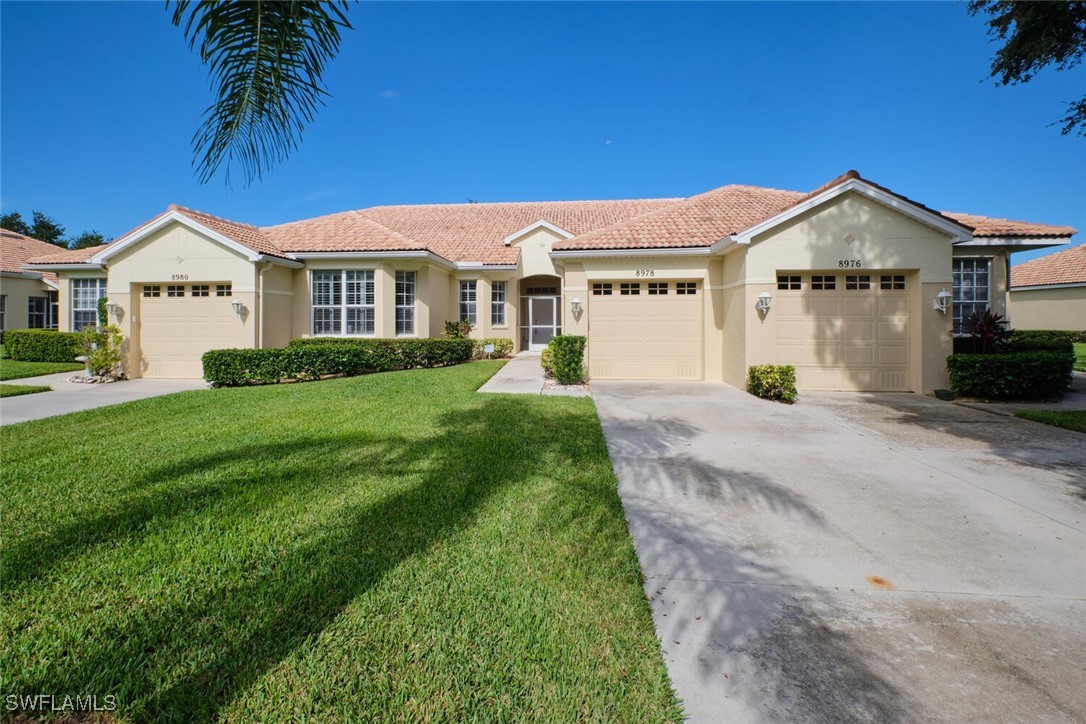
Active
$389,900
3
bds
|
2
ba
|
1,575
sqft
|
built
1997
8978 Bristol Bnd, Fort Myers, FL 33908
$-1,038
Cash flow
-13.9%
Cash-on-Cash Return
3.0%
Cap rate
0.7%
Rent to Value Ratio
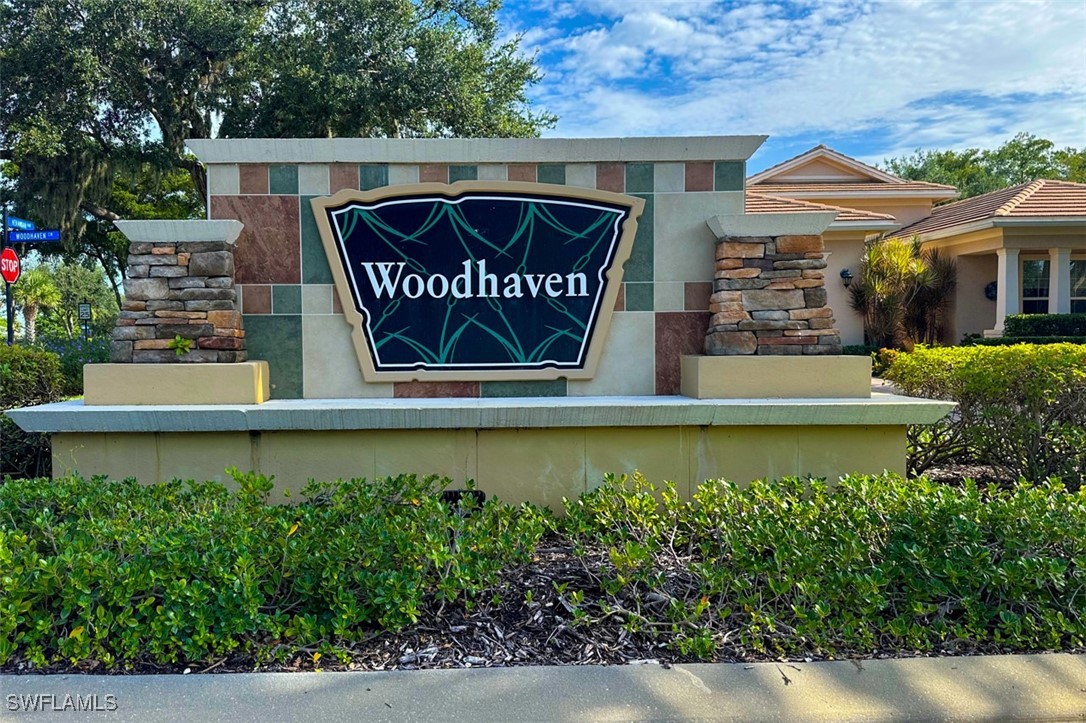
Active
$829,900
3
bds
|
3
ba
|
2,385
sqft
|
built
2016
13840 Woodhaven Cir, Fort Myers, FL 33905
$-1,858
Cash flow
-11.7%
Cash-on-Cash Return
3.5%
Cap rate
0.6%
Rent to Value Ratio
Active
$545,000
3
bds
|
2
ba
|
1,655
sqft
|
built
1953
1316 Sunbury Dr, Fort Myers, FL 33901
$-846
Cash flow
-8.1%
Cash-on-Cash Return
4.3%
Cap rate
0.7%
Rent to Value Ratio
Active
$304,900
2
bds
|
2
ba
|
1,280
sqft
|
built
1999
8658 Patty Berg Ct, Fort Myers, FL 33919
$-844
Cash flow
-14.4%
Cash-on-Cash Return
2.8%
Cap rate
0.7%
Rent to Value Ratio
Active
$179,000
2
bds
|
2
ba
|
1,137
sqft
|
built
1974
55 Laconia Ct, Fort Myers, FL 33919
$-322
Cash flow
-9.4%
Cash-on-Cash Return
4.0%
Cap rate
1.0%
Rent to Value Ratio
Active
$325,000
1
bds
|
1
ba
|
0
sqft
|
built
1972
1643 Maple Dr, Fort Myers, FL 33907
$-932
Cash flow
-15.0%
Cash-on-Cash Return
2.7%
Cap rate
0.4%
Rent to Value Ratio
Active
$529,900
3
bds
|
3
ba
|
1,857
sqft
|
built
2003
14819 Laguna Dr, Fort Myers, FL 33908
$-831
Cash flow
-8.2%
Cash-on-Cash Return
4.3%
Cap rate
0.7%
Rent to Value Ratio
Active
$325,000
3
bds
|
2
ba
|
1,386
sqft
|
built
1957
1443 Alhambra Dr, Fort Myers, FL 33901
$-168
Cash flow
-2.7%
Cash-on-Cash Return
5.5%
Cap rate
0.7%
Rent to Value Ratio
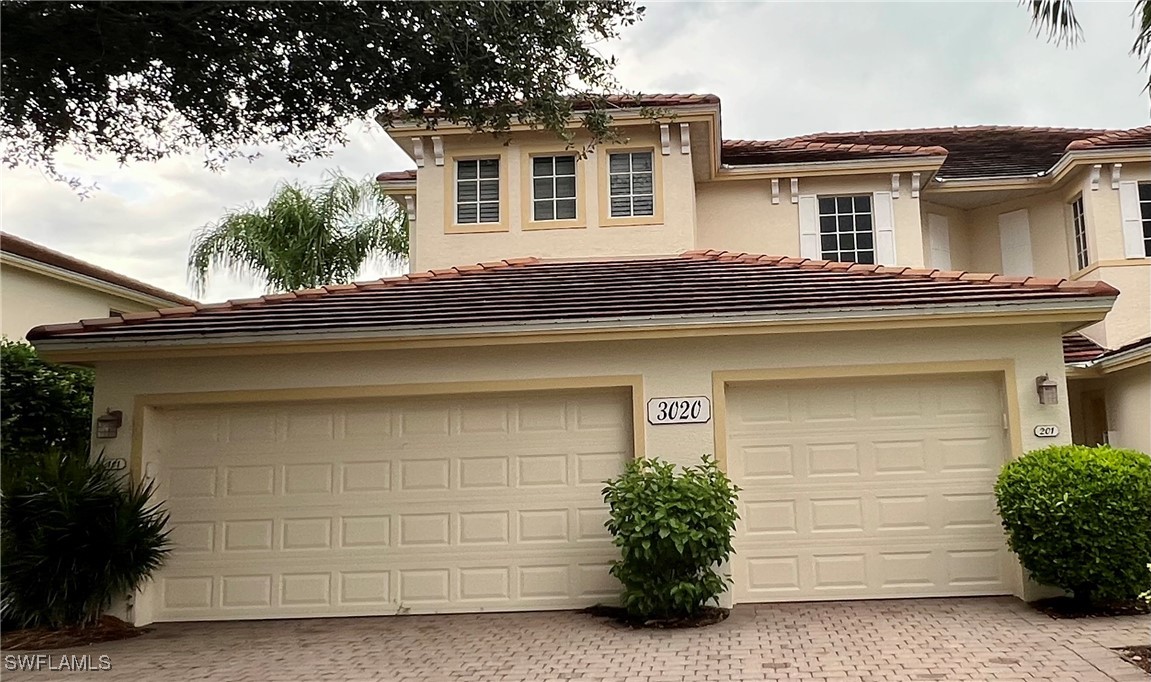
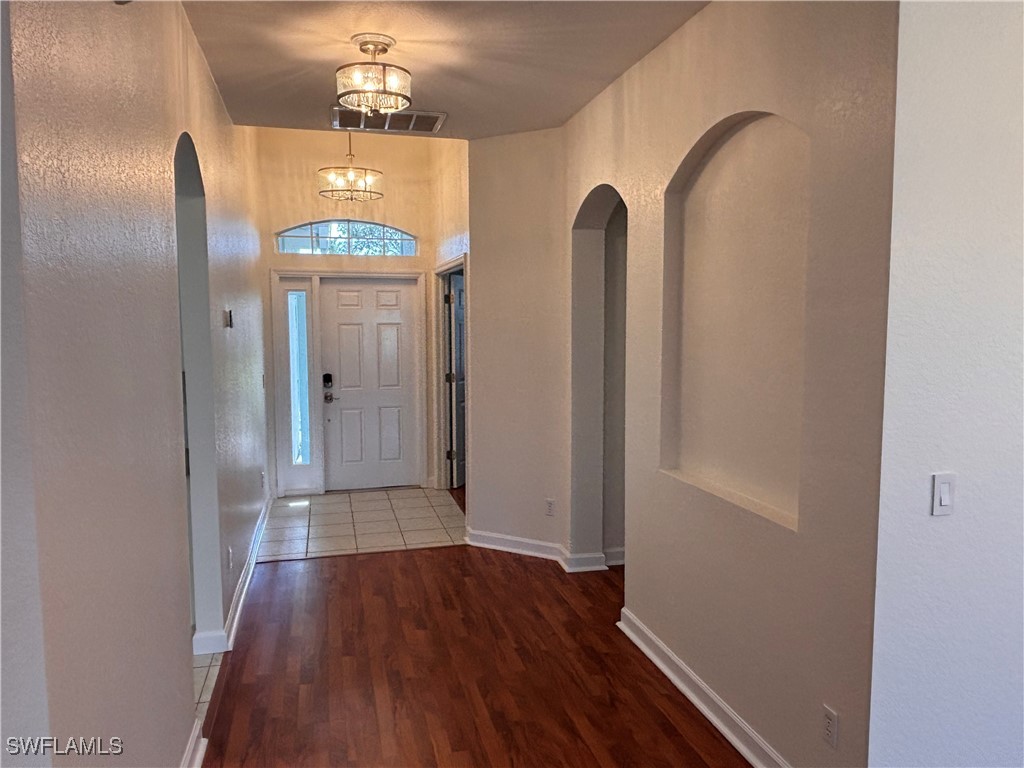
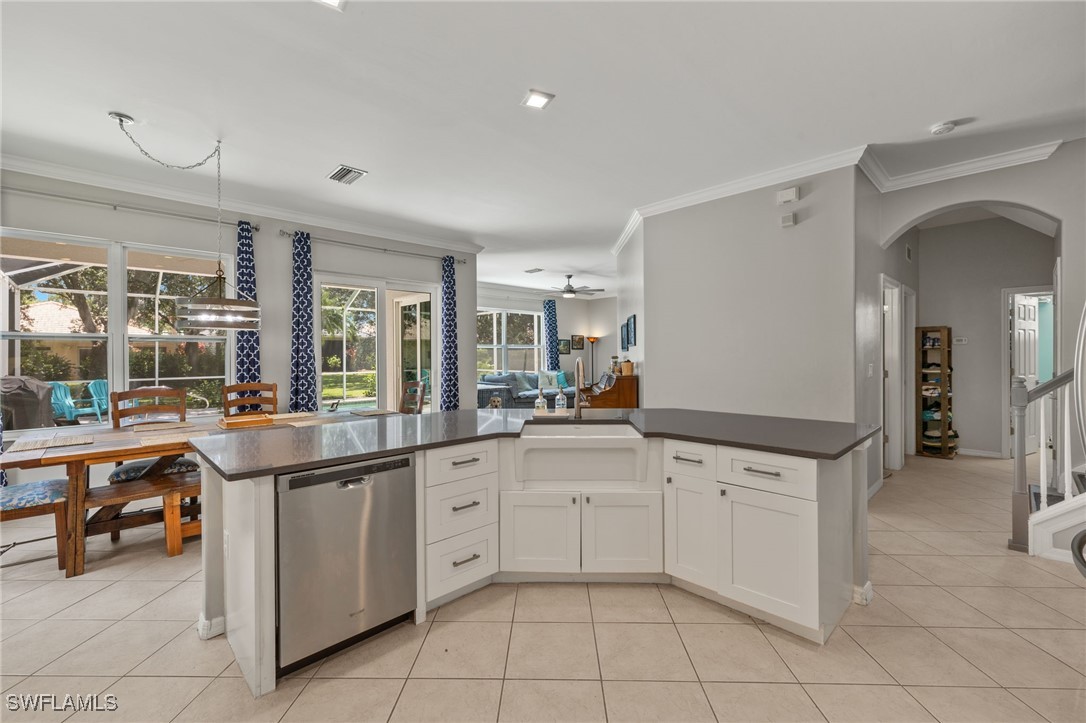
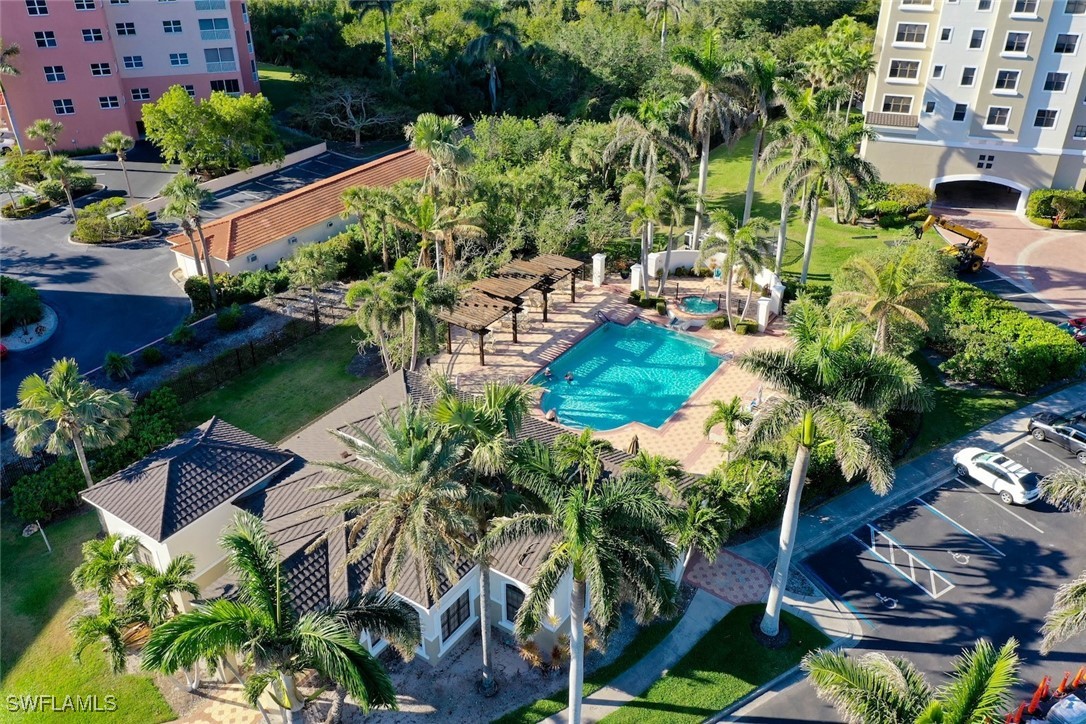
Active
$279,900
3
bds
|
2
ba
|
1,690
sqft
|
built
2004
3020 Meandering Way, Fort Myers, FL 33905
$-359
Cash flow
-6.7%
Cash-on-Cash Return
4.6%
Cap rate
0.9%
Rent to Value Ratio
Active
$475,000
4
bds
|
3
ba
|
2,496
sqft
|
built
2000
7912 Summer Lake Ct, Fort Myers, FL 33907
$-738
Cash flow
-8.1%
Cash-on-Cash Return
4.3%
Cap rate
0.7%
Rent to Value Ratio
Active
$525,000
5
bds
|
3
ba
|
2,924
sqft
|
built
2005
12569 Stone Tower Loop, Fort Myers, FL 33913
$-624
Cash flow
-6.2%
Cash-on-Cash Return
4.7%
Cap rate
0.7%
Rent to Value Ratio
Active
$940,000
3
bds
|
3
ba
|
2,526
sqft
|
built
2002
11620 Court Of Palms, Fort Myers, FL 33908
$-1,017
Cash flow
-5.6%
Cash-on-Cash Return
4.8%
Cap rate
0.7%
Rent to Value Ratio
Active
$225,000
2
bds
|
2
ba
|
1,200
sqft
|
built
2006
9661 Hemingway Ln, Fort Myers, FL 33913
$-798
Cash flow
-18.5%
Cash-on-Cash Return
1.9%
Cap rate
0.9%
Rent to Value Ratio
Active
$599,900
3
bds
|
2
ba
|
1,552
sqft
|
built
1959
1035 Wyomi Dr, Fort Myers, FL 33919
$-1,142
Cash flow
-9.9%
Cash-on-Cash Return
3.9%
Cap rate
0.5%
Rent to Value Ratio
Active
$839,900
3
bds
|
2
ba
|
2,802
sqft
|
built
2005
9261 Triana Ter, Fort Myers, FL 33912
$-1,174
Cash flow
-7.3%
Cash-on-Cash Return
4.5%
Cap rate
0.7%
Rent to Value Ratio
Active
$749,000
2
bds
|
3
ba
|
2,258
sqft
|
built
2006
2104 W 1st St, Fort Myers, FL 33901
$-2,209
Cash flow
-15.4%
Cash-on-Cash Return
2.6%
Cap rate
0.7%
Rent to Value Ratio