Fort Myers, FL Investment Properties for Sale
Browse homes for sale and investment properties in Fort Myers, FL. Refine your search by price, property type, or more.
Best cash flowing properties in Fort Myers, FL
Active
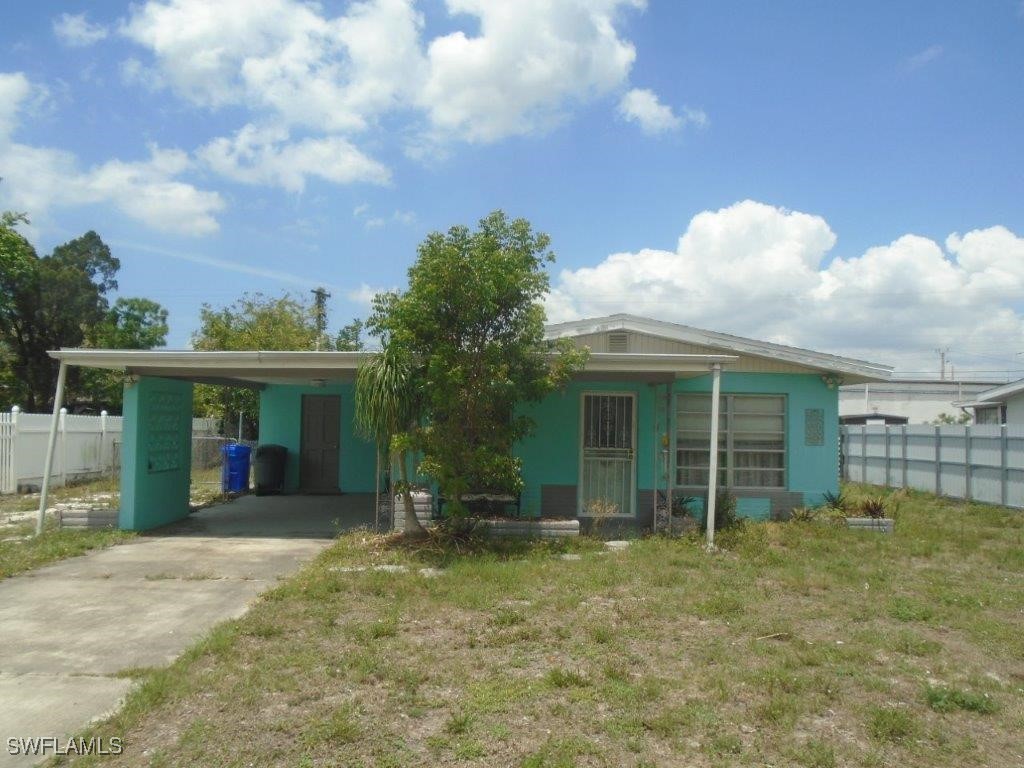
$179,900
2
bds
|
1
ba
|
900
sqft
|
built
1960
2956 Powell St, Fort Myers, FL 33901
$59
Cash flow
1.7%
Cash-on-Cash Return
6.5%
Cap rate
0.8%
Rent to Value Ratio
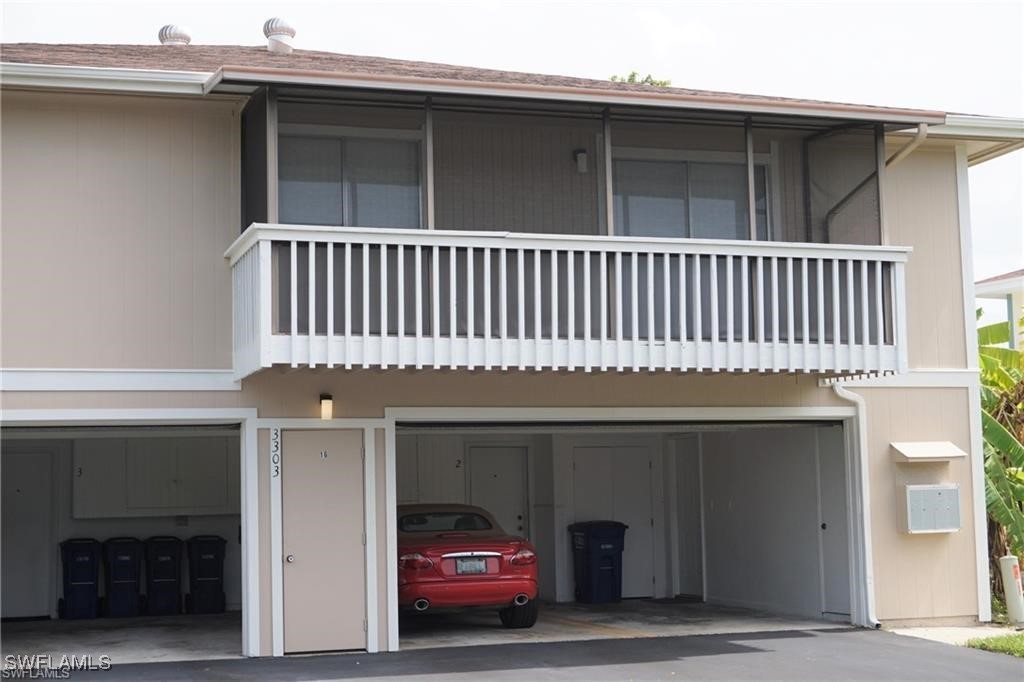
Active
$149,999
2
bds
|
1
ba
|
820
sqft
|
built
1975
3303 Royal Canadian Trce, Fort Myers, FL 33907
$-121
Cash flow
-4.2%
Cash-on-Cash Return
5.2%
Cap rate
1.0%
Rent to Value Ratio
2,909 out of 3,073 properties for sale in Fort Myers, FL
Limited Results Shown
Create a free account, or log in to reveal all property listings and enjoy the complete experience.
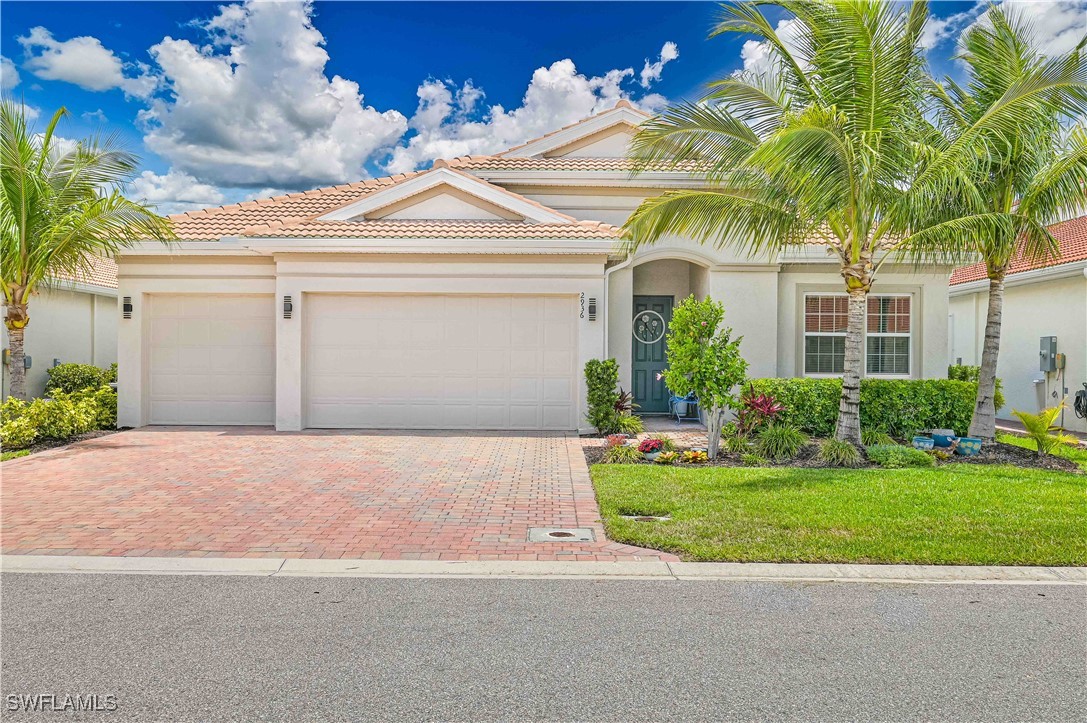
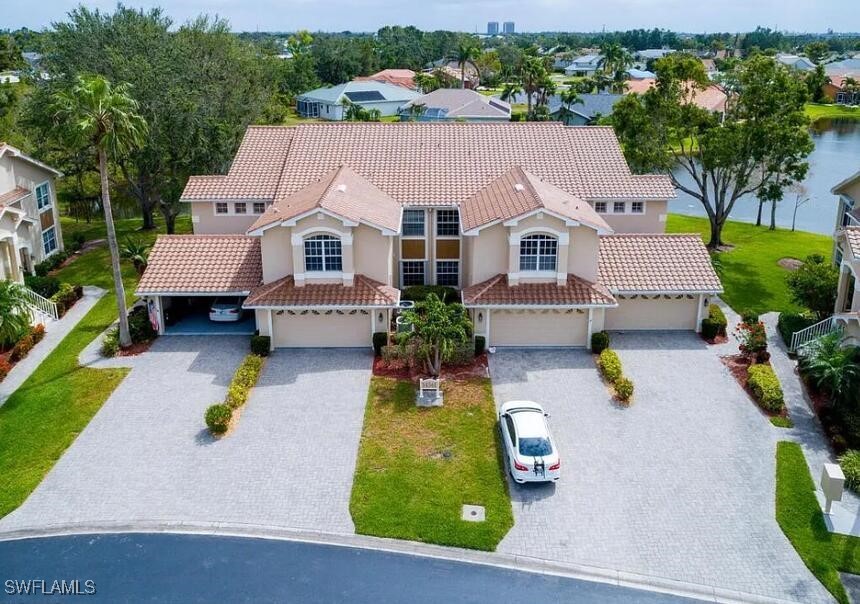
Active
$559,000
3
bds
|
5
ba
|
2,605
sqft
|
built
2021
2936 Royal Gardens Ave, Fort Myers, FL 33916
$-1,586
Cash flow
-14.8%
Cash-on-Cash Return
2.7%
Cap rate
0.6%
Rent to Value Ratio
Active
$149,999
2
bds
|
1
ba
|
820
sqft
|
built
1975
3303 Royal Canadian Trce, Fort Myers, FL 33907
$-121
Cash flow
-4.2%
Cash-on-Cash Return
5.2%
Cap rate
1.0%
Rent to Value Ratio
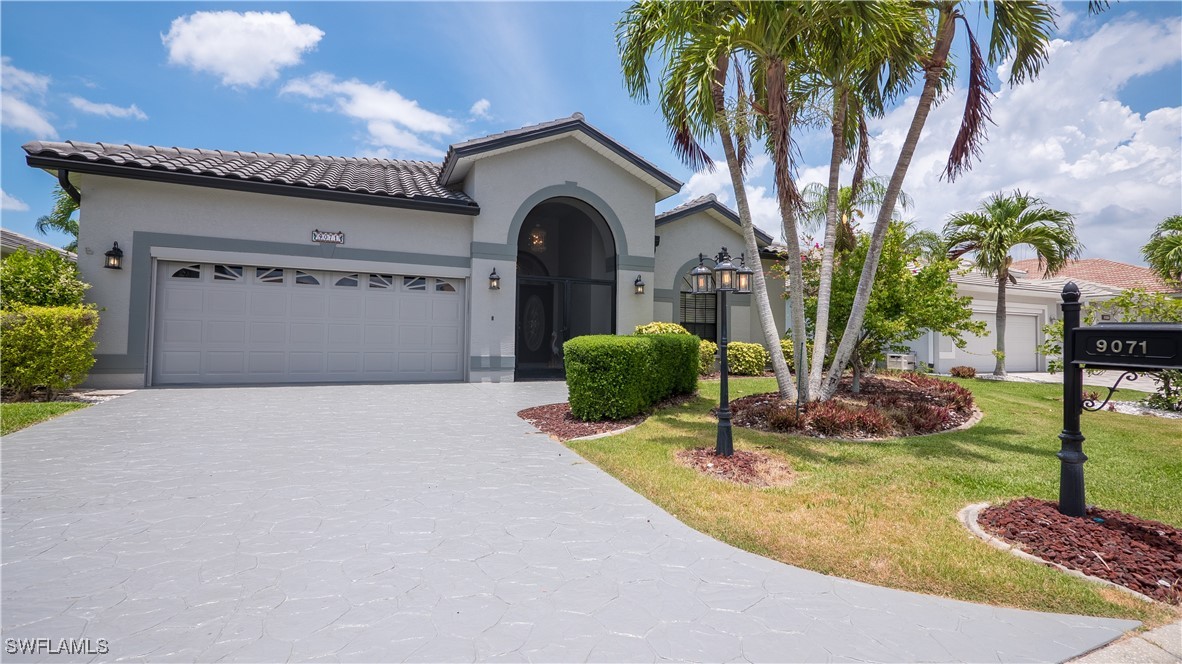
Active
$589,000
3
bds
|
3
ba
|
2,169
sqft
|
built
1997
9071 Old Hickory Cir, Fort Myers, FL 33912
$-1,560
Cash flow
-13.8%
Cash-on-Cash Return
3.0%
Cap rate
0.7%
Rent to Value Ratio
Active
$1,999,000
5
bds
|
4
ba
|
4,745
sqft
|
built
2008
18251 Parkridge Ct, Fort Myers, FL 33908
$-7,219
Cash flow
-18.8%
Cash-on-Cash Return
1.8%
Cap rate
0.4%
Rent to Value Ratio
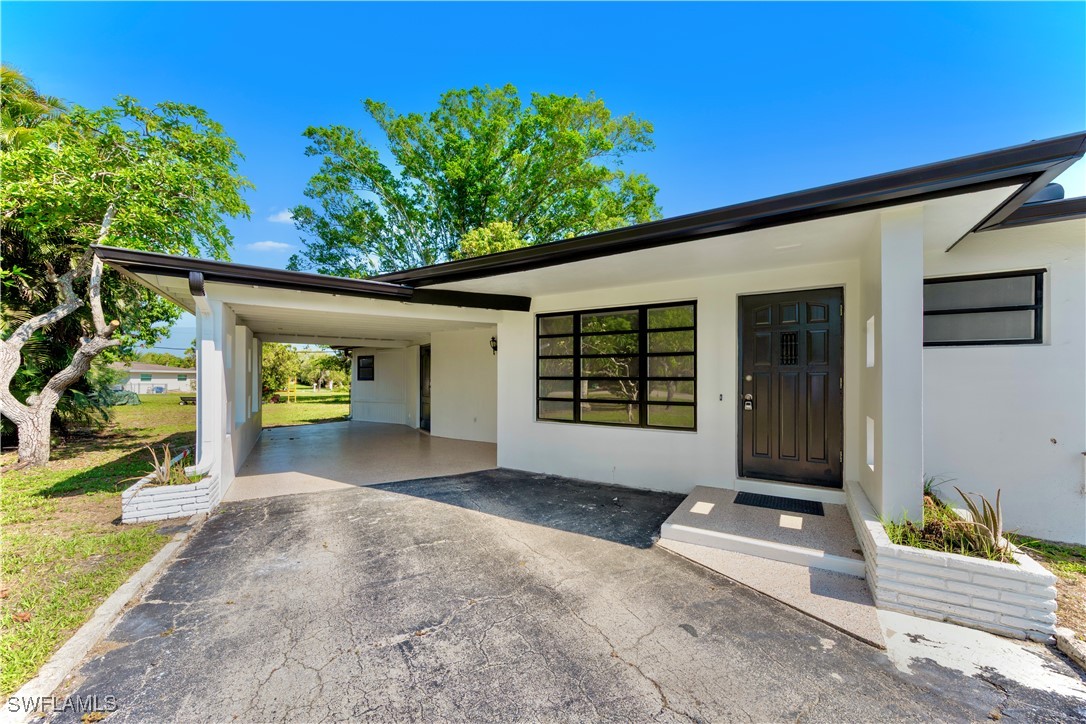
Active
$300,000
4
bds
|
2
ba
|
1,388
sqft
|
built
1958
4101 Rainbow Dr, Fort Myers, FL 33916
$-217
Cash flow
-3.8%
Cash-on-Cash Return
5.3%
Cap rate
0.7%
Rent to Value Ratio
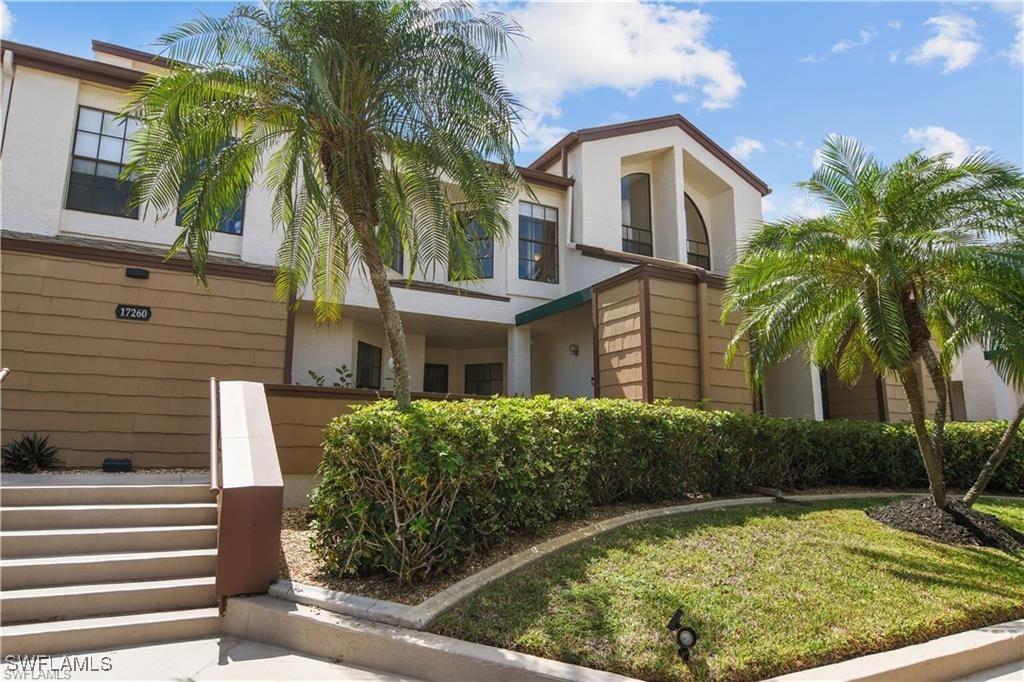
Active
$225,000
2
bds
|
2
ba
|
1,352
sqft
|
built
1985
17260 Eagle Trce, Fort Myers, FL 33908
$-269
Cash flow
-6.2%
Cash-on-Cash Return
4.7%
Cap rate
0.9%
Rent to Value Ratio
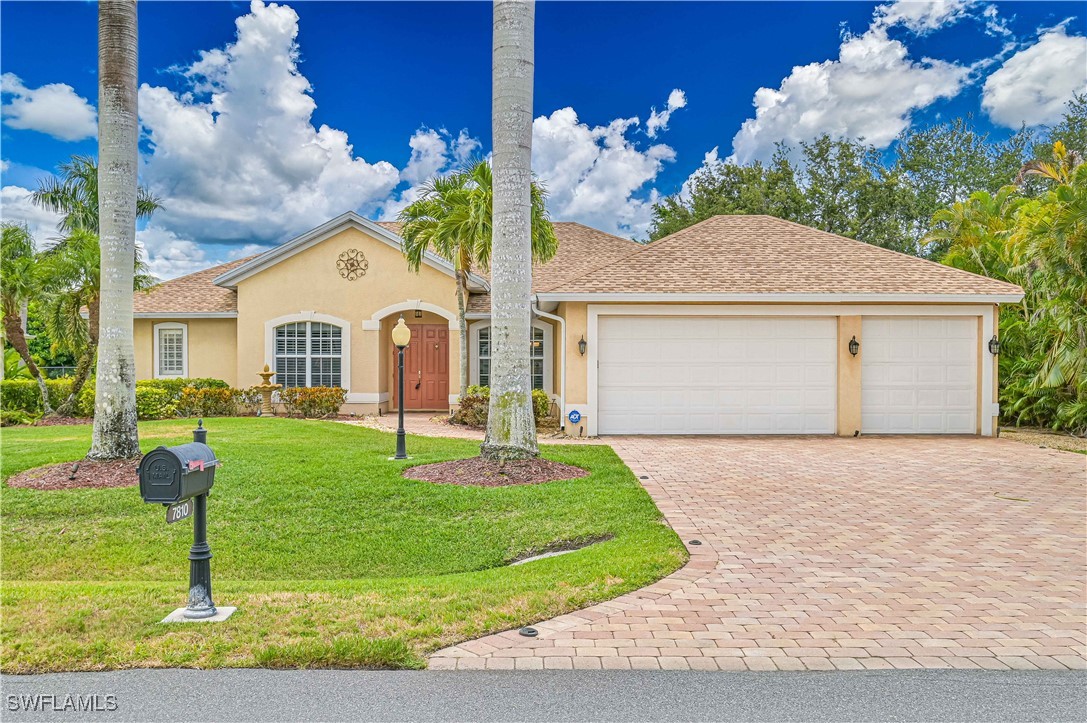
Active
$675,000
3
bds
|
2
ba
|
2,450
sqft
|
built
2004
7810 Twin Eagle Ln, Fort Myers, FL 33912
$-1,388
Cash flow
-10.7%
Cash-on-Cash Return
3.7%
Cap rate
0.6%
Rent to Value Ratio
Active
$364,000
3
bds
|
3
ba
|
2,033
sqft
|
built
2016
4096 Wilmont Pl, Fort Myers, FL 33916
$-729
Cash flow
-10.4%
Cash-on-Cash Return
3.7%
Cap rate
0.7%
Rent to Value Ratio
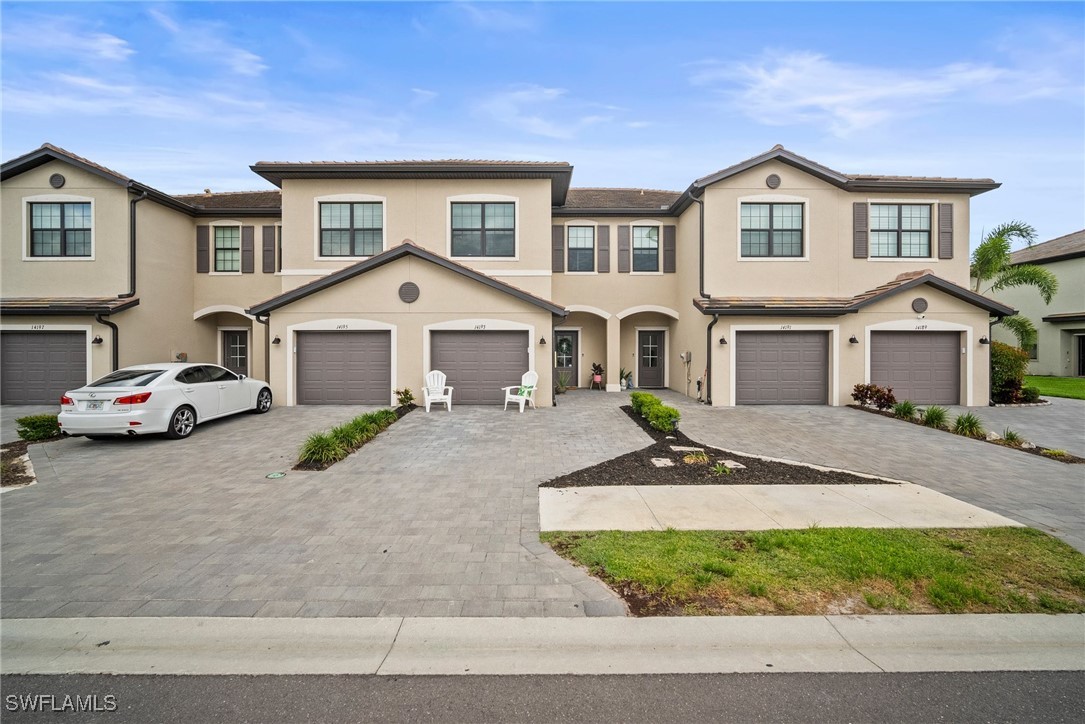
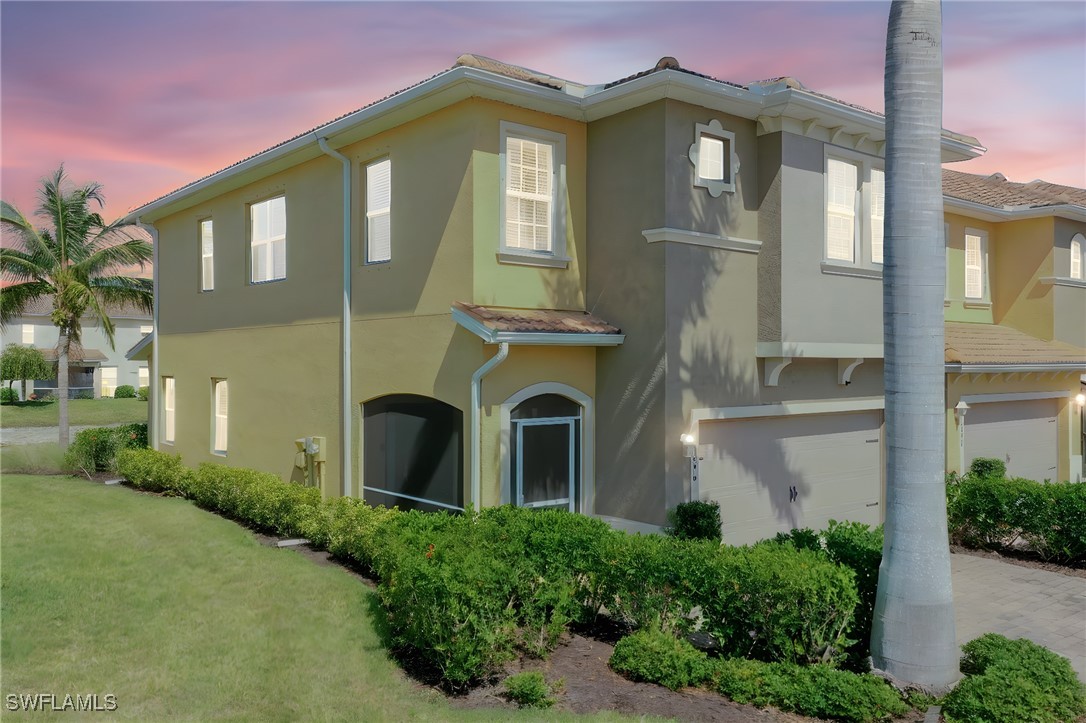
Active
$299,900
3
bds
|
3
ba
|
1,942
sqft
|
built
2022
14193 Pine Lodge Ln, Fort Myers, FL 33913
$-718
Cash flow
-12.5%
Cash-on-Cash Return
3.3%
Cap rate
0.7%
Rent to Value Ratio
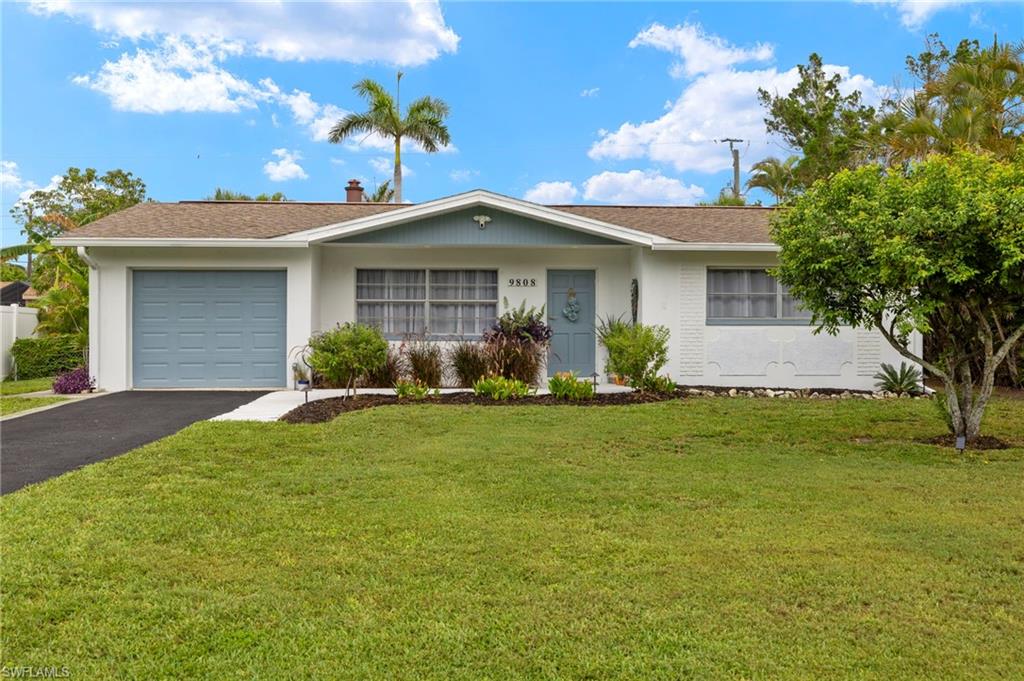
Active under contract
$259,000
2
bds
|
1
ba
|
860
sqft
|
built
1971
9808 Almetta Ave, Fort Myers, FL 33919
$-389
Cash flow
-7.8%
Cash-on-Cash Return
4.3%
Cap rate
0.7%
Rent to Value Ratio
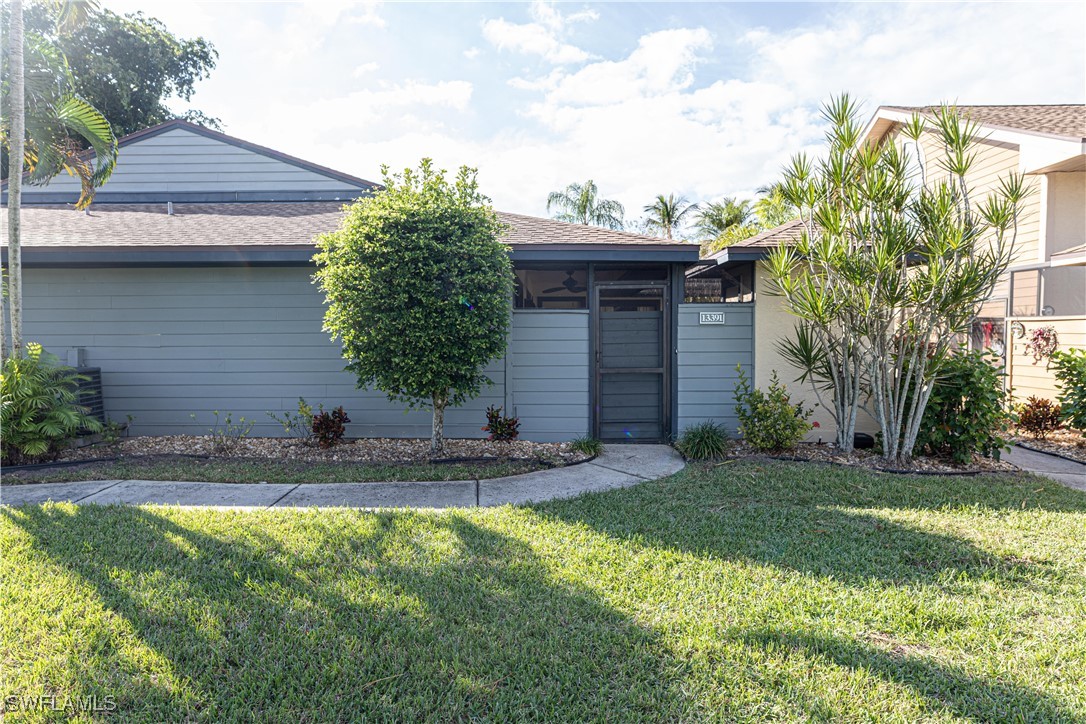
Active
$229,900
2
bds
|
2
ba
|
878
sqft
|
built
1987
13391 Broadhurst Loop, Fort Myers, FL 33919
$-766
Cash flow
-17.4%
Cash-on-Cash Return
2.2%
Cap rate
0.7%
Rent to Value Ratio
Active
$450,000
4
bds
|
2
ba
|
2,132
sqft
|
built
2000
14561 Glen Cove Dr, Fort Myers, FL 33919
$-1,392
Cash flow
-16.1%
Cash-on-Cash Return
2.4%
Cap rate
0.6%
Rent to Value Ratio
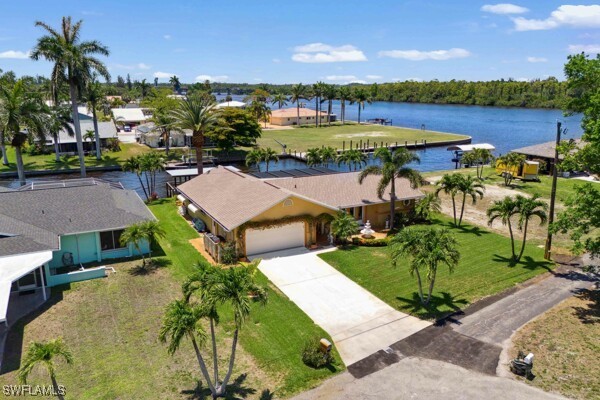
Active
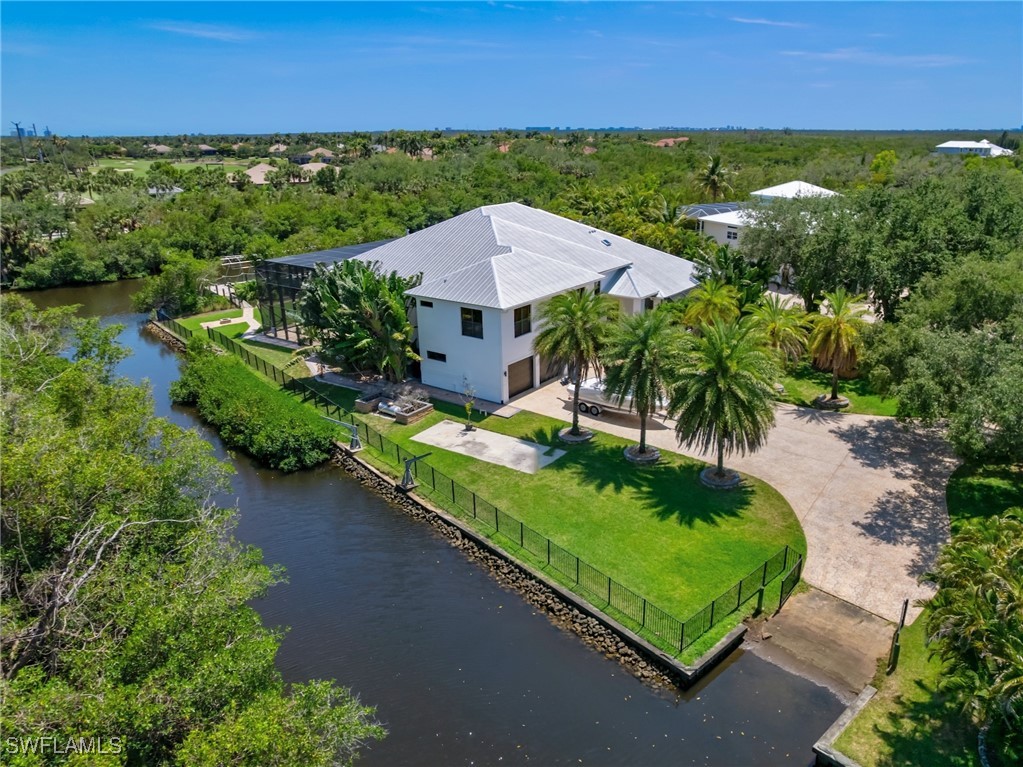
$599,000
3
bds
|
2
ba
|
1,554
sqft
|
built
1984
2197 River Rd, Fort Myers, FL 33905
$-1,309
Cash flow
-11.4%
Cash-on-Cash Return
3.5%
Cap rate
0.5%
Rent to Value Ratio
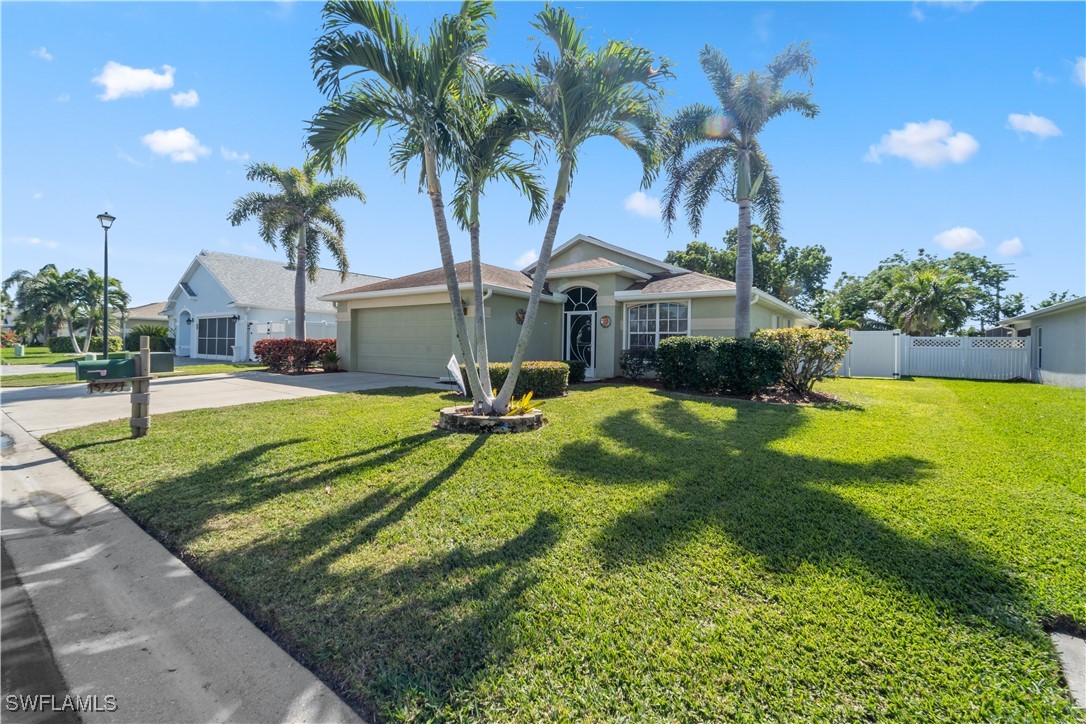
Active
$430,000
3
bds
|
2
ba
|
1,468
sqft
|
built
2001
15721 Beachcomber Ave, Fort Myers, FL 33908
$-620
Cash flow
-7.5%
Cash-on-Cash Return
4.4%
Cap rate
0.7%
Rent to Value Ratio
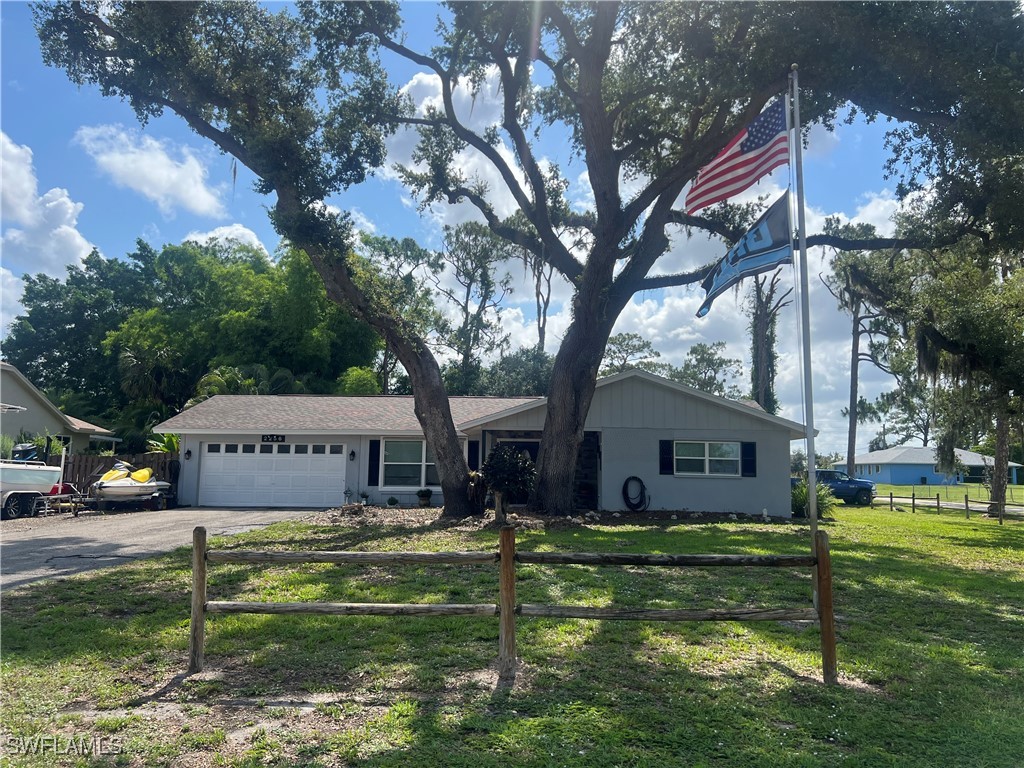
Active
$405,000
3
bds
|
2
ba
|
1,548
sqft
|
built
1973
2256 River Oak Ln, Fort Myers, FL 33905
$-718
Cash flow
-9.2%
Cash-on-Cash Return
4.0%
Cap rate
0.5%
Rent to Value Ratio
Active
$264,900
2
bds
|
2
ba
|
1,232
sqft
|
built
1964
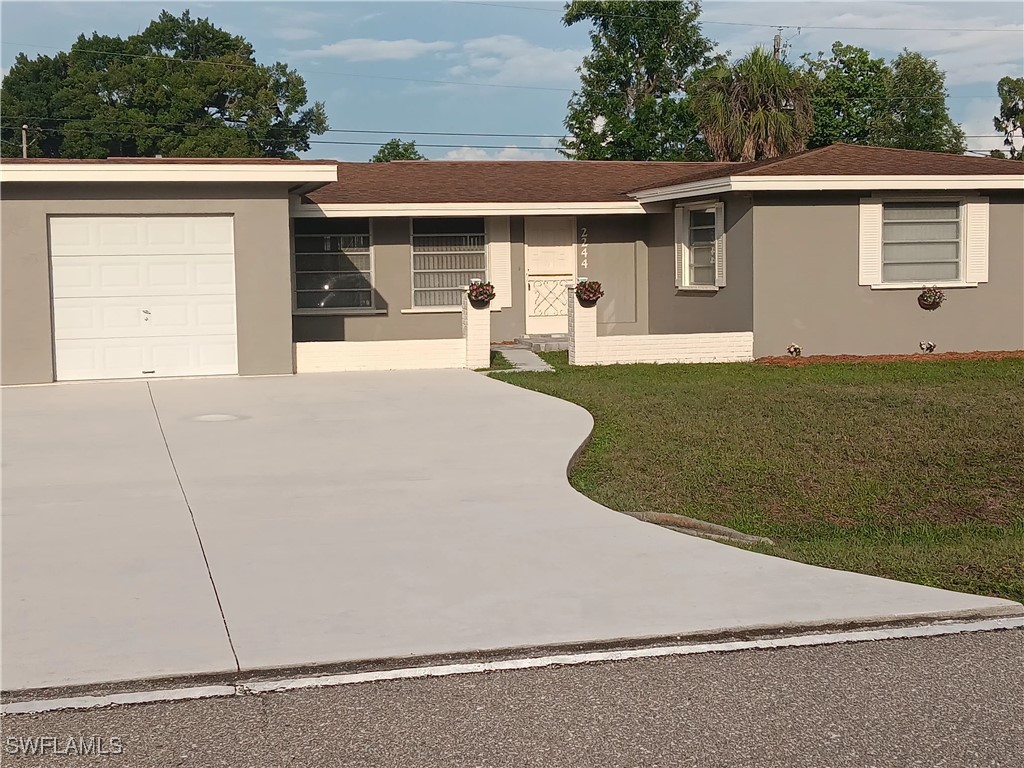
2244 Parkview Dr, Fort Myers, FL 33905
$-334
Cash flow
-6.6%
Cash-on-Cash Return
4.6%
Cap rate
0.7%
Rent to Value Ratio
Active
$295,000
3
bds
|
3
ba
|
1,662
sqft
|
built
2015
9453 Montebello Way, Fort Myers, FL 33908
$-827
Cash flow
-14.6%
Cash-on-Cash Return
2.8%
Cap rate
0.8%
Rent to Value Ratio
Active
$225,000
2
bds
|
2
ba
|
1,058
sqft
|
built
1991
17156 Ravens Roost, Fort Myers, FL 33908
$-750
Cash flow
-17.4%
Cash-on-Cash Return
2.1%
Cap rate
0.8%
Rent to Value Ratio
Active
$1,750,000
3
bds
|
4
ba
|
3,340
sqft
|
built
2006
14270 Royal Harbour Ct, Fort Myers, FL 33908
$-4,816
Cash flow
-14.4%
Cash-on-Cash Return
2.8%
Cap rate
0.5%
Rent to Value Ratio
Active
$499,000
4
bds
|
3
ba
|
2,462
sqft
|
built
1988
7539 Twin Eagle Ln, Fort Myers, FL 33912
$-357
Cash flow
-3.7%
Cash-on-Cash Return
5.3%
Cap rate
0.7%
Rent to Value Ratio
Active
$659,900
4
bds
|
3
ba
|
2,701
sqft
|
built
1979
18028 Phlox Dr, Fort Myers, FL 33967
$-1,910
Cash flow
-15.1%
Cash-on-Cash Return
2.7%
Cap rate
0.4%
Rent to Value Ratio
Active
$720,000
3
bds
|
3
ba
|
1,834
sqft
|
built
1967
5631 Shaddelee Ln W, Fort Myers, FL 33919
$-1,812
Cash flow
-13.1%
Cash-on-Cash Return
3.1%
Cap rate
0.4%
Rent to Value Ratio
Active
$290,000
2
bds
|
2
ba
|
1,631
sqft
|
built
2004
14769 Calusa Palms Dr, Fort Myers, FL 33919
$-795
Cash flow
-14.3%
Cash-on-Cash Return
2.9%
Cap rate
0.8%
Rent to Value Ratio
Active
$679,900
3
bds
|
2
ba
|
2,466
sqft
|
built
2013
10181 Belcrest Blvd, Fort Myers, FL 33913
$-2,253
Cash flow
-17.3%
Cash-on-Cash Return
2.2%
Cap rate
0.5%
Rent to Value Ratio
Active
$179,900
2
bds
|
1
ba
|
900
sqft
|
built
1960
2956 Powell St, Fort Myers, FL 33901
$59
Cash flow
1.7%
Cash-on-Cash Return
6.5%
Cap rate
0.8%
Rent to Value Ratio
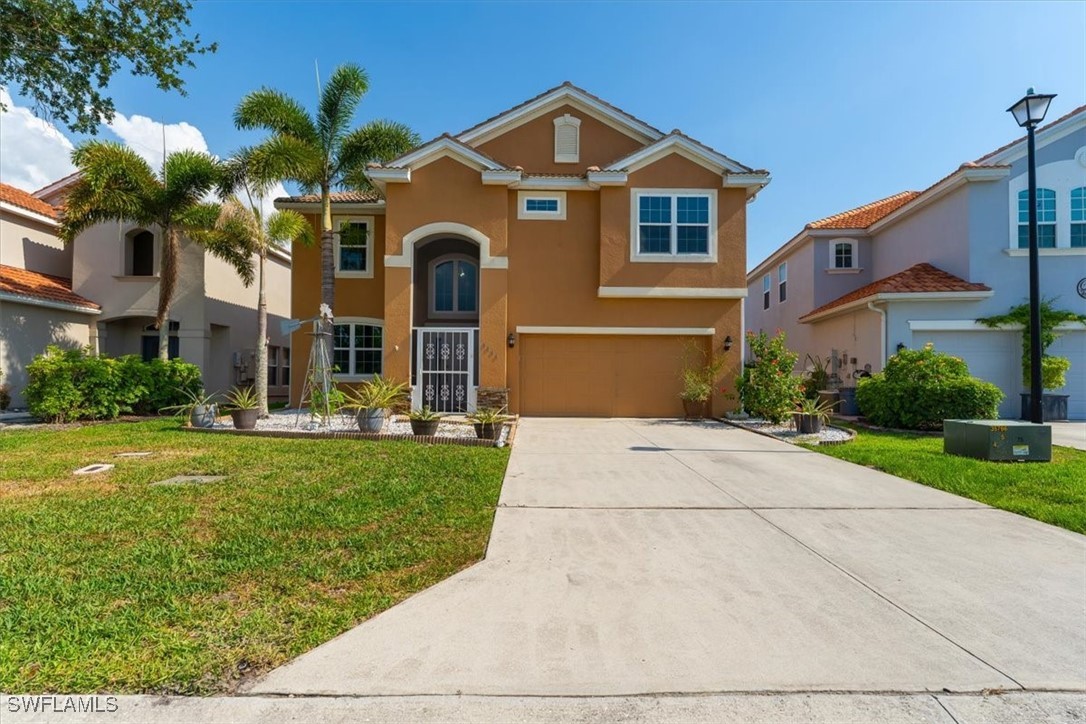
Active
$349,999
3
bds
|
2
ba
|
1,785
sqft
|
built
2001
879 Rue Labeau Cir, Fort Myers, FL 33913
$-738
Cash flow
-11.0%
Cash-on-Cash Return
3.6%
Cap rate
0.6%
Rent to Value Ratio
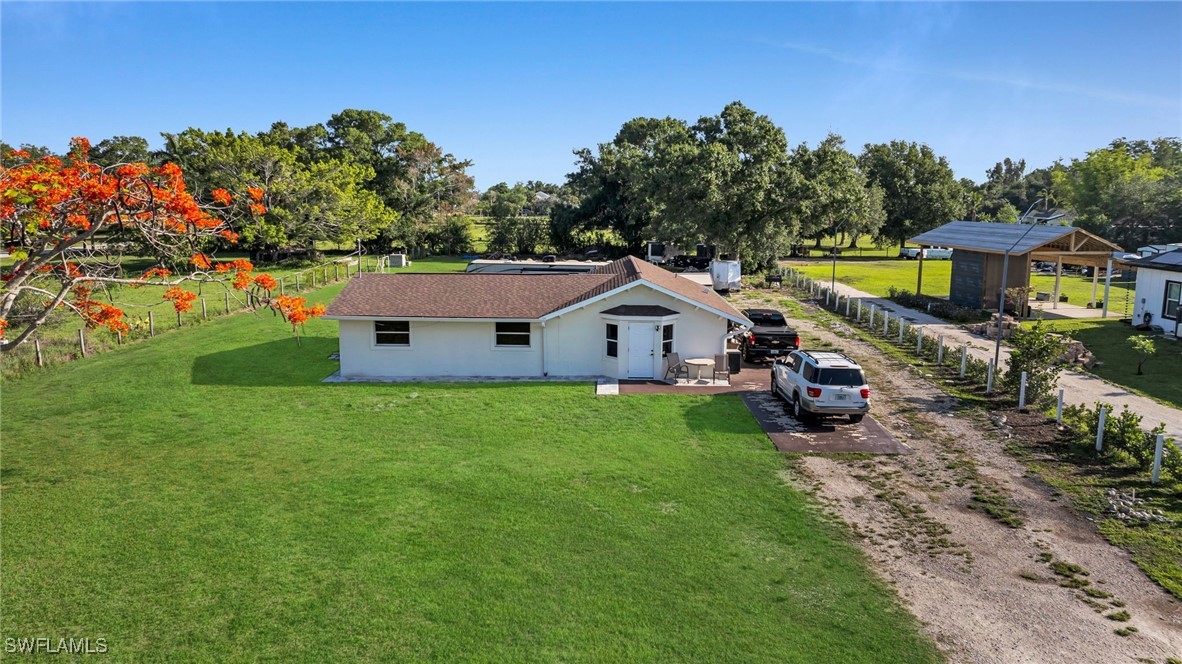
Active
$429,900
3
bds
|
2
ba
|
1,589
sqft
|
built
1979
2001 Bahama Ave, Fort Myers, FL 33905
$-366
Cash flow
-4.4%
Cash-on-Cash Return
5.1%
Cap rate
0.7%
Rent to Value Ratio
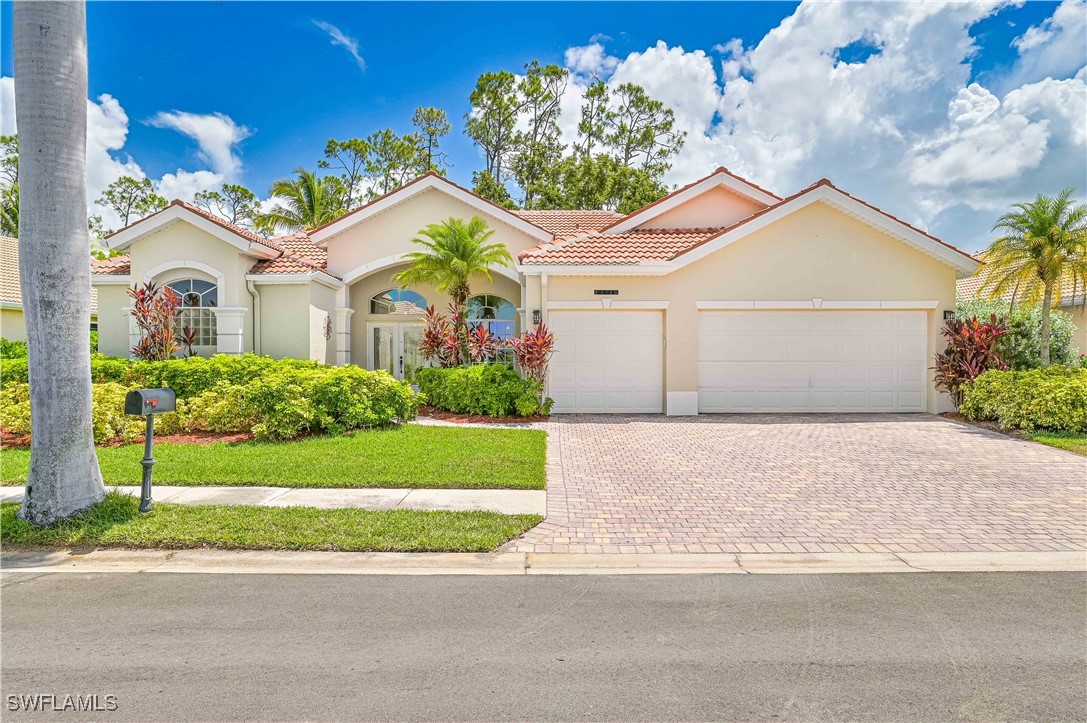
Active
$679,000
3
bds
|
2
ba
|
2,340
sqft
|
built
1986
12441 Mc Gregor Woods Cir, Fort Myers, FL 33908
$-1,830
Cash flow
-14.1%
Cash-on-Cash Return
2.9%
Cap rate
0.5%
Rent to Value Ratio
Active
$459,900
3
bds
|
2
ba
|
1,854
sqft
|
built
1998
9230 Bayberry Bnd, Fort Myers, FL 33908
$-1,353
Cash flow
-15.3%
Cash-on-Cash Return
2.6%
Cap rate
0.7%
Rent to Value Ratio
Active
$799,900
3
bds
|
3
ba
|
2,672
sqft
|
built
1999
11640 Court Of Palms, Fort Myers, FL 33908
$-1,775
Cash flow
-11.6%
Cash-on-Cash Return
3.5%
Cap rate
0.5%
Rent to Value Ratio
Active
$534,900
3
bds
|
2
ba
|
1,673
sqft
|
built
1987
14938 Randolph Dr, Fort Myers, FL 33905
$-1,177
Cash flow
-11.5%
Cash-on-Cash Return
3.5%
Cap rate
0.5%
Rent to Value Ratio
Active
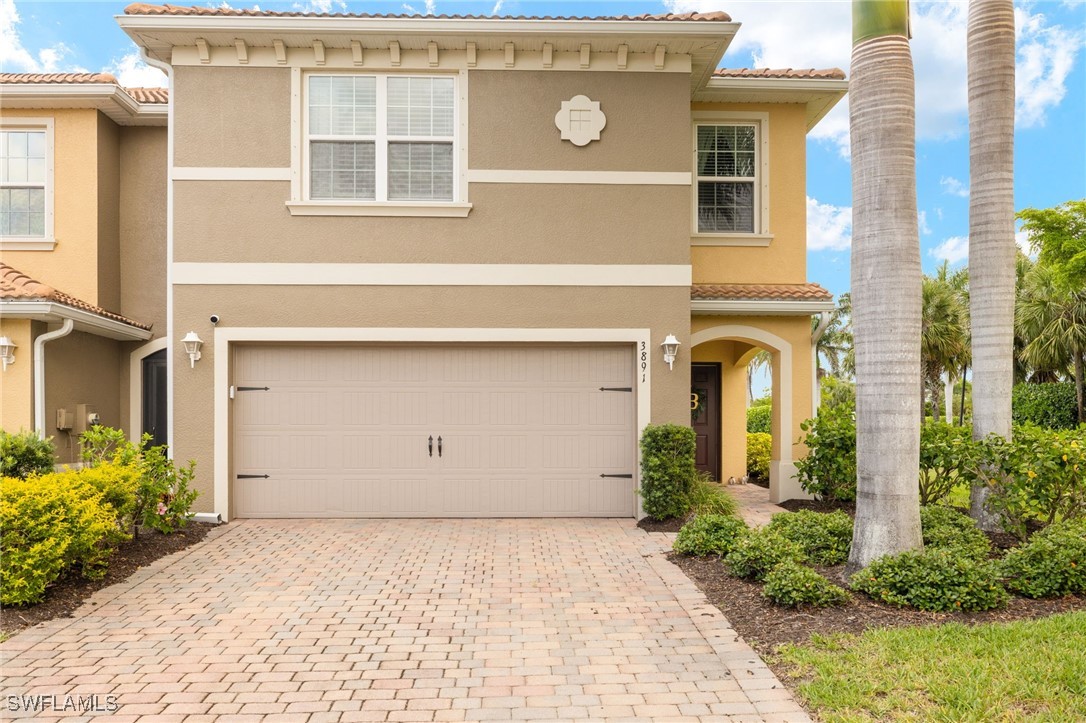
$337,575
3
bds
|
3
ba
|
2,018
sqft
|
built
2016
3891 Tilbor Cir, Fort Myers, FL 33916
$-581
Cash flow
-9.0%
Cash-on-Cash Return
4.1%
Cap rate
0.7%
Rent to Value Ratio
Active
$475,000
3
bds
|
2
ba
|
1,650
sqft
|
built
1998
8164 Harrisburg Dr, Fort Myers, FL 33967
$-734
Cash flow
-8.1%
Cash-on-Cash Return
4.3%
Cap rate
0.5%
Rent to Value Ratio
Active
$275,000
3
bds
|
3
ba
|
1,634
sqft
|
built
2004
8311 Village Edge Cir, Fort Myers, FL 33919
$-533
Cash flow
-10.1%
Cash-on-Cash Return
3.8%
Cap rate
0.9%
Rent to Value Ratio
Active
$314,900
3
bds
|
3
ba
|
1,942
sqft
|
built
2018
8874 Via Isola Ct, Fort Myers, FL 33966
$-840
Cash flow
-13.9%
Cash-on-Cash Return
2.9%
Cap rate
0.7%
Rent to Value Ratio
Active
$445,000
4
bds
|
2
ba
|
1,828
sqft
|
built
2018
8519 Morris Rd, Fort Myers, FL 33967
$-632
Cash flow
-7.4%
Cash-on-Cash Return
4.4%
Cap rate
0.6%
Rent to Value Ratio
Active
$565,000
4
bds
|
3
ba
|
2,635
sqft
|
built
2008
9344 Via Murano Ct, Fort Myers, FL 33905
$-1,114
Cash flow
-10.3%
Cash-on-Cash Return
3.8%
Cap rate
0.6%
Rent to Value Ratio
Active
$415,000
3
bds
|
2
ba
|
1,380
sqft
|
built
1968
10651 Marie St, Fort Myers, FL 33905
$-552
Cash flow
-6.9%
Cash-on-Cash Return
4.6%
Cap rate
0.6%
Rent to Value Ratio
Active
$694,000
4
bds
|
3
ba
|
2,439
sqft
|
built
2002
13916 Bald Cypress Cir, Fort Myers, FL 33907
$-1,965
Cash flow
-14.8%
Cash-on-Cash Return
2.7%
Cap rate
0.5%
Rent to Value Ratio
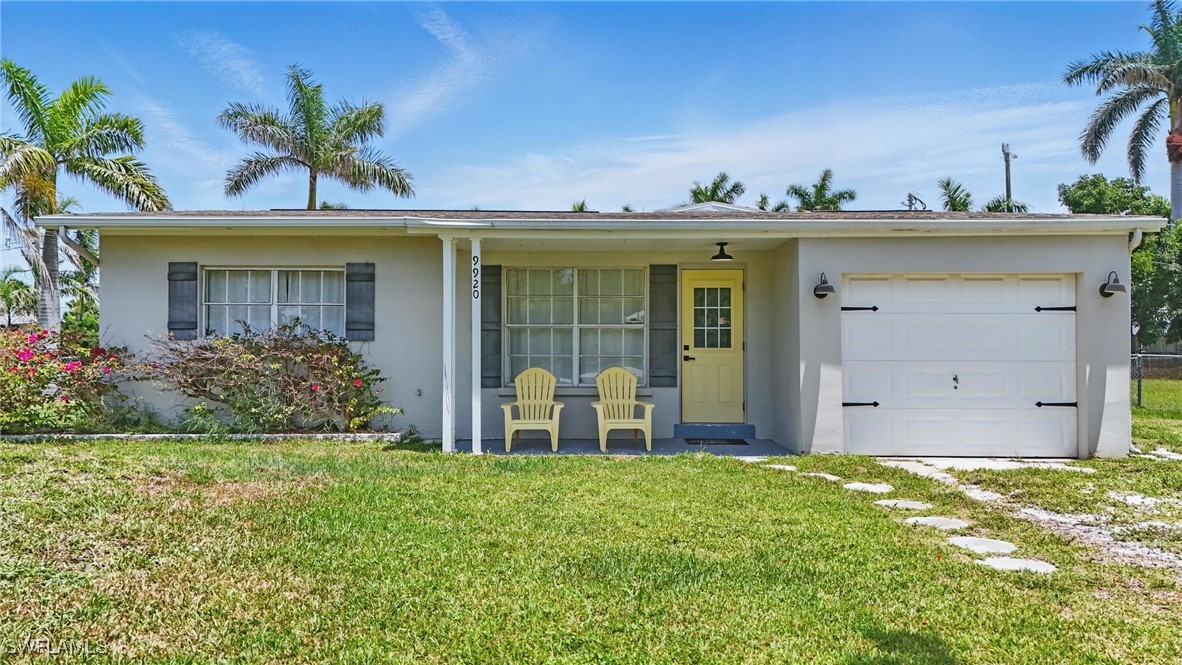
Active
$299,900
2
bds
|
2
ba
|
1,509
sqft
|
built
1958
9920 Almetta Ave, Fort Myers, FL 33919
$-333
Cash flow
-5.8%
Cash-on-Cash Return
4.8%
Cap rate
0.7%
Rent to Value Ratio