Fort Myers, FL Investment Properties for Sale
Browse homes for sale and investment properties in Fort Myers, FL. Refine your search by price, property type, or more.
Best cash flowing properties in Fort Myers, FL
Active
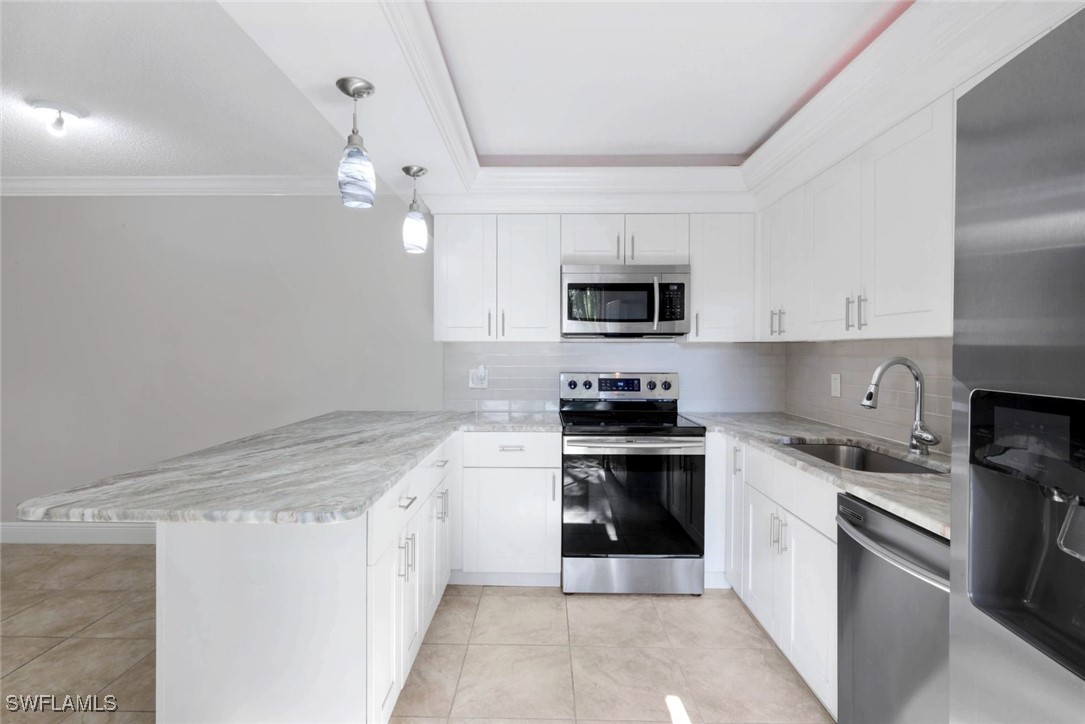
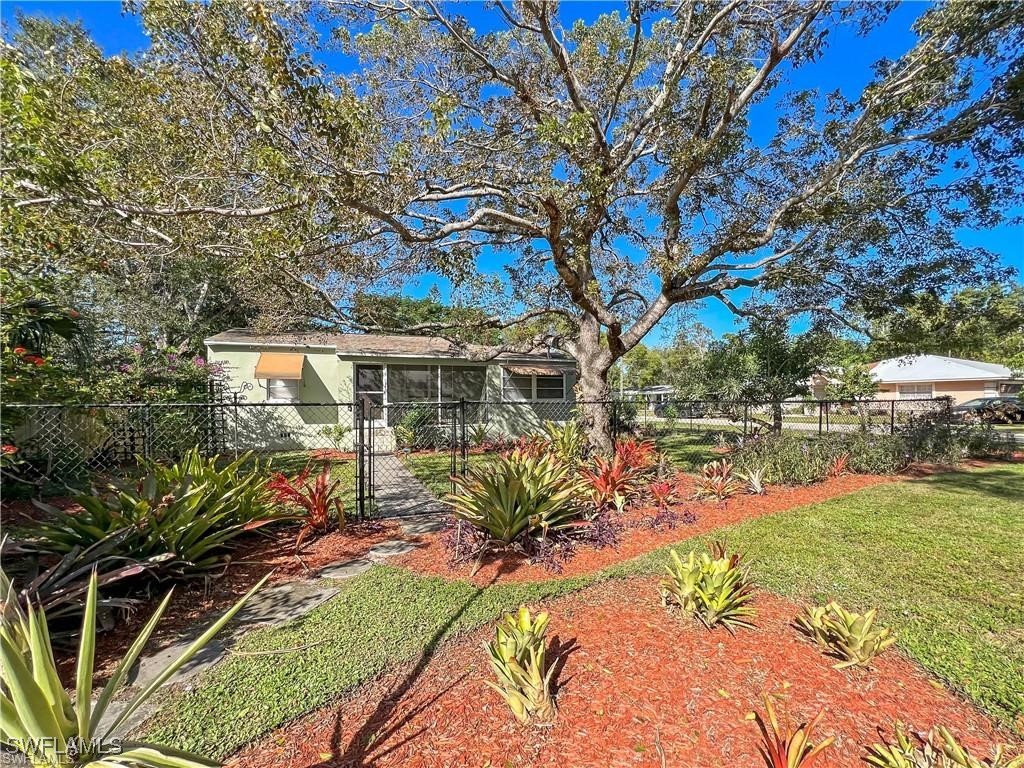
$199,000
2
bds
|
2
ba
|
1,260
sqft
|
built
1980
1501 Park Meadows Dr, Fort Myers, FL 33907
$-3
Cash flow
-0.1%
Cash-on-Cash Return
6.3%
Cap rate
1.0%
Rent to Value Ratio
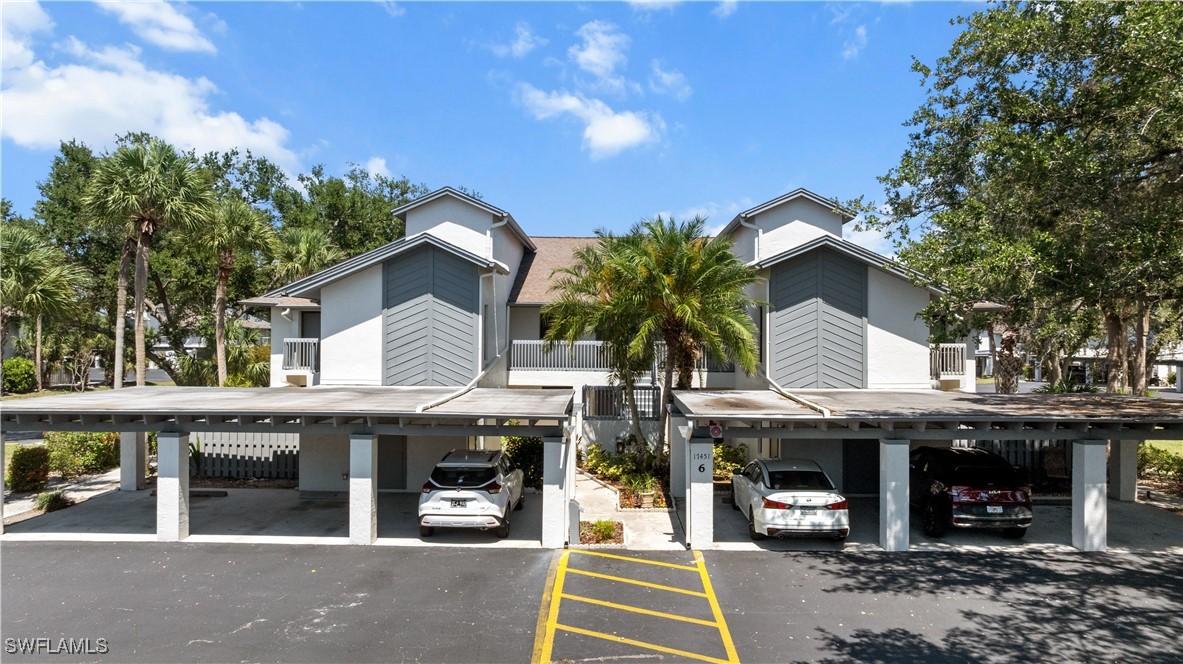
Active
$179,900
2
bds
|
2
ba
|
1,015
sqft
|
built
1983
17451 Overhill Dr, Fort Myers, FL 33908
$-6
Cash flow
-0.2%
Cash-on-Cash Return
6.2%
Cap rate
0.9%
Rent to Value Ratio
2,941 out of 3,107 properties for sale in Fort Myers, FL
Limited Results Shown
Create a free account, or log in to reveal all property listings and enjoy the complete experience.
Active
$279,000
1
bds
|
2
ba
|
885
sqft
|
built
2007
2743 1st St, Fort Myers, FL 33916
$-680
Cash flow
-12.7%
Cash-on-Cash Return
3.4%
Cap rate
0.8%
Rent to Value Ratio
Active
$219,000
2
bds
|
3
ba
|
1,230
sqft
|
built
2005
3646 Pine Oak Cir, Fort Myers, FL 33916
$-552
Cash flow
-13.2%
Cash-on-Cash Return
3.3%
Cap rate
0.8%
Rent to Value Ratio
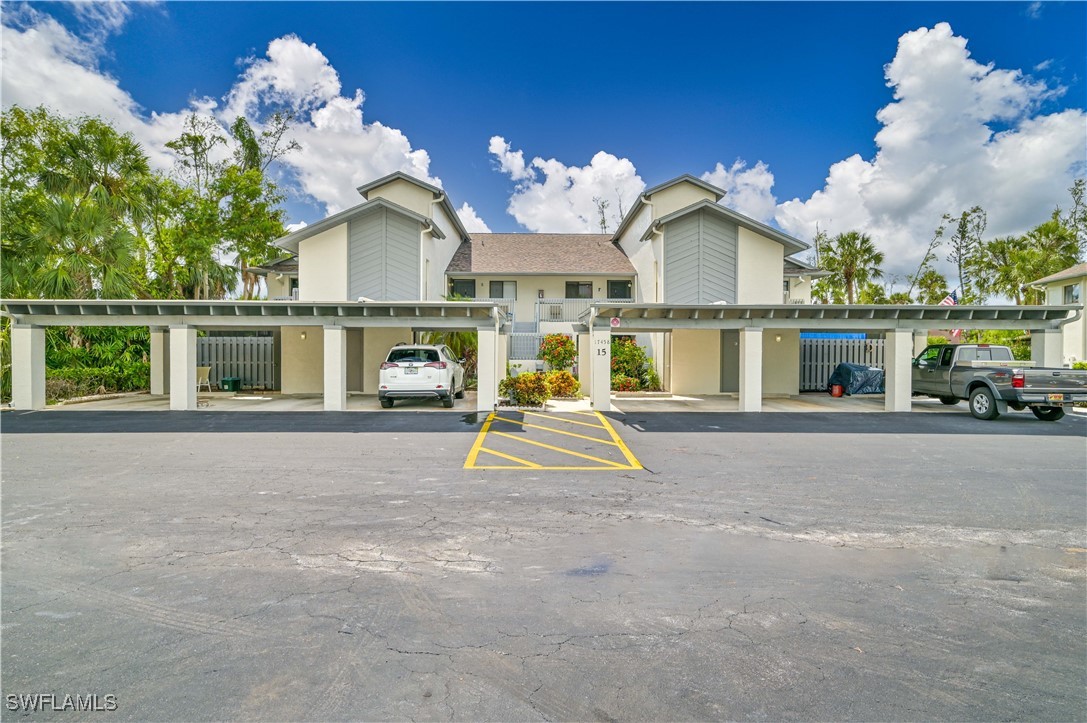
Active
$174,900
2
bds
|
2
ba
|
1,107
sqft
|
built
1997
11500 Villa Grand, Fort Myers, FL 33913
$-589
Cash flow
-17.6%
Cash-on-Cash Return
2.2%
Cap rate
0.9%
Rent to Value Ratio
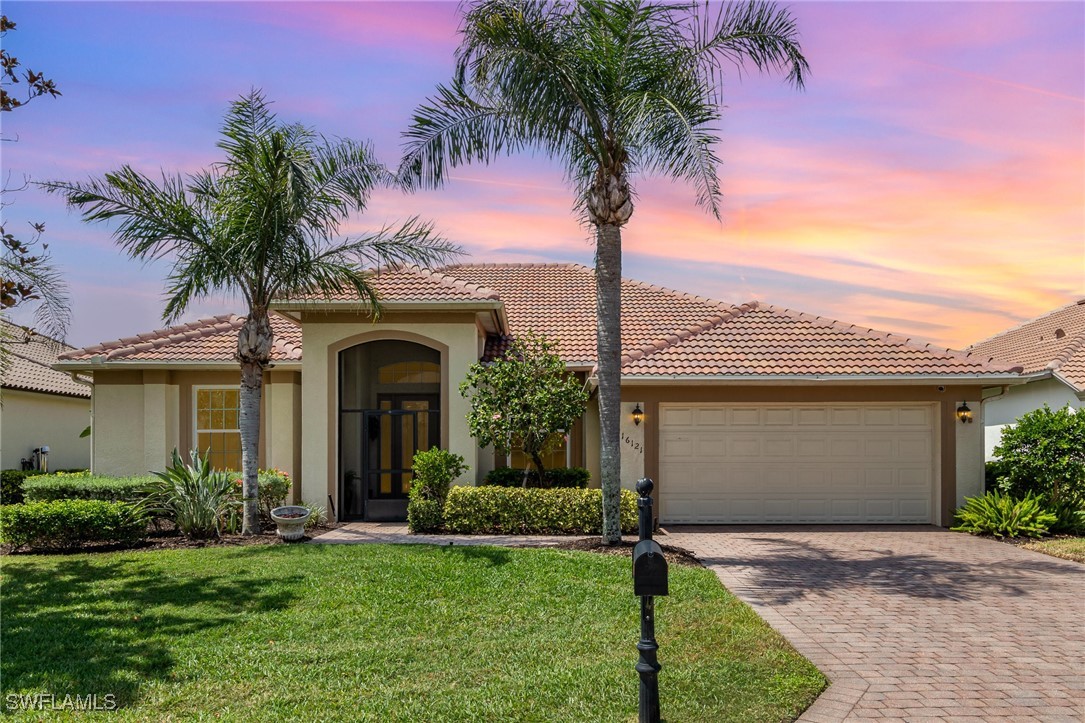
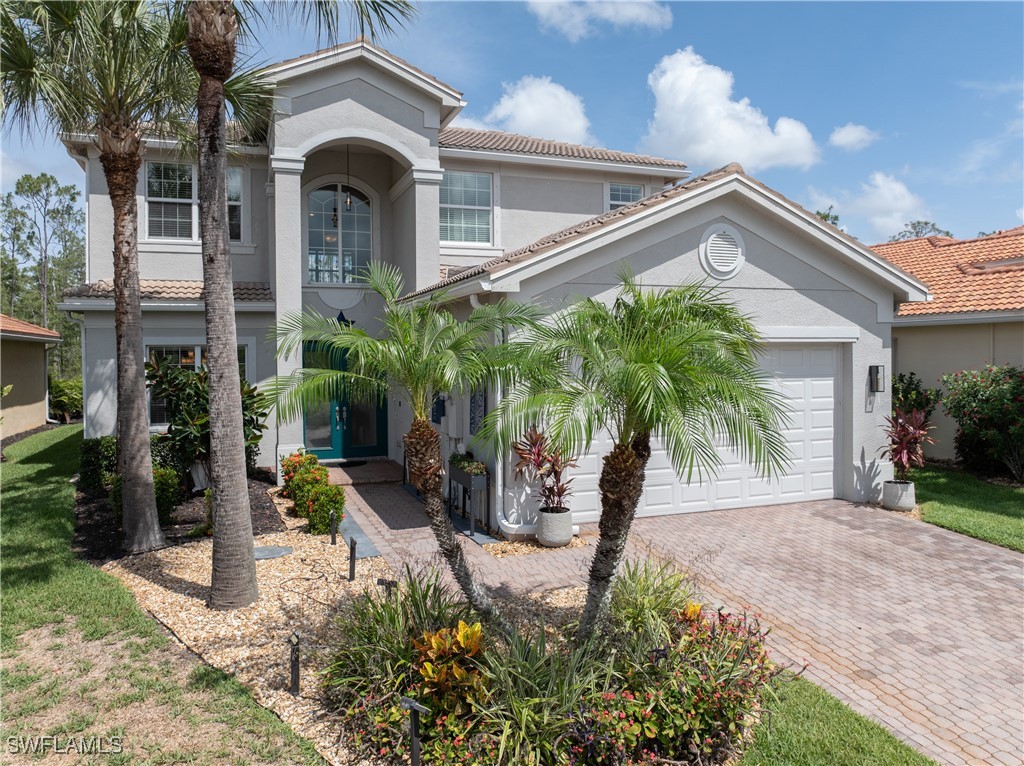
Active
$575,000
4
bds
|
3
ba
|
2,379
sqft
|
built
2005
16121 Sand Ridge Ct, Fort Myers, FL 33908
$-1,601
Cash flow
-14.5%
Cash-on-Cash Return
2.9%
Cap rate
0.6%
Rent to Value Ratio
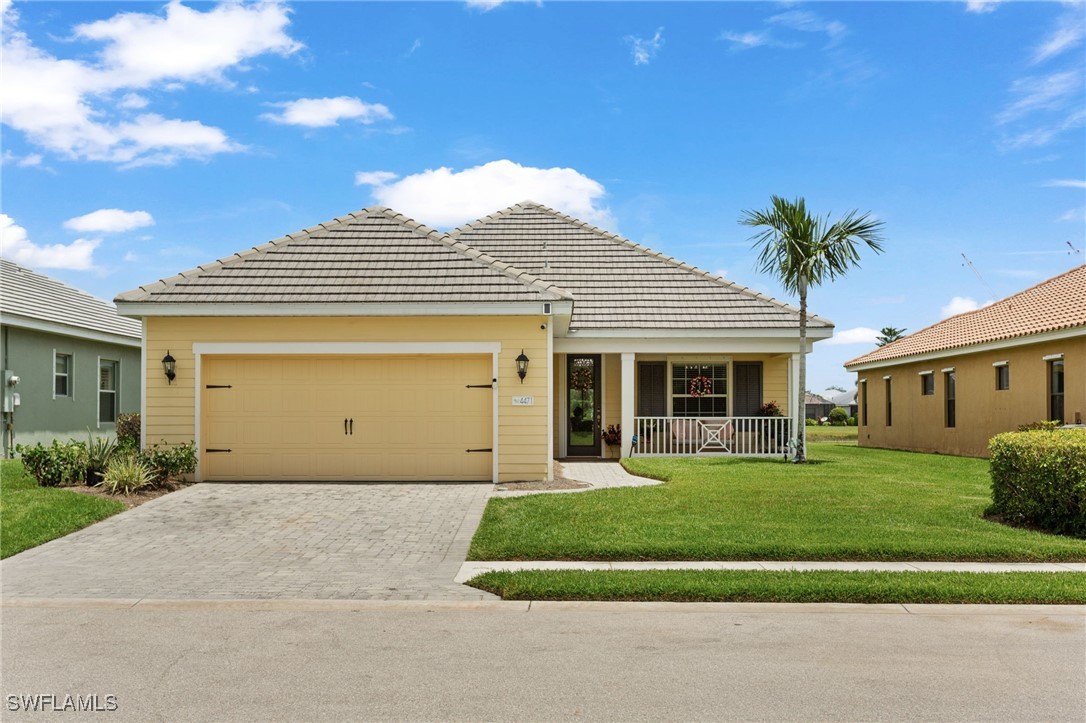
Active
$530,000
3
bds
|
2
ba
|
1,947
sqft
|
built
2015
4471 Watercolor Way, Fort Myers, FL 33966
$-1,705
Cash flow
-16.8%
Cash-on-Cash Return
2.4%
Cap rate
0.5%
Rent to Value Ratio
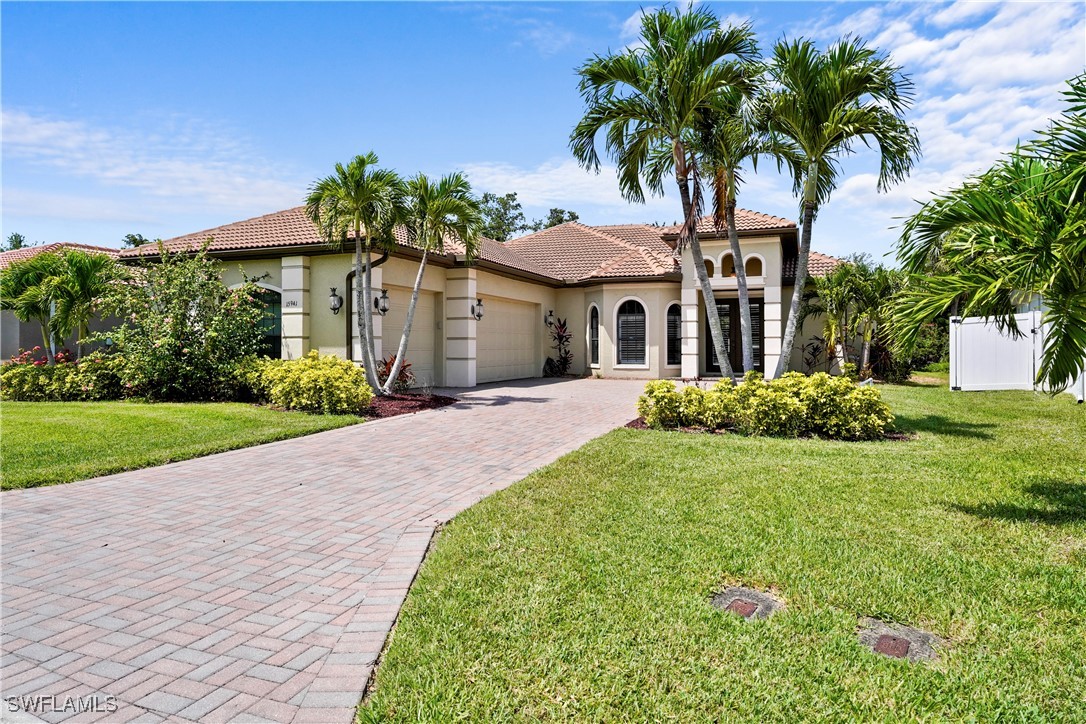
Active
$544,000
4
bds
|
3
ba
|
2,095
sqft
|
built
2006
15941 Chance Way, Fort Myers, FL 33908
$-1,044
Cash flow
-10.0%
Cash-on-Cash Return
4.0%
Cap rate
0.6%
Rent to Value Ratio
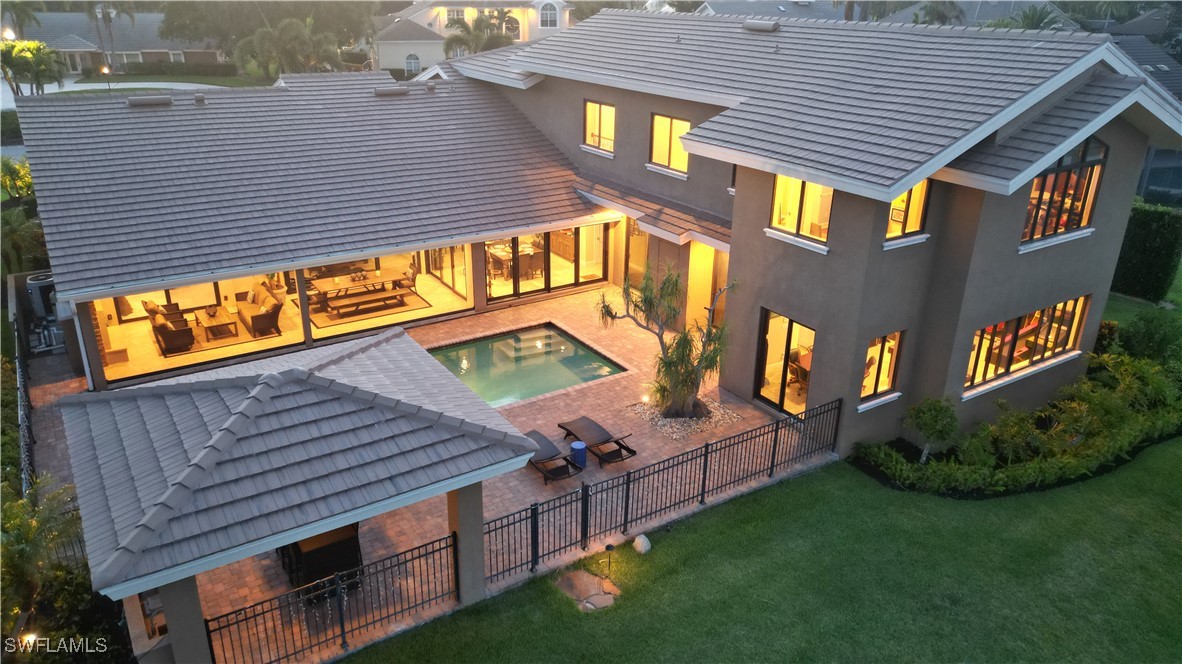
Active
$1,600,000
3
bds
|
3
ba
|
2,870
sqft
|
built
2001
14220 Royal Harbour Ct, Fort Myers, FL 33908
$-5,416
Cash flow
-17.7%
Cash-on-Cash Return
2.2%
Cap rate
0.5%
Rent to Value Ratio
Active
$820,000
3
bds
|
2
ba
|
2,196
sqft
|
built
1980
123 Placid Dr, Fort Myers, FL 33919
$-1,473
Cash flow
-9.4%
Cash-on-Cash Return
4.1%
Cap rate
0.5%
Rent to Value Ratio
Active
$499,900
3
bds
|
3
ba
|
2,479
sqft
|
built
2021
4716 Imperial Eagle Dr, Fort Myers, FL 33966
$-1,459
Cash flow
-15.2%
Cash-on-Cash Return
2.8%
Cap rate
0.6%
Rent to Value Ratio
Active
$325,000
2
bds
|
2
ba
|
2,053
sqft
|
built
1983
5260 S Landings Dr, Fort Myers, FL 33919
$-1,525
Cash flow
-24.5%
Cash-on-Cash Return
0.7%
Cap rate
0.8%
Rent to Value Ratio
Active
$349,900
4
bds
|
2
ba
|
1,616
sqft
|
built
1959
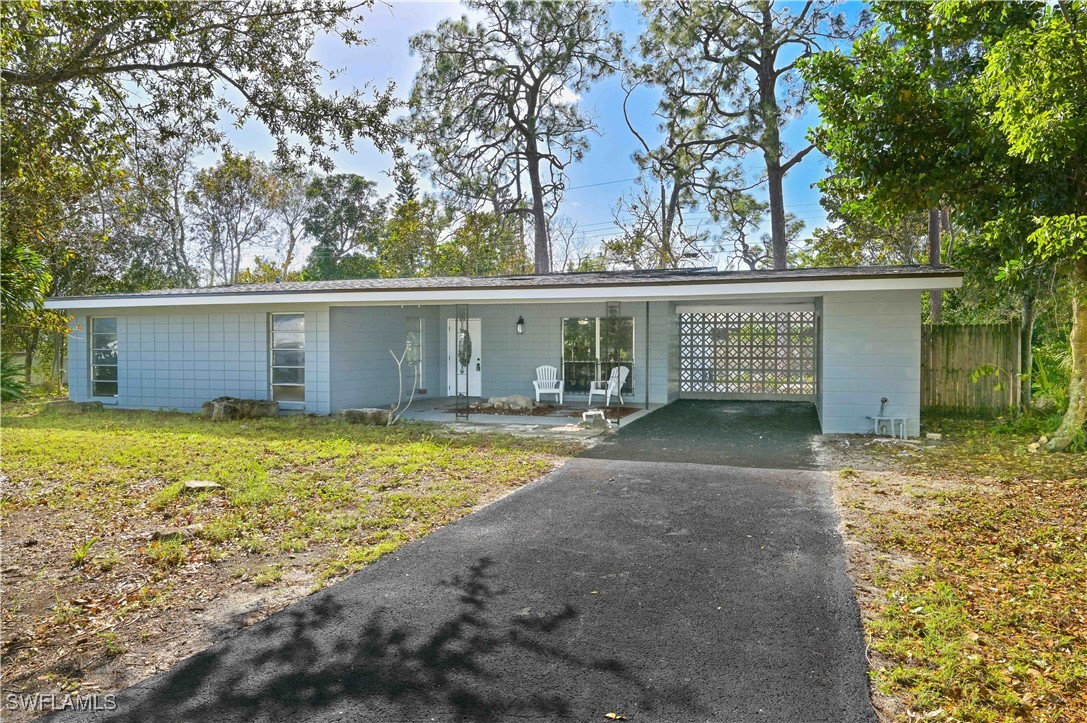
2100 Burton Ave, Fort Myers, FL 33907
$-378
Cash flow
-5.6%
Cash-on-Cash Return
5.0%
Cap rate
0.7%
Rent to Value Ratio
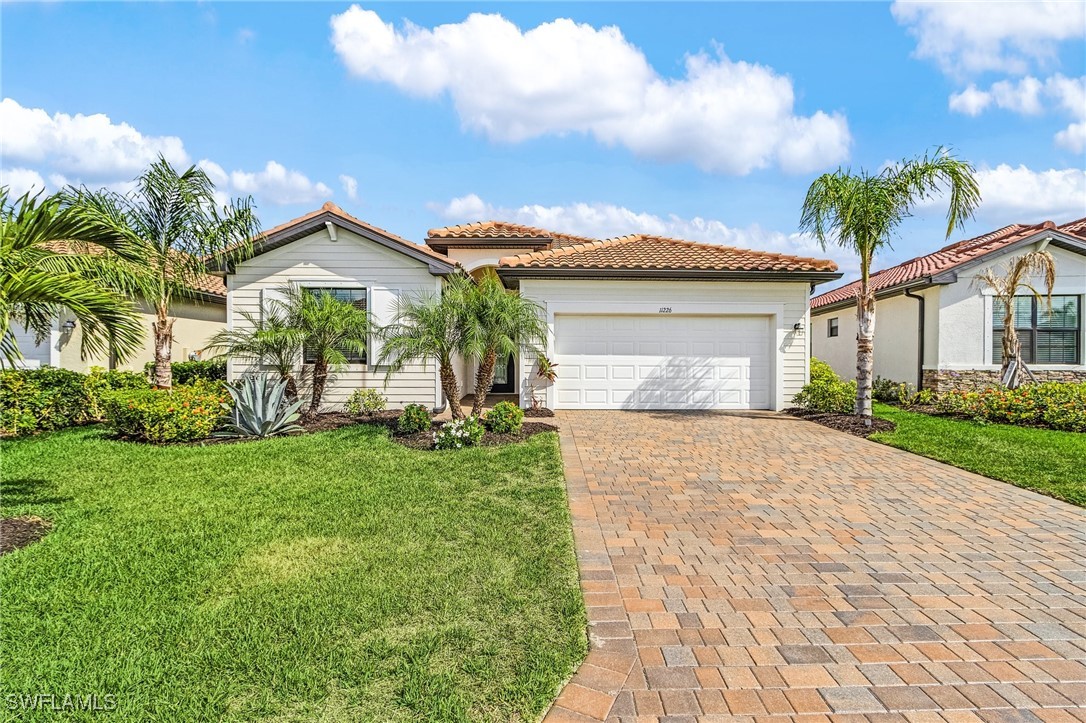
Active
$480,000
4
bds
|
3
ba
|
2,032
sqft
|
built
2022
11226 Shady Blossom Dr, Fort Myers, FL 33913
$-1,391
Cash flow
-15.1%
Cash-on-Cash Return
2.8%
Cap rate
0.7%
Rent to Value Ratio
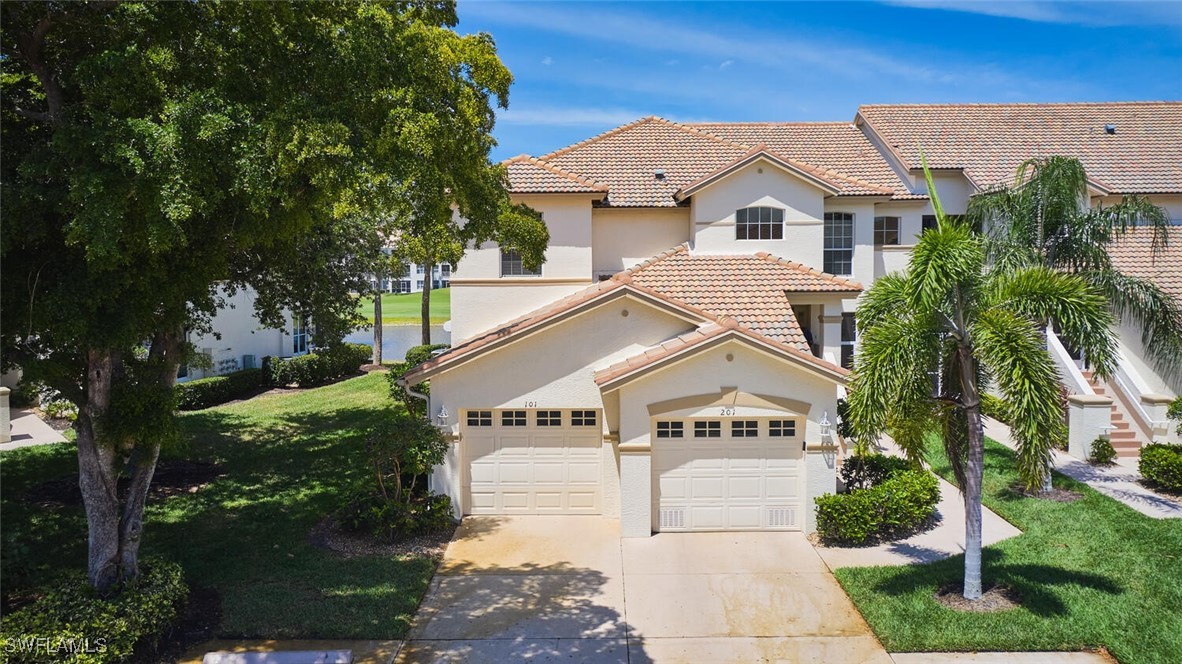
Active
$409,900
2
bds
|
2
ba
|
1,856
sqft
|
built
1998
9231 Bayberry Bnd, Fort Myers, FL 33908
$-1,432
Cash flow
-18.2%
Cash-on-Cash Return
2.1%
Cap rate
0.6%
Rent to Value Ratio
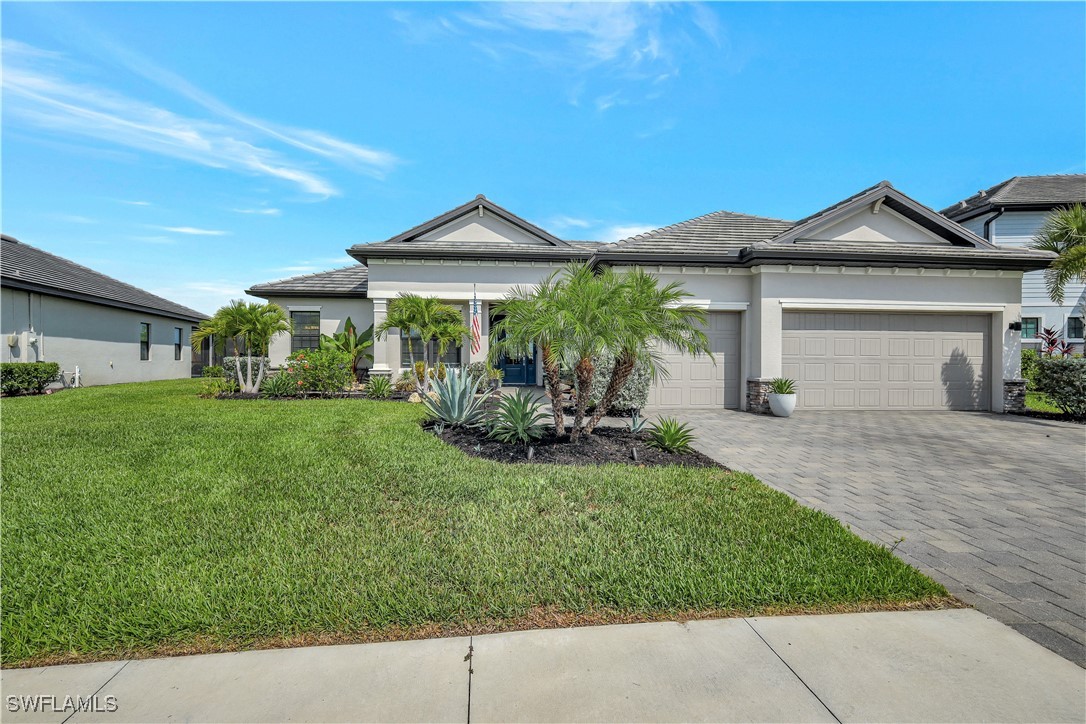
Active
$669,900
4
bds
|
3
ba
|
2,362
sqft
|
built
2021
11693 Canopy Loop, Fort Myers, FL 33913
$-1,719
Cash flow
-13.4%
Cash-on-Cash Return
3.2%
Cap rate
0.6%
Rent to Value Ratio
Active
$336,000
3
bds
|
2
ba
|
1,704
sqft
|
built
1997
14250 Chancellor St, Fort Myers, FL 33905
$-145
Cash flow
-2.3%
Cash-on-Cash Return
5.8%
Cap rate
0.7%
Rent to Value Ratio
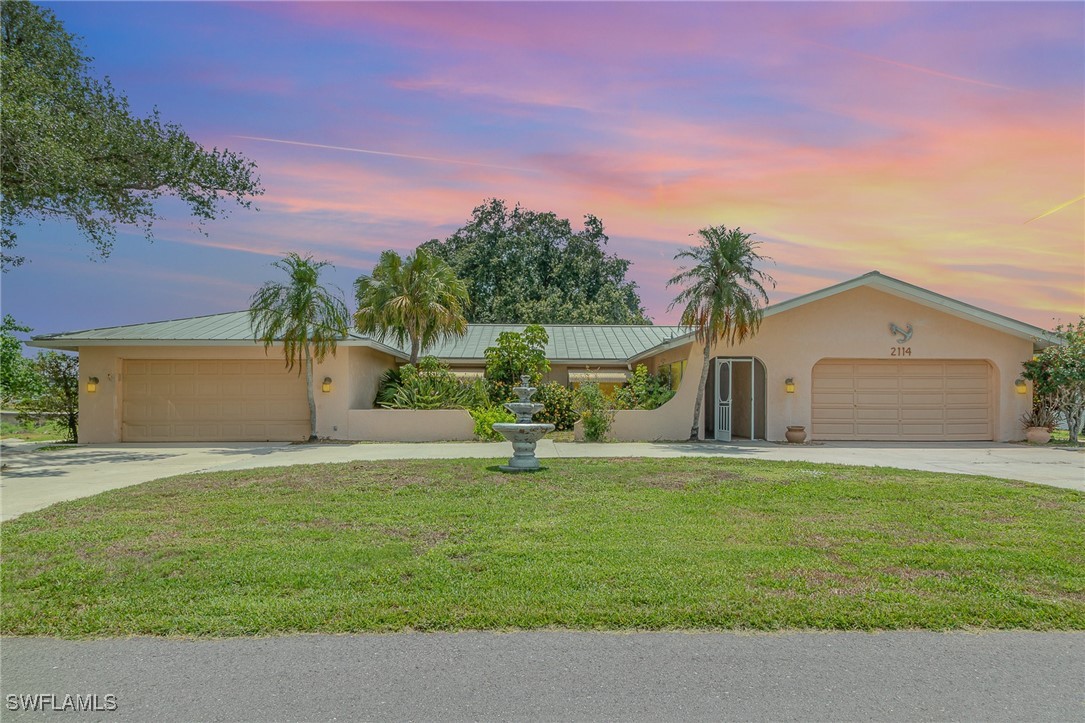
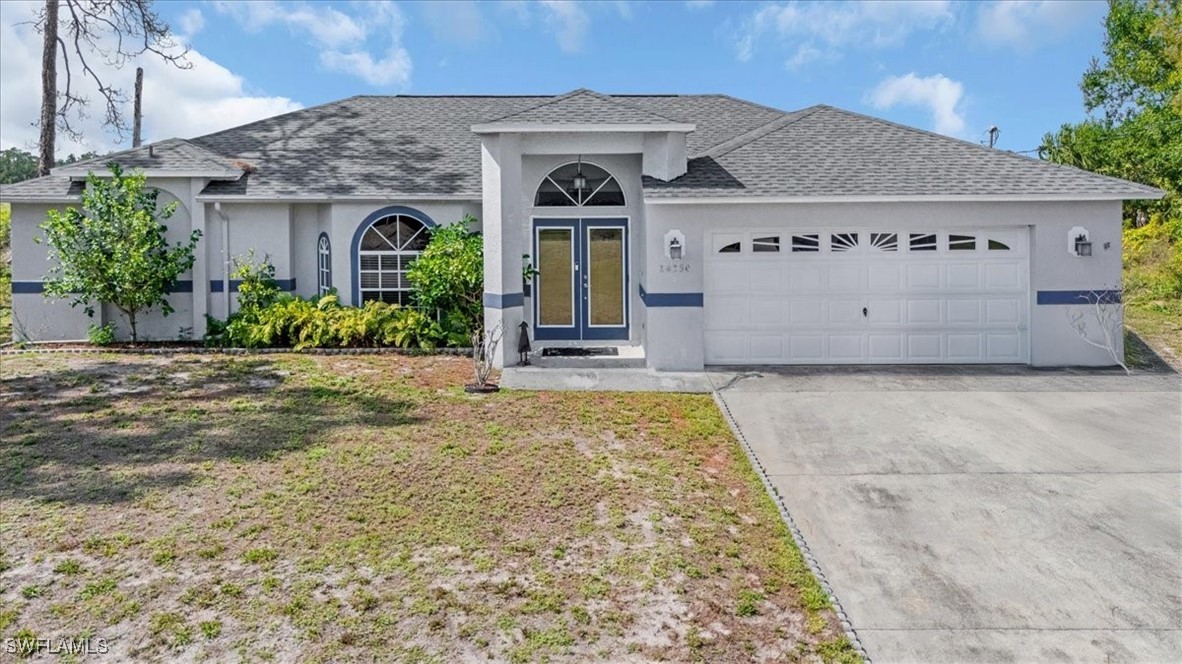
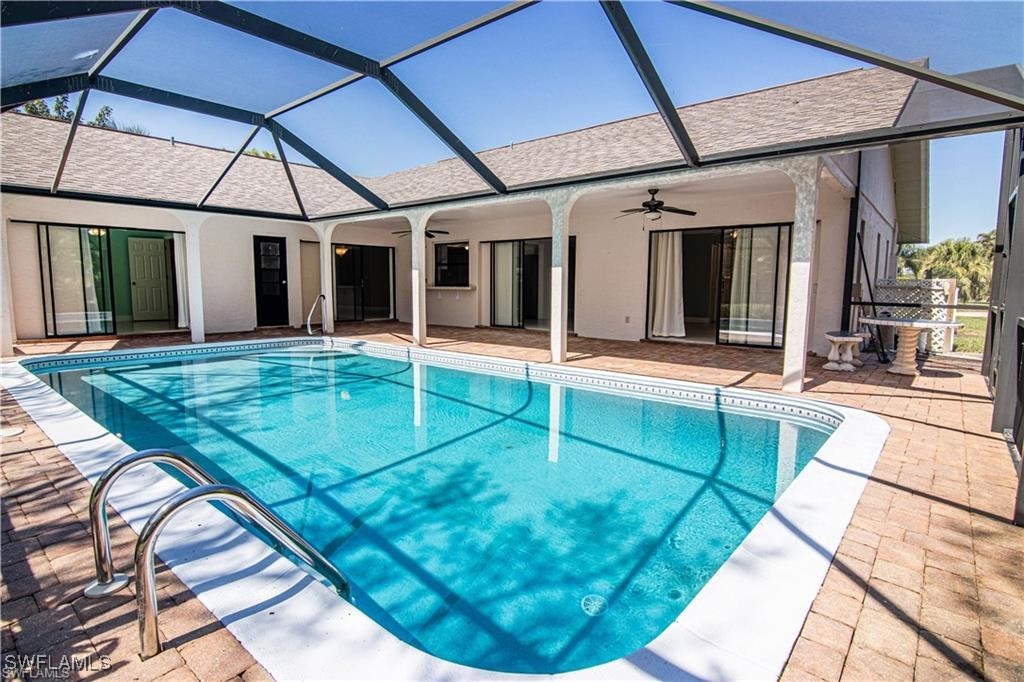
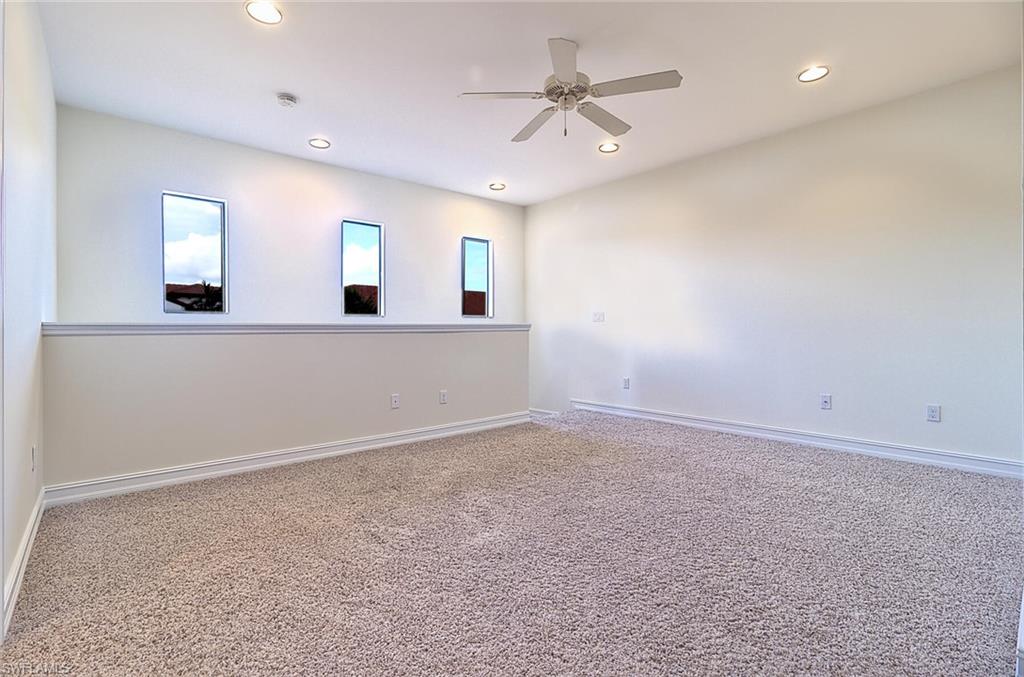
Active
$549,900
3
bds
|
2
ba
|
1,611
sqft
|
built
1975
2114 Aruba Ave, Fort Myers, FL 33905
$-1,115
Cash flow
-10.6%
Cash-on-Cash Return
3.9%
Cap rate
0.5%
Rent to Value Ratio
Active
$530,000
3
bds
|
2
ba
|
1,806
sqft
|
built
1983
6113 Deer Run, Fort Myers, FL 33908
$-1,411
Cash flow
-13.9%
Cash-on-Cash Return
3.1%
Cap rate
0.5%
Rent to Value Ratio
Active under contract
$300,000
3
bds
|
3
ba
|
1,761
sqft
|
built
2016
9440 Sardinia Way, Fort Myers, FL 33908
$-727
Cash flow
-12.6%
Cash-on-Cash Return
3.4%
Cap rate
0.9%
Rent to Value Ratio
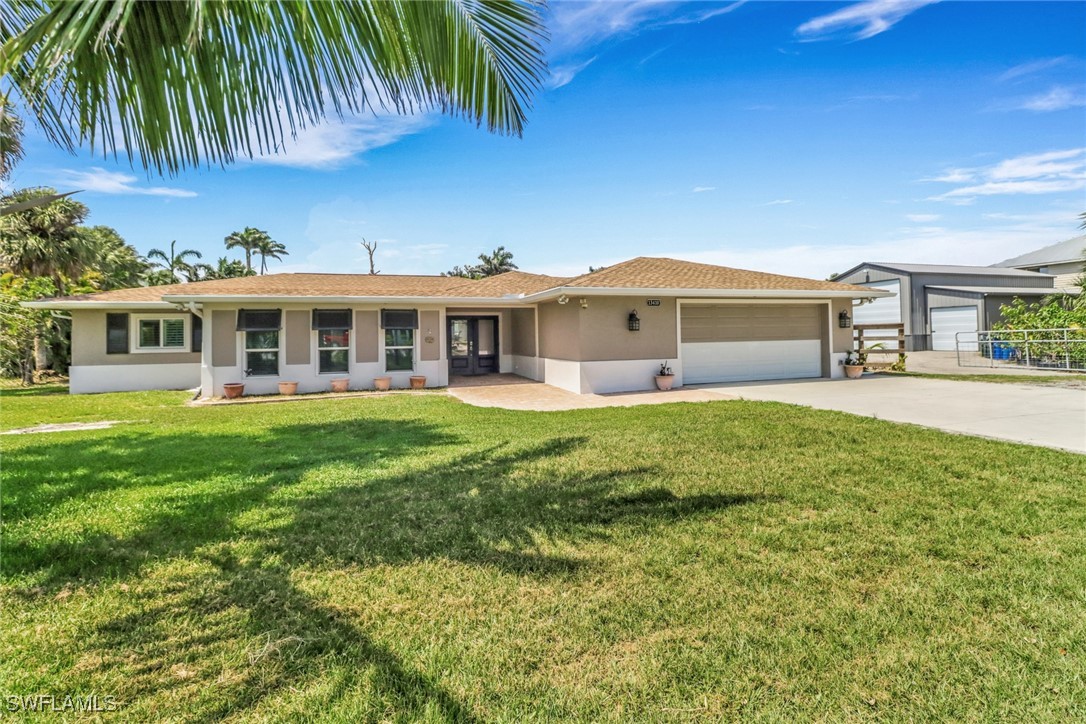
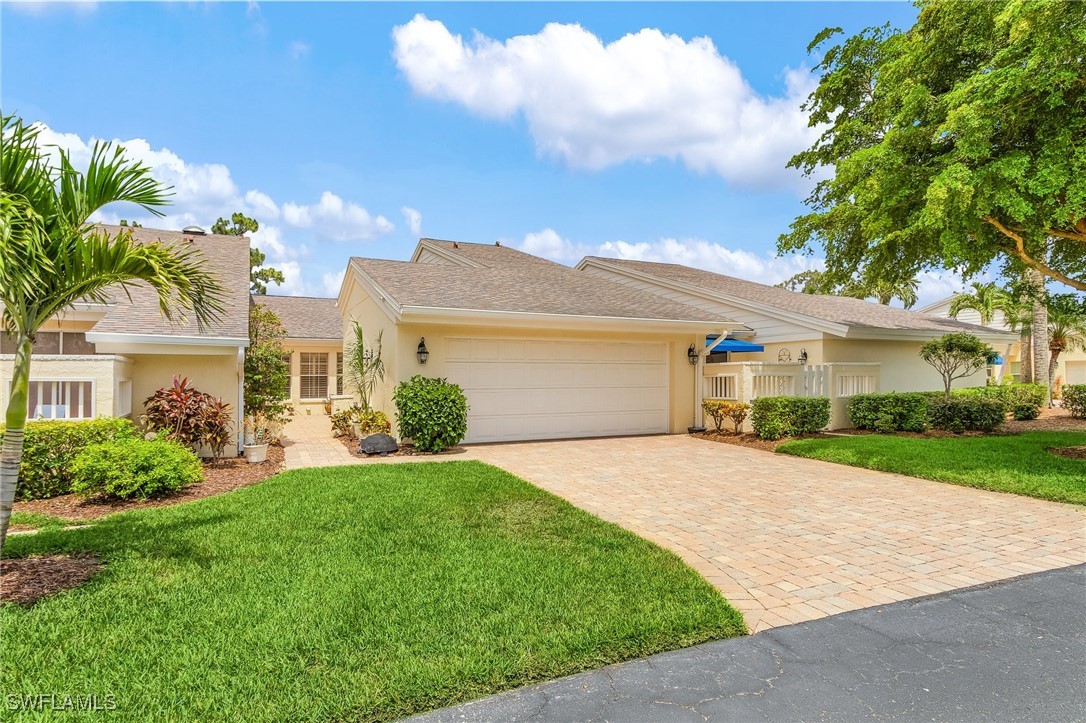
Active
$619,000
3
bds
|
2
ba
|
2,047
sqft
|
built
1978
13410 Electron Dr, Fort Myers, FL 33908
$-1,614
Cash flow
-13.6%
Cash-on-Cash Return
3.2%
Cap rate
0.5%
Rent to Value Ratio
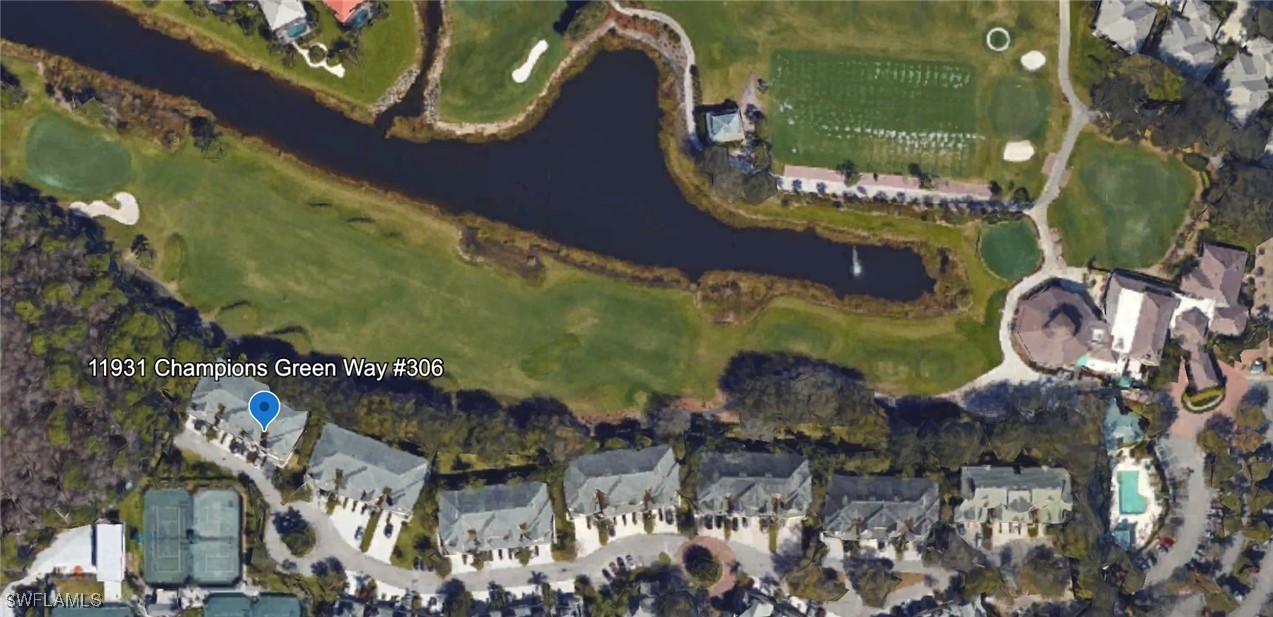
Active
$258,500
3
bds
|
2
ba
|
1,623
sqft
|
built
2007
11931 Champions Green Way, Fort Myers, FL 33913
$-667
Cash flow
-13.5%
Cash-on-Cash Return
3.2%
Cap rate
1.0%
Rent to Value Ratio
Active
$595,000
3
bds
|
2
ba
|
1,827
sqft
|
built
1987
15657 Carriedale Ln, Fort Myers, FL 33912
$-3,450
Cash flow
-30.3%
Cash-on-Cash Return
-0.7%
Cap rate
0.5%
Rent to Value Ratio
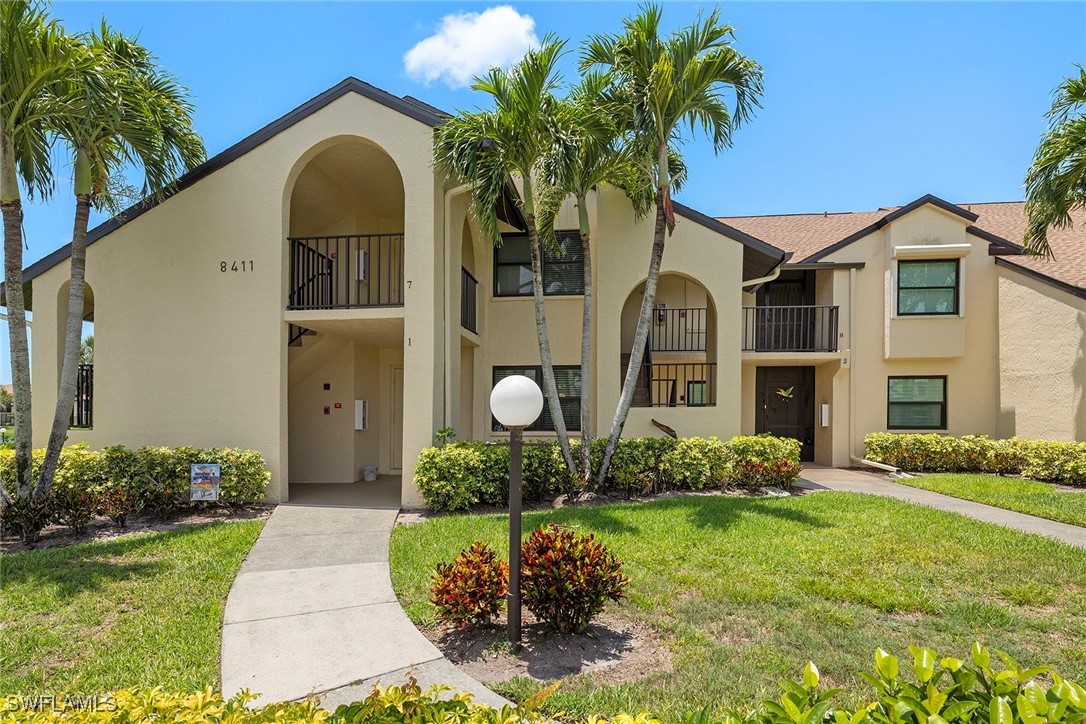
Active
$299,000
3
bds
|
2
ba
|
1,339
sqft
|
built
1985
8411 Charter Club Cir, Fort Myers, FL 33919
$-254
Cash flow
-4.4%
Cash-on-Cash Return
5.3%
Cap rate
0.7%
Rent to Value Ratio
Active
$395,000
2
bds
|
1
ba
|
1,100
sqft
|
built
1948
2304 Clifford St, Fort Myers, FL 33901
$-969
Cash flow
-12.8%
Cash-on-Cash Return
3.3%
Cap rate
0.5%
Rent to Value Ratio
Active
$179,900
2
bds
|
2
ba
|
1,015
sqft
|
built
1983
17451 Overhill Dr, Fort Myers, FL 33908
$-6
Cash flow
-0.2%
Cash-on-Cash Return
6.2%
Cap rate
0.9%
Rent to Value Ratio
Active
$530,000
5
bds
|
4
ba
|
3,266
sqft
|
built
2013
11164 Sparkleberry Dr, Fort Myers, FL 33913
$-843
Cash flow
-8.3%
Cash-on-Cash Return
4.4%
Cap rate
0.7%
Rent to Value Ratio
Active
$178,500
2
bds
|
2
ba
|
1,093
sqft
|
built
1986
17458 Blueberry Hill Dr, Fort Myers, FL 33908
$-447
Cash flow
-13.1%
Cash-on-Cash Return
3.3%
Cap rate
1.0%
Rent to Value Ratio
Active
$1,849,999
6
bds
|
7
ba
|
5,664
sqft
|
built
1984
15801 Kilmarnock Dr, Fort Myers, FL 33912
$-7,255
Cash flow
-20.5%
Cash-on-Cash Return
1.6%
Cap rate
0.4%
Rent to Value Ratio
Active
$449,900
3
bds
|
2
ba
|
1,842
sqft
|
built
2020
7028 Mistral Way, Fort Myers, FL 33966
$-1,232
Cash flow
-14.3%
Cash-on-Cash Return
3.0%
Cap rate
0.6%
Rent to Value Ratio
Active
$1,200,000
6
bds
|
6
ba
|
4,190
sqft
|
built
2018
11651 Oakwood Preserve Pl, Fort Myers, FL 33913
$-2,202
Cash flow
-9.6%
Cash-on-Cash Return
4.1%
Cap rate
0.6%
Rent to Value Ratio
Pending
$107,000
1
bds
|
1
ba
|
560
sqft
|
built
1985
2855 Winkler Ave, Fort Myers, FL 33916
$-7
Cash flow
-0.3%
Cash-on-Cash Return
6.2%
Cap rate
1.2%
Rent to Value Ratio
Active
$445,500
3
bds
|
2
ba
|
1,732
sqft
|
built
1993
11454 Waterford Village Dr, Fort Myers, FL 33913
$-754
Cash flow
-8.8%
Cash-on-Cash Return
4.3%
Cap rate
0.6%
Rent to Value Ratio
Active
$1,750,000
4
bds
|
3
ba
|
2,966
sqft
|
built
2022
18380 Wildblue Blvd, Fort Myers, FL 33913
$-6,789
Cash flow
-20.2%
Cash-on-Cash Return
1.6%
Cap rate
0.4%
Rent to Value Ratio
Active
$829,900
3
bds
|
3
ba
|
2,561
sqft
|
built
2011
10971 Surrey Pl, Fort Myers, FL 33913
$-2,133
Cash flow
-13.4%
Cash-on-Cash Return
3.2%
Cap rate
0.6%
Rent to Value Ratio
Active
$199,000
2
bds
|
2
ba
|
1,260
sqft
|
built
1980
1501 Park Meadows Dr, Fort Myers, FL 33907
$-3
Cash flow
-0.1%
Cash-on-Cash Return
6.3%
Cap rate
1.0%
Rent to Value Ratio
Active
$335,000
2
bds
|
3
ba
|
1,635
sqft
|
built
1975
4406 Foremast Ct, Fort Myers, FL 33919
$-439
Cash flow
-6.8%
Cash-on-Cash Return
4.7%
Cap rate
0.7%
Rent to Value Ratio
Active
$1,200,000
5
bds
|
4
ba
|
3,928
sqft
|
built
2000
1357 Osceola Dr, Fort Myers, FL 33901
$-2,345
Cash flow
-10.2%
Cash-on-Cash Return
3.9%
Cap rate
0.6%
Rent to Value Ratio
Active
$469,000
3
bds
|
3
ba
|
2,611
sqft
|
built
2013
8752 Banyan Bay Blvd, Fort Myers, FL 33908
$-670
Cash flow
-7.5%
Cash-on-Cash Return
4.6%
Cap rate
0.8%
Rent to Value Ratio
Active
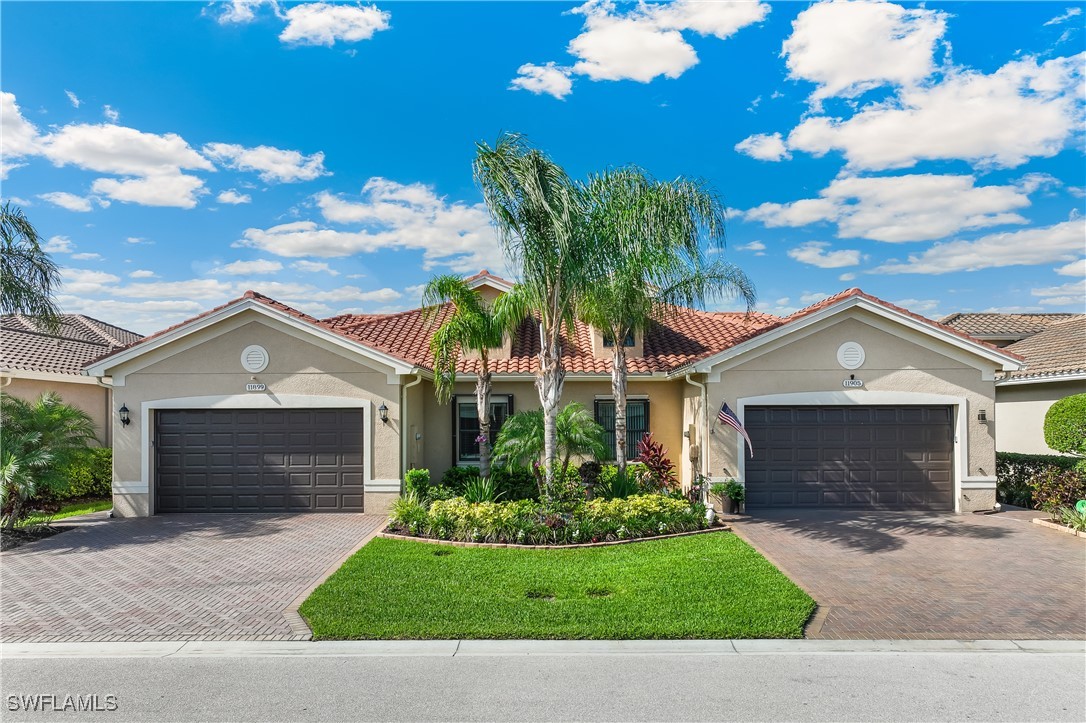
$455,000
2
bds
|
3
ba
|
2,023
sqft
|
built
2020
11899 Lakewood Preserve Pl, Fort Myers, FL 33913
$-1,179
Cash flow
-13.5%
Cash-on-Cash Return
3.2%
Cap rate
0.7%
Rent to Value Ratio
Active
$599,900
4
bds
|
3
ba
|
2,270
sqft
|
built
2002
12839 Fox Hollow Cir, Fort Myers, FL 33912
$-1,594
Cash flow
-13.9%
Cash-on-Cash Return
3.1%
Cap rate
0.5%
Rent to Value Ratio
Active
$499,999
3
bds
|
2
ba
|
2,256
sqft
|
built
2006
16162 Coco Hammock Way, Fort Myers, FL 33908
$-1,348
Cash flow
-14.1%
Cash-on-Cash Return
3.0%
Cap rate
0.6%
Rent to Value Ratio