Fort Pierce, FL Investment Properties for Sale
Browse homes for sale and investment properties in Fort Pierce, FL. Refine your search by price, property type, or more.
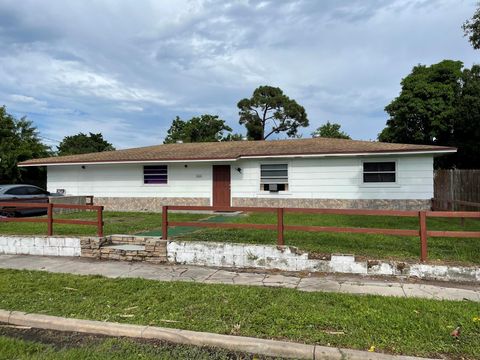
Best cash flowing properties in Fort Pierce, FL

Active
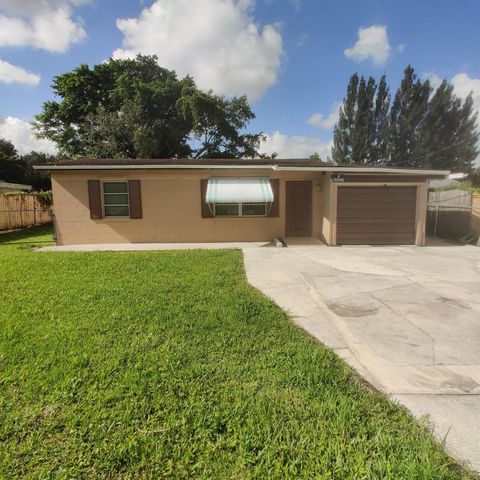
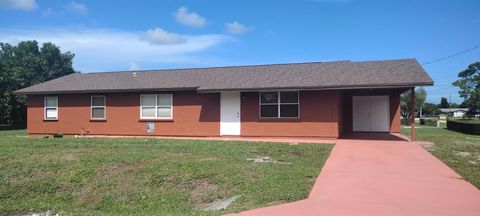
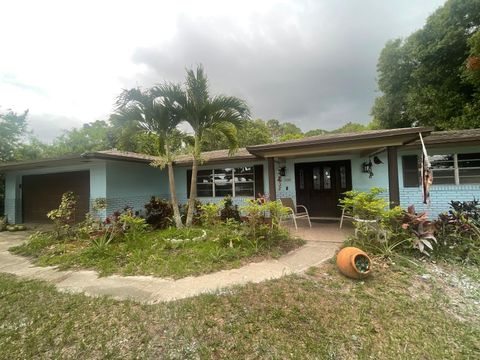
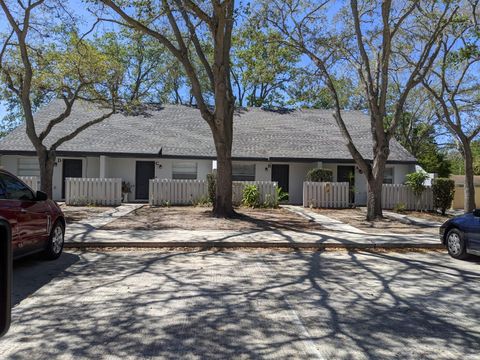
$160,000
2
bds
|
1
ba
|
966
sqft
|
built
1953
2008 N 51st Ct, Fort Pierce, FL 34947
$168
Cash flow
5.5%
Cash-on-Cash Return
7.4%
Cap rate
1.1%
Rent to Value Ratio
Active
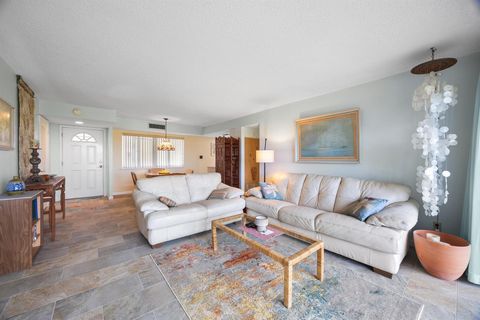
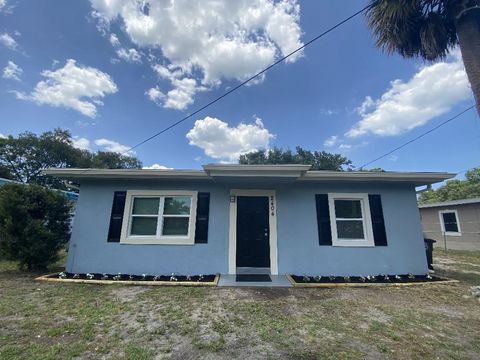
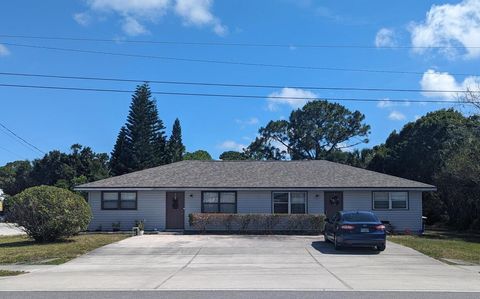
$218,900
3
bds
|
2
ba
|
1,140
sqft
|
built
1957
2307 Elizabeth Ave, Fort Pierce, FL 34982
$87
Cash flow
2.1%
Cash-on-Cash Return
6.6%
Cap rate
0.8%
Rent to Value Ratio
445 out of 579 properties for sale in Fort Pierce, FL
Limited Results Shown
Create a free account, or log in to reveal all property listings and enjoy the complete experience.
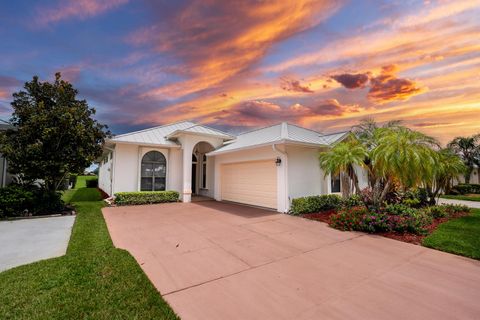
Active
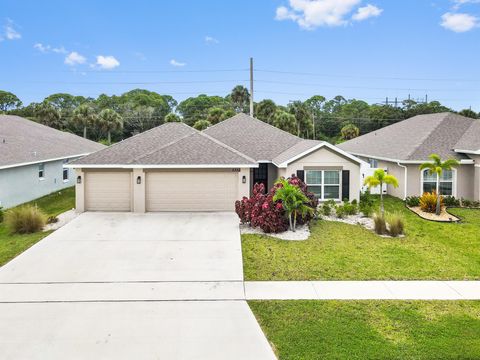
$389,500
4
bds
|
2
ba
|
2,002
sqft
|
built
2022
5352 Lugo St, Fort Pierce, FL 34951
$-869
Cash flow
-11.6%
Cash-on-Cash Return
3.5%
Cap rate
0.7%
Rent to Value Ratio
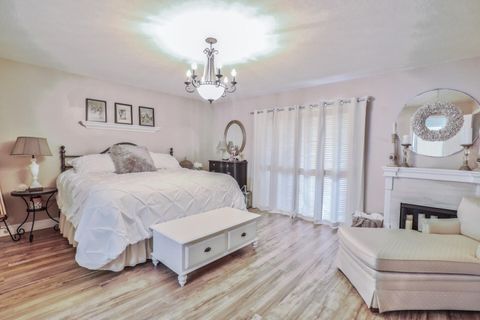
Active
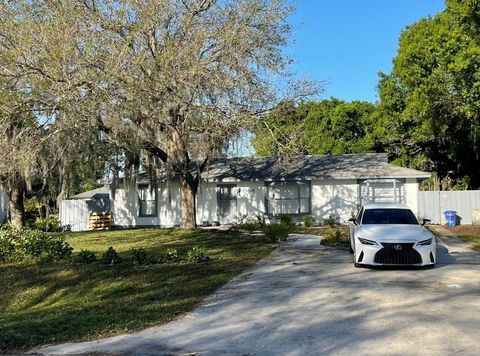
$350,000
3
bds
|
2
ba
|
1,296
sqft
|
built
1984
6105 Spring Garden Pl, Fort Pierce, FL 34951
$-547
Cash flow
-8.2%
Cash-on-Cash Return
4.3%
Cap rate
0.7%
Rent to Value Ratio
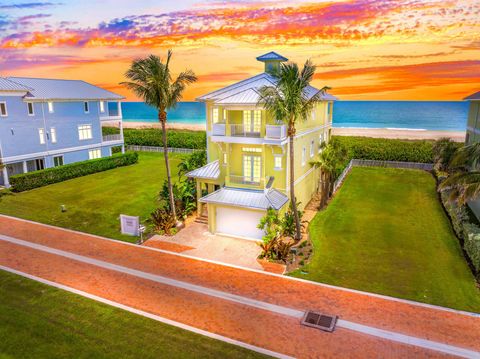
Active
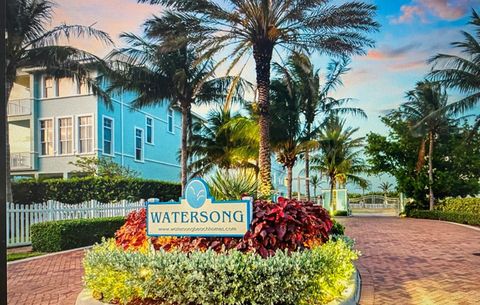
$3,649,000
5
bds
|
6
ba
|
4,232
sqft
|
built
2019
4832 Watersong Way, Fort Pierce, FL 34949
$-15,380
Cash flow
-22.0%
Cash-on-Cash Return
1.1%
Cap rate
0.3%
Rent to Value Ratio
Active
$595,000
3
bds
|
3
ba
|
1,955
sqft
|
built
2005
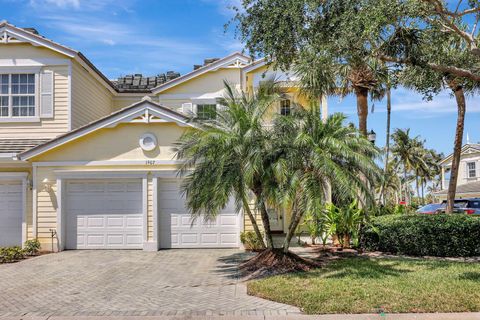
803 Mariner Bay Blvd, Fort Pierce, FL 34949
$-2,055
Cash flow
-18.0%
Cash-on-Cash Return
2.0%
Cap rate
0.5%
Rent to Value Ratio

Active
$200,000
2
bds
|
2
ba
|
1,005
sqft
|
built
1991
2828 Stoneway Ln, Fort Pierce, FL 34982
$-232
Cash flow
-6.1%
Cash-on-Cash Return
4.8%
Cap rate
1.0%
Rent to Value Ratio

Active
$269,900
3
bds
|
2
ba
|
1,389
sqft
|
built
2022
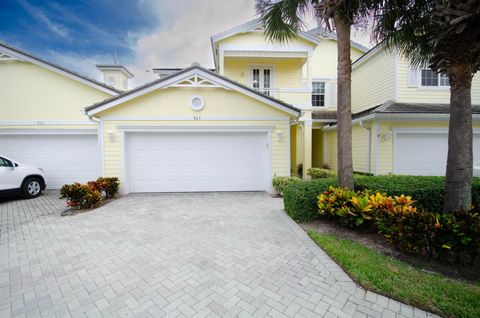
1716 Celebration Dr, Fort Pierce, FL 34947
$-448
Cash flow
-8.7%
Cash-on-Cash Return
4.2%
Cap rate
0.9%
Rent to Value Ratio
Active
$3,049,000
4
bds
|
5
ba
|
3,557
sqft
|
built
2008
5024 Watersong Way, Fort Pierce, FL 34949
$-12,436
Cash flow
-21.3%
Cash-on-Cash Return
1.3%
Cap rate
0.3%
Rent to Value Ratio
Active
$620,000
3
bds
|
2
ba
|
1,800
sqft
|
built
1976
3024 W Dixie Blvd, Fort Pierce, FL 34946
$-1,731
Cash flow
-14.6%
Cash-on-Cash Return
2.8%
Cap rate
0.4%
Rent to Value Ratio
Active
$430,000
3
bds
|
2
ba
|
1,504
sqft
|
built
1978
2400 S Ocean Dr, Fort Pierce, FL 34949
$-2,047
Cash flow
-24.8%
Cash-on-Cash Return
0.4%
Cap rate
0.7%
Rent to Value Ratio
Active
$305,000
3
bds
|
3
ba
|
1,508
sqft
|
built
1986
2002 N 31st St, Fort Pierce, FL 34947
$-285
Cash flow
-4.9%
Cash-on-Cash Return
5.0%
Cap rate
0.7%
Rent to Value Ratio
Active
$310,000
2
bds
|
2
ba
|
1,192
sqft
|
built
1975
2400 S Ocean Dr, Fort Pierce, FL 34949
$-1,120
Cash flow
-18.8%
Cash-on-Cash Return
1.8%
Cap rate
1.0%
Rent to Value Ratio
Active
$160,000
2
bds
|
1
ba
|
966
sqft
|
built
1953
2008 N 51st Ct, Fort Pierce, FL 34947
$168
Cash flow
5.5%
Cash-on-Cash Return
7.4%
Cap rate
1.1%
Rent to Value Ratio
Active
$430,000
2
bds
|
2
ba
|
2,427
sqft
|
built
1998
9422 Poinciana Ct, Fort Pierce, FL 34951
$-592
Cash flow
-7.2%
Cash-on-Cash Return
4.5%
Cap rate
0.7%
Rent to Value Ratio
Active
$209,900
2
bds
|
3
ba
|
1,629
sqft
|
built
1985
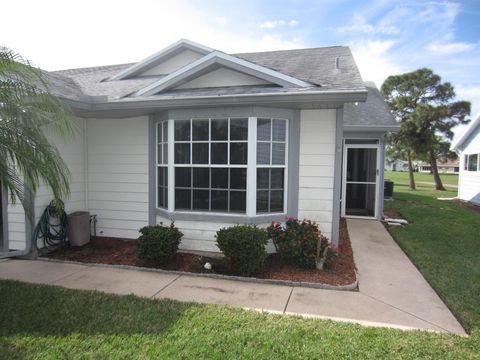
2989 Bent Pine Dr, Fort Pierce, FL 34951
$-104
Cash flow
-2.6%
Cash-on-Cash Return
5.6%
Cap rate
1.2%
Rent to Value Ratio
Active
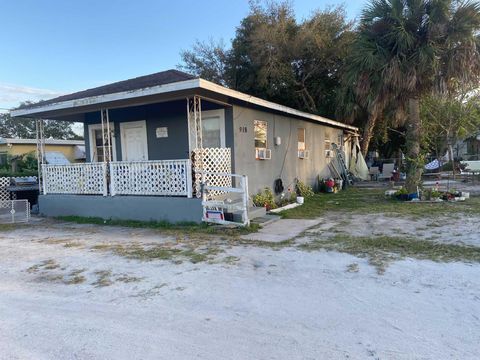
$199,999
2
bds
|
0
ba
|
1,096
sqft
|
built
1947
918 N 10th St, Fort Pierce, FL 34950
$-617
Cash flow
-16.1%
Cash-on-Cash Return
2.4%
Cap rate
0.4%
Rent to Value Ratio
Active
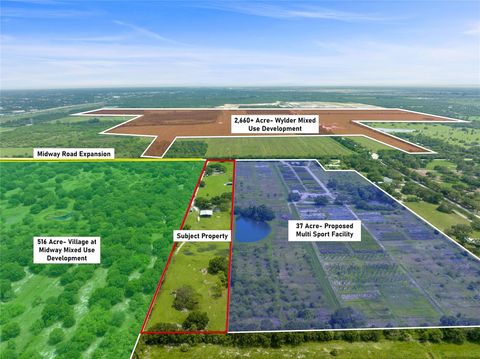
$1,699,000
3
bds
|
2
ba
|
2,498
sqft
|
built
1976
10100 W Midway Rd, Fort Pierce, FL 34945
$-5,728
Cash flow
-17.6%
Cash-on-Cash Return
2.1%
Cap rate
0.3%
Rent to Value Ratio
Active
$600,000
2
bds
|
2
ba
|
1,805
sqft
|
built
1981
2400 S Ocean Dr, Fort Pierce, FL 34949
$-2,665
Cash flow
-23.2%
Cash-on-Cash Return
0.8%
Cap rate
0.6%
Rent to Value Ratio
Active
$449,900
3
bds
|
2
ba
|
2,100
sqft
|
built
1990
600 Gopher Hill Rd, Fort Pierce, FL 34982
$-530
Cash flow
-6.1%
Cash-on-Cash Return
4.7%
Cap rate
0.6%
Rent to Value Ratio
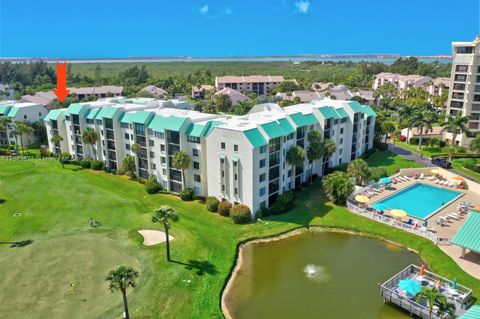
Active
$465,000
2
bds
|
2
ba
|
1,989
sqft
|
built
2005
10 Harbour Isle Dr E, Fort Pierce, FL 34949
$-2,028
Cash flow
-22.8%
Cash-on-Cash Return
0.9%
Cap rate
0.5%
Rent to Value Ratio
Active
$179,000
2
bds
|
2
ba
|
1,005
sqft
|
built
1991
2828 Stoneway Ln, Fort Pierce, FL 34982
$-246
Cash flow
-7.2%
Cash-on-Cash Return
4.5%
Cap rate
1.0%
Rent to Value Ratio
Active
$524,900
5
bds
|
3
ba
|
2,072
sqft
|
built
2019
5713 Myrtle Dr, Fort Pierce, FL 34982
$-772
Cash flow
-7.7%
Cash-on-Cash Return
4.4%
Cap rate
0.6%
Rent to Value Ratio
Active
$1,125,000
4
bds
|
3
ba
|
3,667
sqft
|
built
1981
5103 Palmetto Ave, Fort Pierce, FL 34982
$-1,591
Cash flow
-7.4%
Cash-on-Cash Return
4.5%
Cap rate
0.6%
Rent to Value Ratio
Active
$299,000
2
bds
|
2
ba
|
1,184
sqft
|
built
1980
2400 S Ocean Dr, Fort Pierce, FL 34949
$-1,580
Cash flow
-27.6%
Cash-on-Cash Return
-0.2%
Cap rate
0.8%
Rent to Value Ratio
Active
$425,000
3
bds
|
0
ba
|
1,688
sqft
|
built
1936
201 N 17th St, Fort Pierce, FL 34950
$-1,516
Cash flow
-18.6%
Cash-on-Cash Return
1.9%
Cap rate
0.4%
Rent to Value Ratio
Active
$1,099,900
2
bds
|
2
ba
|
1,499
sqft
|
built
2001
6807 S Indian River Dr, Fort Pierce, FL 34982
$-3,267
Cash flow
-15.5%
Cash-on-Cash Return
2.6%
Cap rate
0.4%
Rent to Value Ratio
Active
$289,999
3
bds
|
2
ba
|
1,244
sqft
|
built
1960
1013 Hispana Ave, Fort Pierce, FL 34982
$-164
Cash flow
-3.0%
Cash-on-Cash Return
5.5%
Cap rate
0.9%
Rent to Value Ratio
Active
$613,700
5
bds
|
3
ba
|
2,956
sqft
|
built
1977
2622 Newport Dr, Fort Pierce, FL 34982
$-1,454
Cash flow
-12.4%
Cash-on-Cash Return
3.3%
Cap rate
0.5%
Rent to Value Ratio
Active
$249,000
2
bds
|
1
ba
|
993
sqft
|
built
1954
2404 Florida Ave, Fort Pierce, FL 34950
$-196
Cash flow
-4.1%
Cash-on-Cash Return
5.2%
Cap rate
0.7%
Rent to Value Ratio

Active
$309,000
3
bds
|
3
ba
|
1,705
sqft
|
built
2008
9312 Natures Way, Fort Pierce, FL 34945
$-738
Cash flow
-12.5%
Cash-on-Cash Return
3.3%
Cap rate
0.6%
Rent to Value Ratio
Active
$450,000
2
bds
|
0
ba
|
1,536
sqft
|
built
1953
808 N 17th St, Fort Pierce, FL 34950
$-1,557
Cash flow
-18.1%
Cash-on-Cash Return
2.0%
Cap rate
0.4%
Rent to Value Ratio
Active
$410,000
2
bds
|
2
ba
|
1,184
sqft
|
built
1978
2400 S Ocean Dr, Fort Pierce, FL 34949
$-2,087
Cash flow
-26.6%
Cash-on-Cash Return
0.0%
Cap rate
0.6%
Rent to Value Ratio
Active
$134,900
2
bds
|
3
ba
|
1,120
sqft
|
built
1982
2019 Oleander Blvd, Fort Pierce, FL 34950
$-313
Cash flow
-12.1%
Cash-on-Cash Return
3.4%
Cap rate
1.2%
Rent to Value Ratio
Active
$415,000
2
bds
|
0
ba
|
1,830
sqft
|
built
1981
809 E Weatherbee Rd, Fort Pierce, FL 34982
$-1,232
Cash flow
-15.5%
Cash-on-Cash Return
2.6%
Cap rate
0.4%
Rent to Value Ratio
Active
$160,000
2
bds
|
2
ba
|
1,416
sqft
|
built
1989
3351 Twin Lakes Ter, Fort Pierce, FL 34951
$-673
Cash flow
-21.9%
Cash-on-Cash Return
1.1%
Cap rate
1.4%
Rent to Value Ratio
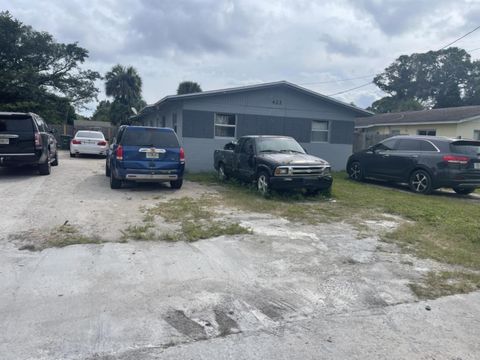
Active
$325,000
2
bds
|
0
ba
|
1,550
sqft
|
built
1971
422 N 18th St, Fort Pierce, FL 34950
$-1,043
Cash flow
-16.7%
Cash-on-Cash Return
2.3%
Cap rate
0.4%
Rent to Value Ratio
Active
$549,500
2
bds
|
3
ba
|
2,201
sqft
|
built
2003
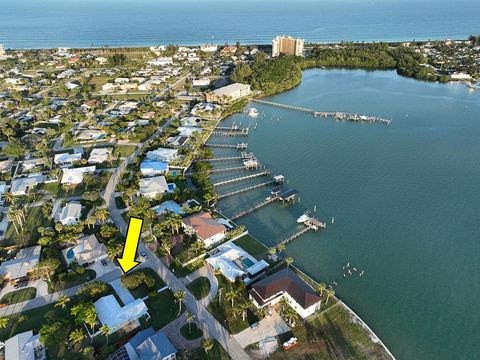
1907 Mariner Bay Blvd, Fort Pierce, FL 34949
$-1,812
Cash flow
-17.2%
Cash-on-Cash Return
2.2%
Cap rate
0.7%
Rent to Value Ratio
Active
$218,900
3
bds
|
2
ba
|
1,140
sqft
|
built
1957
2307 Elizabeth Ave, Fort Pierce, FL 34982
$87
Cash flow
2.1%
Cash-on-Cash Return
6.6%
Cap rate
0.8%
Rent to Value Ratio
Active
$594,999
3
bds
|
2
ba
|
1,606
sqft
|
built
1967
1630 Thumb Point Dr, Fort Pierce, FL 34949
$-1,082
Cash flow
-9.5%
Cash-on-Cash Return
4.0%
Cap rate
0.7%
Rent to Value Ratio
Active
$269,900
2
bds
|
2
ba
|
1,363
sqft
|
built
1991
4045 Gator Trace Rd, Fort Pierce, FL 34982
$-1,025
Cash flow
-19.8%
Cash-on-Cash Return
1.6%
Cap rate
0.7%
Rent to Value Ratio

Active
$265,000
2
bds
|
2
ba
|
1,417
sqft
|
built
1989
3200 Twin Lakes Ter, Fort Pierce, FL 34951
$-871
Cash flow
-17.1%
Cash-on-Cash Return
2.2%
Cap rate
0.8%
Rent to Value Ratio