Framingham, MA Investment Properties for Sale
Browse homes for sale and investment properties in Framingham, MA. Refine your search by price, property type, or more.
Best cash flowing properties in Framingham, MA

Active
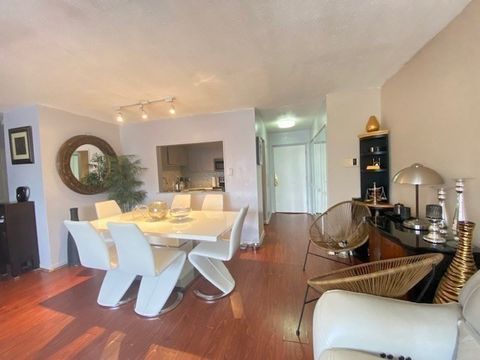
$239,000
1
bds
|
1
ba
|
578
sqft
|
built
1968
11 Weld St, Framingham, MA 01702
$-63
Cash flow
-1.4%
Cash-on-Cash Return
5.4%
Cap rate
0.8%
Rent to Value Ratio

Active
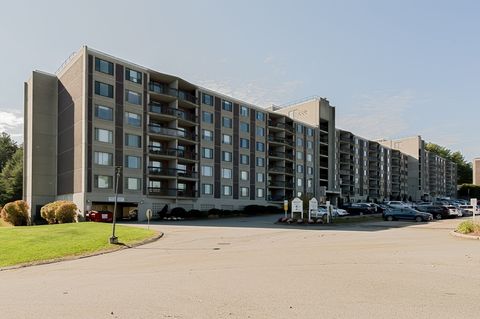
$300,000
1
bds
|
1
ba
|
684
sqft
|
built
1970
137 Winthrop St, Framingham, MA 01702
$-246
Cash flow
-4.3%
Cash-on-Cash Return
4.7%
Cap rate
0.7%
Rent to Value Ratio
13 out of 19 properties for sale in Framingham, MA
Limited Results Shown
Create a free account, or log in to reveal all property listings and enjoy the complete experience.

Active
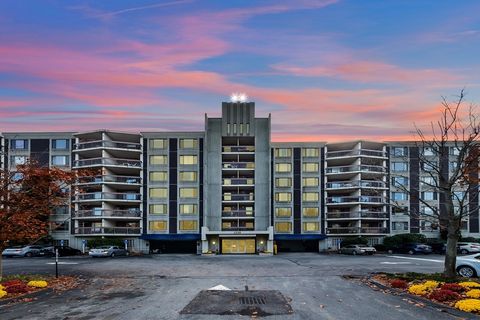
$295,000
1
bds
|
1
ba
|
760
sqft
|
built
1967
1321 Worcester Rd, Framingham, MA 01701
$-794
Cash flow
-14.0%
Cash-on-Cash Return
2.4%
Cap rate
0.7%
Rent to Value Ratio

Active
$289,900
1
bds
|
1
ba
|
665
sqft
|
built
1969
915 Edgell Rd, Framingham, MA 01701
$-466
Cash flow
-8.4%
Cash-on-Cash Return
3.8%
Cap rate
0.7%
Rent to Value Ratio

Active
$409,000
2
bds
|
2
ba
|
1,353
sqft
|
built
1974
1550 Worcester Rd, Framingham, MA 01702
$-1,018
Cash flow
-13.0%
Cash-on-Cash Return
2.7%
Cap rate
0.7%
Rent to Value Ratio

Active
$229,999
1
bds
|
1
ba
|
660
sqft
|
built
1968
9 Weld St, Framingham, MA 01702
$-347
Cash flow
-7.9%
Cash-on-Cash Return
3.9%
Cap rate
0.9%
Rent to Value Ratio
Active
$318,900
2
bds
|
1
ba
|
864
sqft
|
built
1968
7 Weld St, Framingham, MA 01702
$-520
Cash flow
-8.5%
Cash-on-Cash Return
3.7%
Cap rate
0.8%
Rent to Value Ratio

Active
$264,000
1
bds
|
1
ba
|
630
sqft
|
built
1969
1186 Worcester Rd, Framingham, MA 01702
$-467
Cash flow
-9.2%
Cash-on-Cash Return
3.6%
Cap rate
0.8%
Rent to Value Ratio
Active
$300,000
1
bds
|
1
ba
|
684
sqft
|
built
1970
137 Winthrop St, Framingham, MA 01702
$-246
Cash flow
-4.3%
Cash-on-Cash Return
4.7%
Cap rate
0.7%
Rent to Value Ratio

Active
$324,000
2
bds
|
1
ba
|
756
sqft
|
built
1964
77 Nicholas Rd, Framingham, MA 01701
$-670
Cash flow
-10.8%
Cash-on-Cash Return
3.2%
Cap rate
0.7%
Rent to Value Ratio

Active
$419,000
2
bds
|
2
ba
|
1,353
sqft
|
built
1974
1550 Worcester Rd, Framingham, MA 01702
$-1,105
Cash flow
-13.8%
Cash-on-Cash Return
2.5%
Cap rate
0.7%
Rent to Value Ratio
Active
$399,999
2
bds
|
2
ba
|
1,295
sqft
|
built
1966
1500 Worcester Rd, Framingham, MA 01702
$-1,101
Cash flow
-14.4%
Cash-on-Cash Return
2.4%
Cap rate
0.7%
Rent to Value Ratio
Active
$499,900
3
bds
|
2
ba
|
1,767
sqft
|
built
1974
1550 Worcester Rd, Framingham, MA 01702
$-1,430
Cash flow
-14.9%
Cash-on-Cash Return
2.2%
Cap rate
0.6%
Rent to Value Ratio
Active
$239,000
1
bds
|
1
ba
|
578
sqft
|
built
1968
11 Weld St, Framingham, MA 01702
$-63
Cash flow
-1.4%
Cash-on-Cash Return
5.4%
Cap rate
0.8%
Rent to Value Ratio

Active
$199,900
1
bds
|
1
ba
|
330
sqft
|
built
1970
131 Mellen St, Framingham, MA 01702
$-287
Cash flow
-7.5%
Cash-on-Cash Return
4.0%
Cap rate
0.7%
Rent to Value Ratio