Framingham, MA Investment Properties for Sale
Browse homes for sale and investment properties in Framingham, MA. Refine your search by price, property type, or more.
Best cash flowing properties in Framingham, MA

Active
$199,900
1
bds
|
1
ba
|
330
sqft
|
built
1970
131 Mellen St, Framingham, MA 01702
$-385
Cash flow
-10.0%
Cash-on-Cash Return
4.0%
Cap rate
0.7%
Rent to Value Ratio
Active
$399,999
2
bds
|
2
ba
|
1,295
sqft
|
built
1966
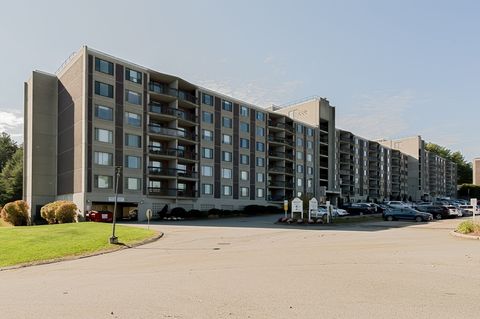
1500 Worcester Rd, Framingham, MA 01702
$-1,296
Cash flow
-16.9%
Cash-on-Cash Return
2.4%
Cap rate
0.7%
Rent to Value Ratio
57 out of 69 properties for sale in Framingham, MA
Limited Results Shown
Create a free account, or log in to reveal all property listings and enjoy the complete experience.

Active
$1,275,000
5
bds
|
4
ba
|
4,792
sqft
|
built
1942
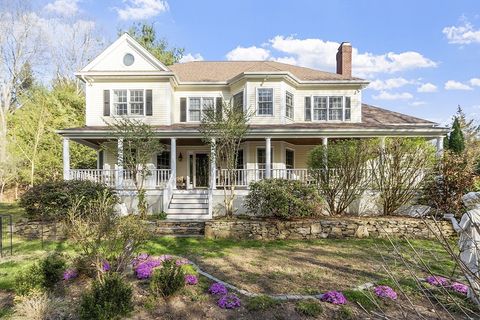
641 Grove St, Framingham, MA 01701
$-3,681
Cash flow
-15.1%
Cash-on-Cash Return
2.8%
Cap rate
0.4%
Rent to Value Ratio
Pending
$689,000
3
bds
|
2
ba
|
1,408
sqft
|
built
1928
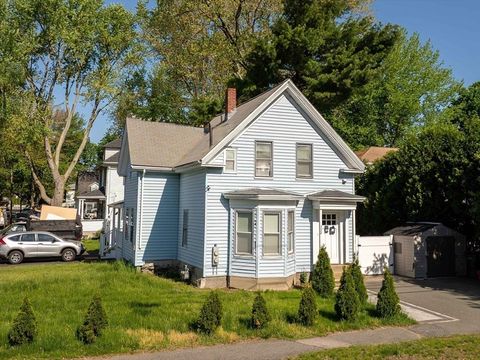
352 Bishop St, Framingham, MA 01702
$-2,173
Cash flow
-16.5%
Cash-on-Cash Return
2.5%
Cap rate
0.4%
Rent to Value Ratio
Active
$399,999
2
bds
|
2
ba
|
1,295
sqft
|
built
1966
1500 Worcester Rd, Framingham, MA 01702
$-1,296
Cash flow
-16.9%
Cash-on-Cash Return
2.4%
Cap rate
0.7%
Rent to Value Ratio
Active
$899,000
4
bds
|
3
ba
|
2,688
sqft
|
built
1979
733 Salem End Rd, Framingham, MA 01702
$-2,403
Cash flow
-13.9%
Cash-on-Cash Return
3.1%
Cap rate
0.5%
Rent to Value Ratio
Active
$1,390,000
6
bds
|
5
ba
|
5,500
sqft
|
built
1998
208 Millwood St, Framingham, MA 01701
$-3,865
Cash flow
-14.5%
Cash-on-Cash Return
2.9%
Cap rate
0.5%
Rent to Value Ratio
Active
$630,000
3
bds
|
1
ba
|
1,554
sqft
|
built
1924
15 Bates Rd, Framingham, MA 01702
$-1,311
Cash flow
-10.9%
Cash-on-Cash Return
3.8%
Cap rate
0.6%
Rent to Value Ratio

Active
$859,000
4
bds
|
4
ba
|
3,124
sqft
|
built
1962
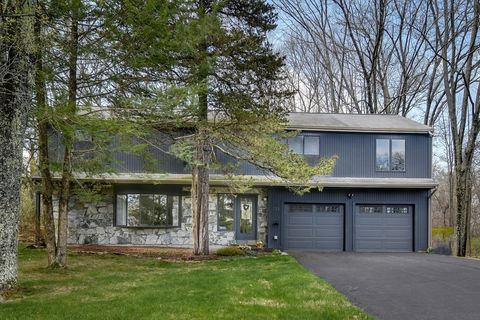
45 Roundtop Rd, Framingham, MA 01701
$-2,082
Cash flow
-12.6%
Cash-on-Cash Return
3.4%
Cap rate
0.5%
Rent to Value Ratio

Active
$599,900
3
bds
|
2
ba
|
1,404
sqft
|
built
1966
16 Birch Rd, Framingham, MA 01701
$-1,438
Cash flow
-12.5%
Cash-on-Cash Return
3.4%
Cap rate
0.5%
Rent to Value Ratio

Active
$949,000
6
bds
|
3
ba
|
2,382
sqft
|
built
1937
18 Auburn St, Framingham, MA 01701
$-2,235
Cash flow
-12.3%
Cash-on-Cash Return
3.4%
Cap rate
0.5%
Rent to Value Ratio

Active
$999,999
6
bds
|
4
ba
|
2,540
sqft
|
built
1980
1 Barbieri Rd, Framingham, MA 01702
$-3,422
Cash flow
-17.9%
Cash-on-Cash Return
2.2%
Cap rate
0.4%
Rent to Value Ratio

Active
$699,900
3
bds
|
2
ba
|
1,415
sqft
|
built
1918
194 Beacon St, Framingham, MA 01701
$-1,814
Cash flow
-13.5%
Cash-on-Cash Return
3.2%
Cap rate
0.5%
Rent to Value Ratio

Active under contract
$699,999
3
bds
|
3
ba
|
1,604
sqft
|
built
1927
1206 Concord St, Framingham, MA 01701
$-1,495
Cash flow
-11.1%
Cash-on-Cash Return
3.7%
Cap rate
0.6%
Rent to Value Ratio
Active
$499,900
3
bds
|
2
ba
|
1,767
sqft
|
built
1974
1550 Worcester Rd, Framingham, MA 01702
$-1,674
Cash flow
-17.5%
Cash-on-Cash Return
2.2%
Cap rate
0.6%
Rent to Value Ratio
Active
$959,900
4
bds
|
3
ba
|
2,394
sqft
|
built
1979
34 Parker Rd, Framingham, MA 01702
$-2,610
Cash flow
-14.2%
Cash-on-Cash Return
3.0%
Cap rate
0.5%
Rent to Value Ratio

Active
$3,649,000
6
bds
|
6
ba
|
11,643
sqft
|
built
1999
6 Mountain View Dr, Framingham, MA 01701
$-16,914
Cash flow
-24.2%
Cash-on-Cash Return
0.7%
Cap rate
0.2%
Rent to Value Ratio
Active
$199,900
1
bds
|
1
ba
|
330
sqft
|
built
1970
131 Mellen St, Framingham, MA 01702
$-385
Cash flow
-10.0%
Cash-on-Cash Return
4.0%
Cap rate
0.7%
Rent to Value Ratio

Active
$645,900
3
bds
|
2
ba
|
1,680
sqft
|
built
1960
14 Eisenhower Rd, Framingham, MA 01701
$-1,561
Cash flow
-12.6%
Cash-on-Cash Return
3.4%
Cap rate
0.5%
Rent to Value Ratio