Garfield Heights, OH Investment Properties for Sale
Browse homes for sale and investment properties in Garfield Heights, OH. Refine your search by price, property type, or more.
Best cash flowing properties in Garfield Heights, OH
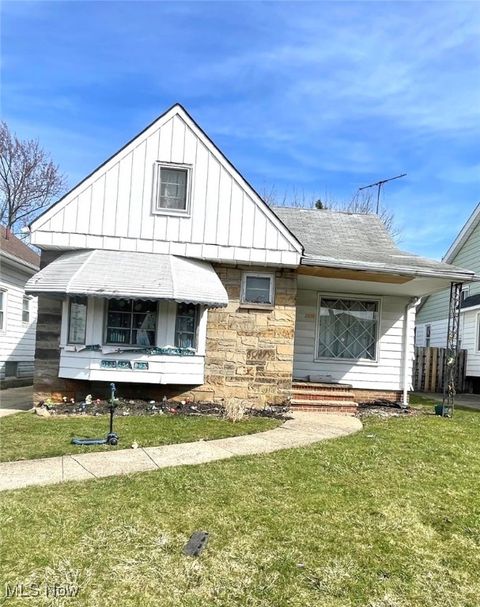
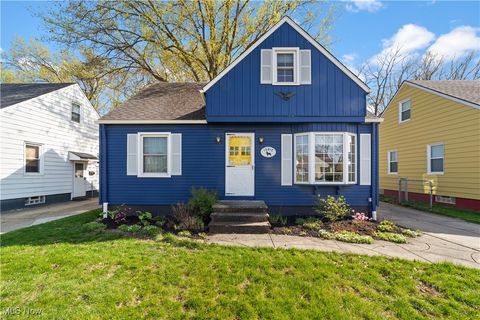
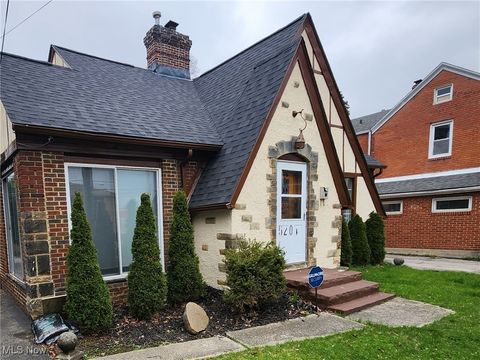
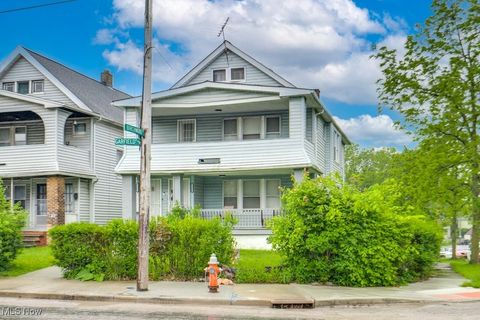
Active
$120,000
2
bds
|
2
ba
|
0
sqft
|
built
1945
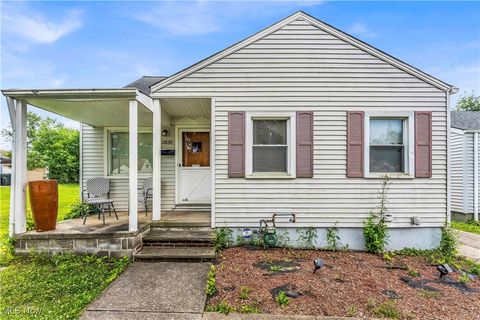
4815 E 86th St, Garfield Heights, OH 44125
$307
Cash flow
13.3%
Cash-on-Cash Return
9.3%
Cap rate
1.3%
Rent to Value Ratio
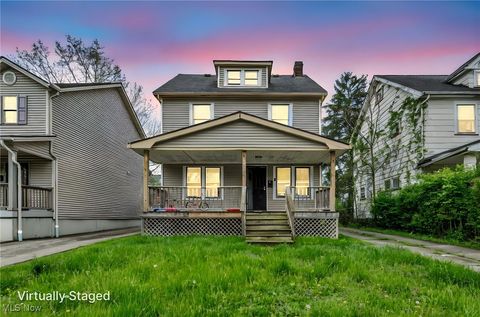
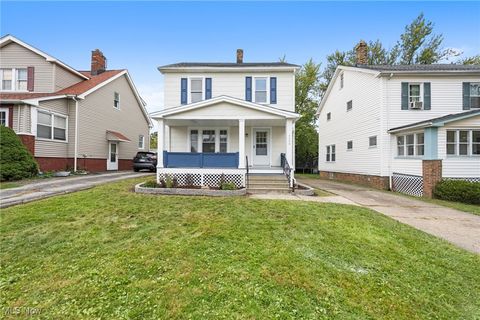
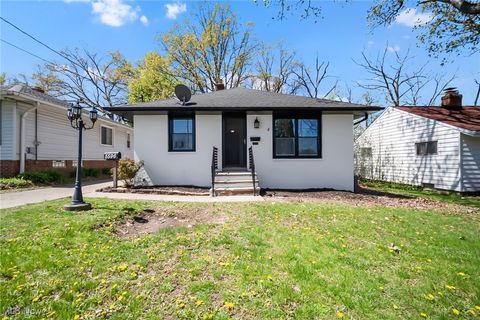
Active
$120,000
3
bds
|
1
ba
|
1,337
sqft
|
built
1924
13710 Cranwood Dr, Garfield Heights, OH 44105
$223
Cash flow
9.7%
Cash-on-Cash Return
8.5%
Cap rate
1.2%
Rent to Value Ratio
26 out of 53 properties for sale in Garfield Heights, OH
Limited Results Shown
Create a free account, or log in to reveal all property listings and enjoy the complete experience.
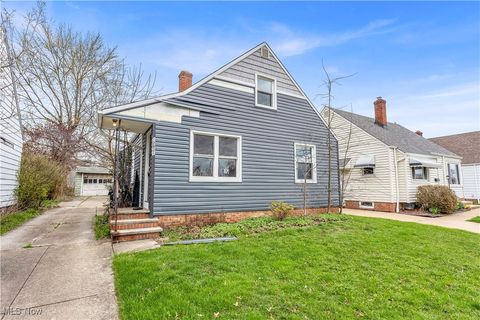
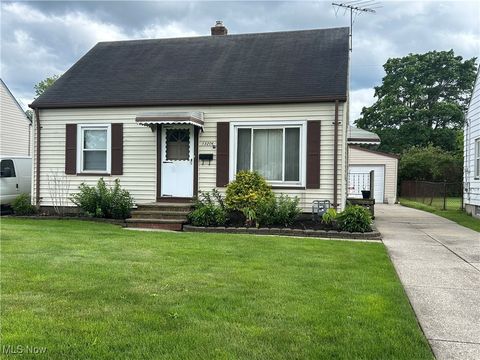
Active
$115,000
3
bds
|
1
ba
|
1,044
sqft
|
built
1948
12821 Oak Park Blvd, Garfield Heights, OH 44125
$18
Cash flow
0.8%
Cash-on-Cash Return
6.4%
Cap rate
1.2%
Rent to Value Ratio

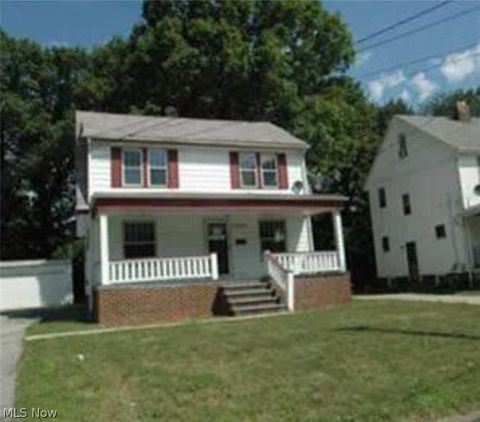
Active
$159,900
4
bds
|
1
ba
|
1,170
sqft
|
built
1955
13611 Shady Oak Blvd, Garfield Heights, OH 44125
$-221
Cash flow
-7.2%
Cash-on-Cash Return
4.6%
Cap rate
0.9%
Rent to Value Ratio
Active
$150,000
3
bds
|
2
ba
|
0
sqft
|
built
1928
13205 Cranwood Park Blvd, Garfield Heights, OH 44125
$-125
Cash flow
-4.3%
Cash-on-Cash Return
5.3%
Cap rate
0.9%
Rent to Value Ratio
Active
$140,000
3
bds
|
1
ba
|
1,170
sqft
|
built
1953
13812 York Blvd, Garfield Heights, OH 44125
$-90
Cash flow
-3.4%
Cash-on-Cash Return
5.5%
Cap rate
1.0%
Rent to Value Ratio

Active
$138,900
4
bds
|
1
ba
|
0
sqft
|
built
1955
13681 Shady Oak Blvd, Garfield Heights, OH 44125
$-58
Cash flow
-2.2%
Cash-on-Cash Return
5.8%
Cap rate
1.1%
Rent to Value Ratio
Active
$129,900
3
bds
|
2
ba
|
1,393
sqft
|
built
1952
6033 E 135th St, Garfield Heights, OH 44125
$44
Cash flow
1.8%
Cash-on-Cash Return
6.1%
Cap rate
1.1%
Rent to Value Ratio
Active
$134,900
3
bds
|
1
ba
|
1,296
sqft
|
built
1921
9604 Park Heights Ave, Garfield Heights, OH 44125
$-54
Cash flow
-2.1%
Cash-on-Cash Return
5.8%
Cap rate
1.0%
Rent to Value Ratio

Active
$110,000
3
bds
|
1
ba
|
1,397
sqft
|
built
1922
12704 Rexwood Ave, Garfield Heights, OH 44105
$154
Cash flow
7.3%
Cash-on-Cash Return
7.9%
Cap rate
1.3%
Rent to Value Ratio
Active
$149,000
3
bds
|
1
ba
|
1,080
sqft
|
built
1949
13206 Shady Oak Blvd, Garfield Heights, OH 44125
$-73
Cash flow
-2.6%
Cash-on-Cash Return
5.7%
Cap rate
0.9%
Rent to Value Ratio
Active
$170,000
4
bds
|
3
ba
|
0
sqft
|
built
1928
5204 Turney Rd, Garfield Heights, OH 44125
$-598
Cash flow
-18.4%
Cash-on-Cash Return
2.0%
Cap rate
0.9%
Rent to Value Ratio

Active
$195,000
3
bds
|
2
ba
|
1,700
sqft
|
built
1957
13621 Oak Park Blvd, Garfield Heights, OH 44125
$-284
Cash flow
-7.6%
Cash-on-Cash Return
4.5%
Cap rate
0.8%
Rent to Value Ratio
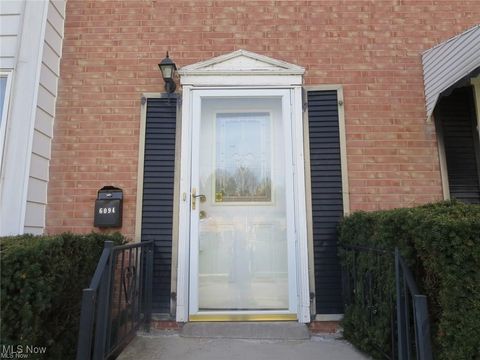
Active
$104,900
3
bds
|
2
ba
|
1,280
sqft
|
built
1967
6094 Andover Blvd, Garfield Heights, OH 44125
$121
Cash flow
6.0%
Cash-on-Cash Return
7.7%
Cap rate
1.5%
Rent to Value Ratio
Active
$139,900
3
bds
|
1
ba
|
1,170
sqft
|
built
1955
12805 Oakview Blvd, Garfield Heights, OH 44125
$66
Cash flow
2.5%
Cash-on-Cash Return
6.8%
Cap rate
1.0%
Rent to Value Ratio
Active
$165,000
3
bds
|
2
ba
|
1,176
sqft
|
built
1949
12704 Oak Park Blvd, Garfield Heights, OH 44125
$-169
Cash flow
-5.3%
Cash-on-Cash Return
5.0%
Cap rate
0.8%
Rent to Value Ratio
Active
$130,000
3
bds
|
1
ba
|
1,104
sqft
|
built
1953
12830 Park Knoll Dr, Garfield Heights, OH 44125
$-50
Cash flow
-2.0%
Cash-on-Cash Return
5.2%
Cap rate
1.0%
Rent to Value Ratio
Active
$145,000
3
bds
|
2
ba
|
0
sqft
|
built
1944
13307 Thraves Ave, Garfield Heights, OH 44125
$11
Cash flow
0.4%
Cash-on-Cash Return
6.4%
Cap rate
1.1%
Rent to Value Ratio
Active
$238,900
4
bds
|
2
ba
|
0
sqft
|
built
1900
10501 Park Heights Ave, Garfield Heights, OH 44125
$-945
Cash flow
-20.6%
Cash-on-Cash Return
1.5%
Cap rate
0.5%
Rent to Value Ratio

Active
$139,000
3
bds
|
1
ba
|
0
sqft
|
built
1950
13401 Havana Rd, Garfield Heights, OH 44125
$-91
Cash flow
-3.4%
Cash-on-Cash Return
5.5%
Cap rate
1.0%
Rent to Value Ratio

Active
$174,900
3
bds
|
2
ba
|
2,330
sqft
|
built
1955
13616 Woodward Blvd, Garfield Heights, OH 44125
$-170
Cash flow
-5.1%
Cash-on-Cash Return
5.1%
Cap rate
0.9%
Rent to Value Ratio
Active
$159,900
3
bds
|
3
ba
|
1,920
sqft
|
built
1922
10201 Greenview Ave, Garfield Heights, OH 44125
$-182
Cash flow
-5.9%
Cash-on-Cash Return
4.9%
Cap rate
0.9%
Rent to Value Ratio
Active
$200,000
4
bds
|
2
ba
|
0
sqft
|
built
1924
8304 Garfield Blvd, Garfield Heights, OH 44125
$-458
Cash flow
-11.9%
Cash-on-Cash Return
3.5%
Cap rate
0.8%
Rent to Value Ratio
Active
$185,000
4
bds
|
2
ba
|
1,527
sqft
|
built
1958
5596 Cumberland Dr, Garfield Heights, OH 44125
$-436
Cash flow
-12.3%
Cash-on-Cash Return
3.4%
Cap rate
0.7%
Rent to Value Ratio

Active
$138,000
5
bds
|
2
ba
|
0
sqft
|
built
1927
10116 Richland Ave, Garfield Heights, OH 44125
$112
Cash flow
4.2%
Cash-on-Cash Return
7.2%
Cap rate
1.2%
Rent to Value Ratio

Active
$169,900
3
bds
|
1
ba
|
1,716
sqft
|
built
1956
12916 Silver Rd, Garfield Heights, OH 44125
$-185
Cash flow
-5.7%
Cash-on-Cash Return
5.0%
Cap rate
0.8%
Rent to Value Ratio