Henderson, NV Investment Properties for Sale
Browse homes for sale and investment properties in Henderson, NV. Refine your search by price, property type, or more.
Best cash flowing properties in Henderson, NV
Active
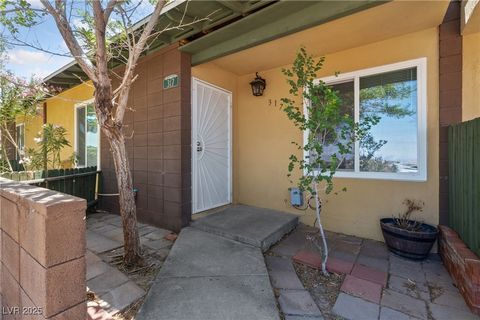
$169,000
2
bds
|
1
ba
|
762
sqft
|
built
1971
317 E Van Wagenen St, Henderson, NV 89015
$-370
Cash flow
-11.4%
Cash-on-Cash Return
3.6%
Cap rate
0.8%
Rent to Value Ratio

Active
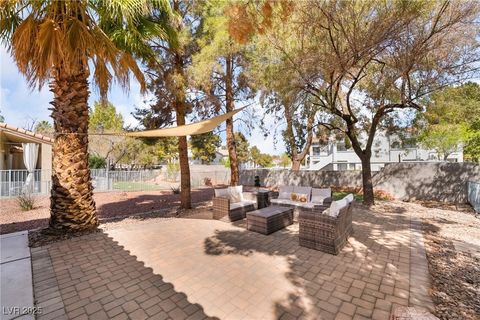
$349,000
3
bds
|
2
ba
|
1,084
sqft
|
built
1982
528 Close Ave, Henderson, NV 89011
$-643
Cash flow
-9.6%
Cash-on-Cash Return
4.1%
Cap rate
0.5%
Rent to Value Ratio
1,162 out of 1,464 properties for sale in Henderson, NV
Limited Results Shown
Create a free account, or log in to reveal all property listings and enjoy the complete experience.
Active
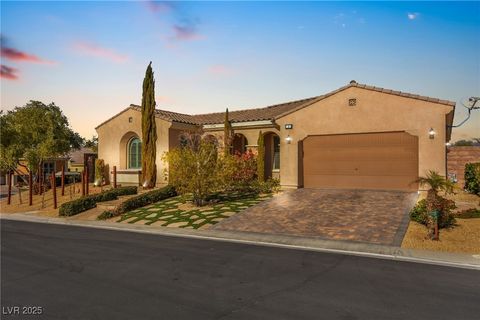
$419,000
2
bds
|
3
ba
|
1,811
sqft
|
built
1997
2246 Cassatt Dr, Henderson, NV 89074
$-1,472
Cash flow
-18.3%
Cash-on-Cash Return
2.0%
Cap rate
0.5%
Rent to Value Ratio

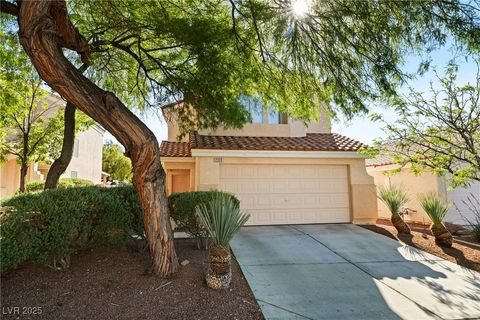
Active
$712,000
5
bds
|
3
ba
|
2,978
sqft
|
built
2016
1699 Sonoran Bluff Ave, Henderson, NV 89014
$-2,154
Cash flow
-15.8%
Cash-on-Cash Return
2.6%
Cap rate
0.4%
Rent to Value Ratio

Active
$589,000
3
bds
|
2
ba
|
1,693
sqft
|
built
1994
906 Sitting Bull Dr, Henderson, NV 89014
$-1,745
Cash flow
-15.5%
Cash-on-Cash Return
2.7%
Cap rate
0.4%
Rent to Value Ratio

Active
$530,000
4
bds
|
2
ba
|
1,933
sqft
|
built
1997
1552 Livingston Dr, Henderson, NV 89012
$-1,397
Cash flow
-13.8%
Cash-on-Cash Return
3.1%
Cap rate
0.4%
Rent to Value Ratio
Active
$799,900
3
bds
|
3
ba
|
2,639
sqft
|
built
2014
2 Lago Turchino Ct, Henderson, NV 89011
$-2,404
Cash flow
-15.7%
Cash-on-Cash Return
2.7%
Cap rate
0.4%
Rent to Value Ratio

Active
$639,999
3
bds
|
2
ba
|
2,279
sqft
|
built
1997
240 Jumping Springs Pl, Henderson, NV 89012
$-1,778
Cash flow
-14.5%
Cash-on-Cash Return
2.9%
Cap rate
0.4%
Rent to Value Ratio

Active
$449,900
3
bds
|
3
ba
|
1,576
sqft
|
built
1989
2501 Muirfield Ave, Henderson, NV 89074
$-1,154
Cash flow
-13.4%
Cash-on-Cash Return
3.2%
Cap rate
0.4%
Rent to Value Ratio

Active
$690,000
4
bds
|
2
ba
|
2,119
sqft
|
built
2005
1044 Spanish Needle St, Henderson, NV 89002
$-1,937
Cash flow
-14.6%
Cash-on-Cash Return
2.9%
Cap rate
0.4%
Rent to Value Ratio
Active
$349,000
3
bds
|
2
ba
|
1,084
sqft
|
built
1982
528 Close Ave, Henderson, NV 89011
$-643
Cash flow
-9.6%
Cash-on-Cash Return
4.1%
Cap rate
0.5%
Rent to Value Ratio

Active
$799,900
4
bds
|
3
ba
|
2,973
sqft
|
built
1974
200 E Desert Rose Dr, Henderson, NV 89015
$-1,867
Cash flow
-12.2%
Cash-on-Cash Return
3.5%
Cap rate
0.5%
Rent to Value Ratio
Active
$495,000
3
bds
|
3
ba
|
1,687
sqft
|
built
2001
2333 Silver Crew Pass, Henderson, NV 89052
$-1,319
Cash flow
-13.9%
Cash-on-Cash Return
3.1%
Cap rate
0.4%
Rent to Value Ratio

Active
$409,900
4
bds
|
2
ba
|
1,584
sqft
|
built
1981
3115 Blossom Glen Dr, Henderson, NV 89014
$-913
Cash flow
-11.6%
Cash-on-Cash Return
3.6%
Cap rate
0.5%
Rent to Value Ratio

Active
$499,500
3
bds
|
3
ba
|
1,987
sqft
|
built
2014
931 Via Del Campo, Henderson, NV 89011
$-1,114
Cash flow
-11.6%
Cash-on-Cash Return
3.6%
Cap rate
0.6%
Rent to Value Ratio
Active
$849,995
3
bds
|
4
ba
|
2,638
sqft
|
built
2018
13 Via Tiberina, Henderson, NV 89011
$-2,632
Cash flow
-16.2%
Cash-on-Cash Return
2.5%
Cap rate
0.4%
Rent to Value Ratio
Active
$529,900
3
bds
|
2
ba
|
1,544
sqft
|
built
2001
43 Pangloss St, Henderson, NV 89002
$-1,781
Cash flow
-17.5%
Cash-on-Cash Return
2.2%
Cap rate
0.3%
Rent to Value Ratio
Active
$519,000
3
bds
|
2
ba
|
1,546
sqft
|
built
1997
2455 Silver Blossom Ln, Henderson, NV 89052
$-1,554
Cash flow
-15.6%
Cash-on-Cash Return
2.7%
Cap rate
0.4%
Rent to Value Ratio
Active
$169,000
2
bds
|
1
ba
|
762
sqft
|
built
1971
317 E Van Wagenen St, Henderson, NV 89015
$-370
Cash flow
-11.4%
Cash-on-Cash Return
3.6%
Cap rate
0.8%
Rent to Value Ratio

Active
$829,000
4
bds
|
4
ba
|
2,961
sqft
|
built
2003
75 Luce Del Sole, Henderson, NV 89011
$-2,672
Cash flow
-16.8%
Cash-on-Cash Return
2.4%
Cap rate
0.5%
Rent to Value Ratio
Active
$700,000
3
bds
|
3
ba
|
2,024
sqft
|
built
2018
9 Via Del Cielo, Henderson, NV 89011
$-2,406
Cash flow
-17.9%
Cash-on-Cash Return
2.1%
Cap rate
0.4%
Rent to Value Ratio

Active
$249,900
1
bds
|
2
ba
|
838
sqft
|
built
1985
513 Kristin Ln, Henderson, NV 89011
$-824
Cash flow
-17.2%
Cash-on-Cash Return
2.3%
Cap rate
0.4%
Rent to Value Ratio
Active
$1,248,888
4
bds
|
4
ba
|
3,963
sqft
|
built
1996
62 Incline Village Ct, Henderson, NV 89074
$-1,157
Cash flow
-4.8%
Cash-on-Cash Return
5.2%
Cap rate
0.7%
Rent to Value Ratio
Active
$465,000
3
bds
|
3
ba
|
1,935
sqft
|
built
2014
1012 Water Cove St, Henderson, NV 89011
$-1,236
Cash flow
-13.9%
Cash-on-Cash Return
3.1%
Cap rate
0.5%
Rent to Value Ratio
Active
$1,200,000
4
bds
|
4
ba
|
3,249
sqft
|
built
2003
9 Contra Costa Pl, Henderson, NV 89052
$-4,362
Cash flow
-19.0%
Cash-on-Cash Return
1.9%
Cap rate
0.3%
Rent to Value Ratio

Active
$429,900
3
bds
|
2
ba
|
1,081
sqft
|
built
1978
915 N Major Ave, Henderson, NV 89015
$-1,256
Cash flow
-15.2%
Cash-on-Cash Return
2.8%
Cap rate
0.3%
Rent to Value Ratio

Active
$585,000
3
bds
|
3
ba
|
2,501
sqft
|
built
2016
3159 Via Como, Henderson, NV 89044
$-1,685
Cash flow
-15.0%
Cash-on-Cash Return
2.8%
Cap rate
0.5%
Rent to Value Ratio

Active
$1,200,000
5
bds
|
3
ba
|
4,043
sqft
|
built
2003
3088 Via Flaminia Ct, Henderson, NV 89052
$-3,010
Cash flow
-13.1%
Cash-on-Cash Return
3.3%
Cap rate
0.5%
Rent to Value Ratio

Active
$494,900
3
bds
|
3
ba
|
1,783
sqft
|
built
2022
710 Bamboo Bend Pl, Henderson, NV 89011
$-1,444
Cash flow
-15.2%
Cash-on-Cash Return
2.8%
Cap rate
0.5%
Rent to Value Ratio

Active
$400,000
2
bds
|
2
ba
|
1,643
sqft
|
built
1986
146 Cascade Dr, Henderson, NV 89074
$-859
Cash flow
-11.2%
Cash-on-Cash Return
3.7%
Cap rate
0.5%
Rent to Value Ratio
Active
$1,799,000
5
bds
|
6
ba
|
4,805
sqft
|
built
2007
2820 Sisteron Ct, Henderson, NV 89044
$-5,123
Cash flow
-14.9%
Cash-on-Cash Return
2.8%
Cap rate
0.4%
Rent to Value Ratio

Active
$341,000
3
bds
|
3
ba
|
1,412
sqft
|
built
2005
1069 Thrill Ct, Henderson, NV 89002
$-838
Cash flow
-12.8%
Cash-on-Cash Return
3.3%
Cap rate
0.5%
Rent to Value Ratio
Active
$649,000
5
bds
|
3
ba
|
2,874
sqft
|
built
1994
2728 Aspen Wood Ave, Henderson, NV 89074
$-1,509
Cash flow
-12.1%
Cash-on-Cash Return
3.5%
Cap rate
0.5%
Rent to Value Ratio
Active
$565,000
3
bds
|
3
ba
|
2,048
sqft
|
built
2018
472 Cadence View Way, Henderson, NV 89011
$-1,644
Cash flow
-15.2%
Cash-on-Cash Return
2.8%
Cap rate
0.4%
Rent to Value Ratio
Active
$1,125,000
4
bds
|
5
ba
|
3,133
sqft
|
built
2021
28 Vista Outlook St, Henderson, NV 89011
$-2,853
Cash flow
-13.2%
Cash-on-Cash Return
3.2%
Cap rate
0.5%
Rent to Value Ratio

Active
$397,714
3
bds
|
3
ba
|
1,517
sqft
|
built
2022
734 Cottonwood Hill Pl, Henderson, NV 89011
$-1,041
Cash flow
-13.7%
Cash-on-Cash Return
3.1%
Cap rate
0.5%
Rent to Value Ratio

Active
$499,000
3
bds
|
2
ba
|
1,767
sqft
|
built
2003
71 Blaven Dr, Henderson, NV 89002
$-1,170
Cash flow
-12.2%
Cash-on-Cash Return
3.5%
Cap rate
0.5%
Rent to Value Ratio

Active
$515,000
3
bds
|
3
ba
|
1,947
sqft
|
built
2022
595 Beverly Pine Pl, Henderson, NV 89011
$-1,204
Cash flow
-12.2%
Cash-on-Cash Return
3.5%
Cap rate
0.5%
Rent to Value Ratio

Active
$3,500,000
4
bds
|
6
ba
|
6,127
sqft
|
built
1997
17 Grand Corniche Dr, Henderson, NV 89011
$-11,690
Cash flow
-17.4%
Cash-on-Cash Return
2.3%
Cap rate
0.3%
Rent to Value Ratio

Active
$398,888
4
bds
|
2
ba
|
1,436
sqft
|
built
1982
508 Van Dornum Ave, Henderson, NV 89011
$-796
Cash flow
-10.4%
Cash-on-Cash Return
3.9%
Cap rate
0.5%
Rent to Value Ratio
Active
$791,808
4
bds
|
3
ba
|
2,276
sqft
|
built
2022
3395 Sleeping Hills Ave, Henderson, NV 89044
$-2,390
Cash flow
-15.7%
Cash-on-Cash Return
2.6%
Cap rate
0.4%
Rent to Value Ratio
Active
$649,000
3
bds
|
3
ba
|
2,151
sqft
|
built
2020
782 Omaggio Pl, Henderson, NV 89011
$-2,121
Cash flow
-17.1%
Cash-on-Cash Return
2.3%
Cap rate
0.4%
Rent to Value Ratio