Henderson, NV Investment Properties for Sale
Browse homes for sale and investment properties in Henderson, NV. Refine your search by price, property type, or more.
Best cash flowing properties in Henderson, NV
Active
$240,000
4
bds
|
2
ba
|
1,376
sqft
|
built
1984
538 Kristin Ln, Henderson, NV 89011
$-460
Cash flow
-10.0%
Cash-on-Cash Return
4.0%
Cap rate
0.8%
Rent to Value Ratio

Active
$219,998
2
bds
|
2
ba
|
886
sqft
|
built
1994
601 Cabrillo Cir, Henderson, NV 89015
$-467
Cash flow
-11.1%
Cash-on-Cash Return
3.7%
Cap rate
0.6%
Rent to Value Ratio
1,358 out of 1,444 properties for sale in Henderson, NV
Limited Results Shown
Create a free account, or log in to reveal all property listings and enjoy the complete experience.
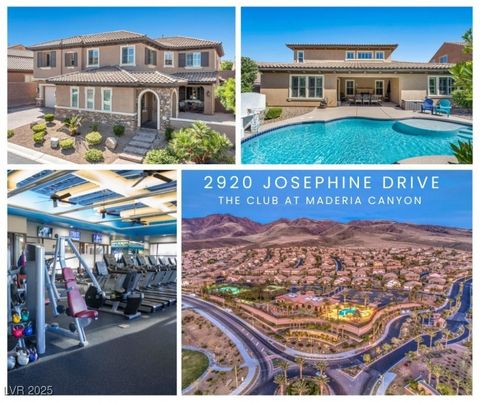
Active
$1,150,000
4
bds
|
4
ba
|
4,211
sqft
|
built
2013
2920 Josephine Dr, Henderson, NV 89044
$-2,937
Cash flow
-13.3%
Cash-on-Cash Return
3.2%
Cap rate
0.5%
Rent to Value Ratio
Active
$729,999
3
bds
|
4
ba
|
2,389
sqft
|
built
2006
1111 Casa Palermo Cir, Henderson, NV 89011
$-2,506
Cash flow
-17.9%
Cash-on-Cash Return
2.1%
Cap rate
0.4%
Rent to Value Ratio

Active
$520,000
4
bds
|
2
ba
|
2,023
sqft
|
built
1996
1128 Galangate Ave, Henderson, NV 89015
$-1,171
Cash flow
-11.7%
Cash-on-Cash Return
3.6%
Cap rate
0.5%
Rent to Value Ratio

Active
$750,000
6
bds
|
4
ba
|
4,374
sqft
|
built
2007
65 Pangloss St, Henderson, NV 89002
$-2,080
Cash flow
-14.5%
Cash-on-Cash Return
2.9%
Cap rate
0.5%
Rent to Value Ratio

Active
$2,350,000
5
bds
|
6
ba
|
5,695
sqft
|
built
2004
9 Chalet Hills Ter, Henderson, NV 89052
$-6,534
Cash flow
-14.5%
Cash-on-Cash Return
2.9%
Cap rate
0.4%
Rent to Value Ratio
Active
$795,000
3
bds
|
3
ba
|
1,833
sqft
|
built
2002
17 Chatmoss Rd, Henderson, NV 89052
$-2,392
Cash flow
-15.7%
Cash-on-Cash Return
2.7%
Cap rate
0.4%
Rent to Value Ratio
Active
$699,000
3
bds
|
2
ba
|
2,107
sqft
|
built
2002
2158 Shubert Ave, Henderson, NV 89052
$-2,131
Cash flow
-15.9%
Cash-on-Cash Return
2.6%
Cap rate
0.4%
Rent to Value Ratio

Active
$5,495,000
4
bds
|
4
ba
|
5,000
sqft
|
built
2017
667 Palisade Rim Dr, Henderson, NV 89012
$-24,291
Cash flow
-23.1%
Cash-on-Cash Return
1.0%
Cap rate
0.2%
Rent to Value Ratio
Active
$449,000
3
bds
|
4
ba
|
2,120
sqft
|
built
2015
51 Morning Mimosa Ct, Henderson, NV 89012
$-1,113
Cash flow
-12.9%
Cash-on-Cash Return
3.3%
Cap rate
0.6%
Rent to Value Ratio
Active
$789,000
5
bds
|
4
ba
|
2,969
sqft
|
built
1990
364 Clark Dr, Henderson, NV 89074
$-2,176
Cash flow
-14.4%
Cash-on-Cash Return
3.0%
Cap rate
0.4%
Rent to Value Ratio
Active
$219,998
2
bds
|
2
ba
|
886
sqft
|
built
1994
601 Cabrillo Cir, Henderson, NV 89015
$-467
Cash flow
-11.1%
Cash-on-Cash Return
3.7%
Cap rate
0.6%
Rent to Value Ratio

Active
$950,000
5
bds
|
4
ba
|
4,516
sqft
|
built
1986
210 E Longacres Dr, Henderson, NV 89015
$-846
Cash flow
-4.6%
Cash-on-Cash Return
5.2%
Cap rate
0.7%
Rent to Value Ratio
Active
$519,999
3
bds
|
2
ba
|
1,955
sqft
|
built
2007
1044 Viale Placenza Pl, Henderson, NV 89011
$-1,439
Cash flow
-14.4%
Cash-on-Cash Return
2.9%
Cap rate
0.5%
Rent to Value Ratio

Active
$285,000
2
bds
|
2
ba
|
1,181
sqft
|
built
2006
1152 Harts Bluff Pl, Henderson, NV 89002
$-662
Cash flow
-12.1%
Cash-on-Cash Return
3.5%
Cap rate
0.6%
Rent to Value Ratio
Active
$2,000,000
4
bds
|
6
ba
|
5,033
sqft
|
built
2017
103 San Martino Pl, Henderson, NV 89011
$-4,167
Cash flow
-10.9%
Cash-on-Cash Return
3.8%
Cap rate
0.6%
Rent to Value Ratio

Active
$1,450,000
5
bds
|
5
ba
|
3,680
sqft
|
built
2019
731 Glowing Horizon St, Henderson, NV 89052
$-5,288
Cash flow
-19.0%
Cash-on-Cash Return
1.9%
Cap rate
0.3%
Rent to Value Ratio
Active
$499,990
3
bds
|
4
ba
|
2,344
sqft
|
built
2016
355 Gracious Way, Henderson, NV 89011
$-1,059
Cash flow
-11.1%
Cash-on-Cash Return
3.7%
Cap rate
0.6%
Rent to Value Ratio
Active
$510,000
4
bds
|
4
ba
|
2,044
sqft
|
built
2019
156 Campbelltown Ave, Henderson, NV 89015
$-1,290
Cash flow
-13.2%
Cash-on-Cash Return
3.2%
Cap rate
0.5%
Rent to Value Ratio

Active
$450,000
3
bds
|
3
ba
|
1,435
sqft
|
built
2022
378 Rosefinch St, Henderson, NV 89012
$-1,460
Cash flow
-16.9%
Cash-on-Cash Return
2.4%
Cap rate
0.4%
Rent to Value Ratio
Active
$467,000
4
bds
|
2
ba
|
1,725
sqft
|
built
1996
441 Daylin Ct, Henderson, NV 89015
$-990
Cash flow
-11.1%
Cash-on-Cash Return
3.7%
Cap rate
0.5%
Rent to Value Ratio

Active
$885,000
4
bds
|
3
ba
|
2,281
sqft
|
built
2022
52 Reverie Heights Ave, Henderson, NV 89011
$-1,942
Cash flow
-11.4%
Cash-on-Cash Return
3.6%
Cap rate
0.6%
Rent to Value Ratio
Active
$675,000
3
bds
|
3
ba
|
2,309
sqft
|
built
2022
398 Frank Case Ln, Henderson, NV 89011
$-1,919
Cash flow
-14.8%
Cash-on-Cash Return
2.9%
Cap rate
0.5%
Rent to Value Ratio
Active
$420,000
4
bds
|
3
ba
|
1,786
sqft
|
built
2013
658 Forest Peak St, Henderson, NV 89011
$-1,040
Cash flow
-12.9%
Cash-on-Cash Return
3.3%
Cap rate
0.5%
Rent to Value Ratio
Active
$240,000
4
bds
|
2
ba
|
1,376
sqft
|
built
1984
538 Kristin Ln, Henderson, NV 89011
$-460
Cash flow
-10.0%
Cash-on-Cash Return
4.0%
Cap rate
0.8%
Rent to Value Ratio

Active
$849,999
4
bds
|
4
ba
|
3,922
sqft
|
built
2007
1059 Via Saint Lucia Pl, Henderson, NV 89011
$-2,343
Cash flow
-14.4%
Cash-on-Cash Return
3.0%
Cap rate
0.5%
Rent to Value Ratio

Active
$300,000
2
bds
|
2
ba
|
1,175
sqft
|
built
2000
2325 Windmill Pkwy, Henderson, NV 89074
$-870
Cash flow
-15.1%
Cash-on-Cash Return
2.8%
Cap rate
0.5%
Rent to Value Ratio
Active
$590,000
4
bds
|
3
ba
|
2,112
sqft
|
built
2022
2293 Teatro Ave, Henderson, NV 89044
$-1,628
Cash flow
-14.4%
Cash-on-Cash Return
3.0%
Cap rate
0.5%
Rent to Value Ratio
Active
$835,000
5
bds
|
5
ba
|
3,071
sqft
|
built
2016
3165 Via Como, Henderson, NV 89044
$-2,788
Cash flow
-17.4%
Cash-on-Cash Return
2.3%
Cap rate
0.4%
Rent to Value Ratio
Active
$1,039,000
4
bds
|
3
ba
|
3,000
sqft
|
built
2006
2164 Noonday Ct, Henderson, NV 89052
$-3,753
Cash flow
-18.8%
Cash-on-Cash Return
1.9%
Cap rate
0.3%
Rent to Value Ratio
Active
$449,999
4
bds
|
3
ba
|
2,261
sqft
|
built
2001
5967 Aimless St, Henderson, NV 89011
$-1,019
Cash flow
-11.8%
Cash-on-Cash Return
3.5%
Cap rate
0.5%
Rent to Value Ratio

Active
$675,000
4
bds
|
4
ba
|
2,721
sqft
|
built
2015
1015 Solana Crest St, Henderson, NV 89052
$-1,651
Cash flow
-12.8%
Cash-on-Cash Return
3.3%
Cap rate
0.5%
Rent to Value Ratio
Active
$440,000
3
bds
|
2
ba
|
1,521
sqft
|
built
1997
436 Pumpkin Way, Henderson, NV 89015
$-1,077
Cash flow
-12.8%
Cash-on-Cash Return
3.3%
Cap rate
0.5%
Rent to Value Ratio
Active
$514,990
3
bds
|
2
ba
|
1,905
sqft
|
built
1997
1789 Castro Hill Ave, Henderson, NV 89012
$-1,234
Cash flow
-12.5%
Cash-on-Cash Return
3.4%
Cap rate
0.5%
Rent to Value Ratio
Active
$2,950,000
5
bds
|
7
ba
|
6,430
sqft
|
built
2000
22 Rue Grimaldi Way, Henderson, NV 89011
$-11,917
Cash flow
-21.1%
Cash-on-Cash Return
1.4%
Cap rate
0.2%
Rent to Value Ratio

Active
$659,000
4
bds
|
3
ba
|
3,057
sqft
|
built
2018
2832 Aragon Terrace Way, Henderson, NV 89044
$-1,534
Cash flow
-12.1%
Cash-on-Cash Return
3.5%
Cap rate
0.5%
Rent to Value Ratio
Active
$359,900
3
bds
|
2
ba
|
1,331
sqft
|
built
1983
503 Crony Ave, Henderson, NV 89011
$-699
Cash flow
-10.1%
Cash-on-Cash Return
3.9%
Cap rate
0.5%
Rent to Value Ratio
Active
$377,018
3
bds
|
2
ba
|
1,008
sqft
|
built
1983
1356 Spague St, Henderson, NV 89011
$-791
Cash flow
-10.9%
Cash-on-Cash Return
3.7%
Cap rate
0.5%
Rent to Value Ratio
Active
$1,399,999
4
bds
|
5
ba
|
3,639
sqft
|
built
2017
2804 Candelaria Dr, Henderson, NV 89074
$-4,984
Cash flow
-18.6%
Cash-on-Cash Return
2.0%
Cap rate
0.3%
Rent to Value Ratio
Active
$579,900
3
bds
|
3
ba
|
2,266
sqft
|
built
2020
1000 E Sunset Rd, Henderson, NV 89011
$-1,745
Cash flow
-15.7%
Cash-on-Cash Return
2.7%
Cap rate
0.4%
Rent to Value Ratio
Active
$925,000
3
bds
|
3
ba
|
2,405
sqft
|
built
2004
531 N Milan St, Henderson, NV 89015
$-2,288
Cash flow
-12.9%
Cash-on-Cash Return
3.3%
Cap rate
0.4%
Rent to Value Ratio