Henderson, NV Investment Properties for Sale
Browse homes for sale and investment properties in Henderson, NV. Refine your search by price, property type, or more.
Best cash flowing properties in Henderson, NV
Active
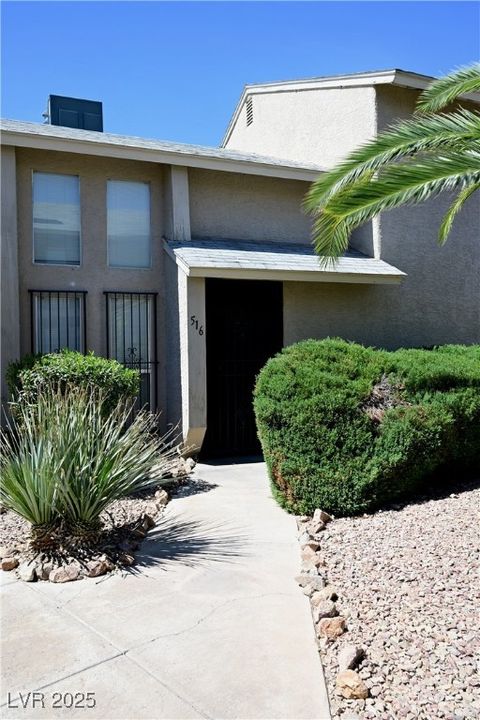
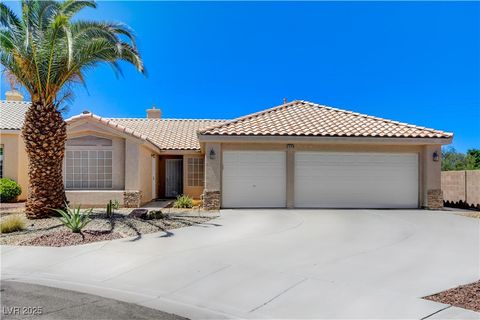
$195,000
1
bds
|
2
ba
|
838
sqft
|
built
1983
516 Sellers Pl, Henderson, NV 89011
$-433
Cash flow
-11.6%
Cash-on-Cash Return
3.6%
Cap rate
0.7%
Rent to Value Ratio

Active
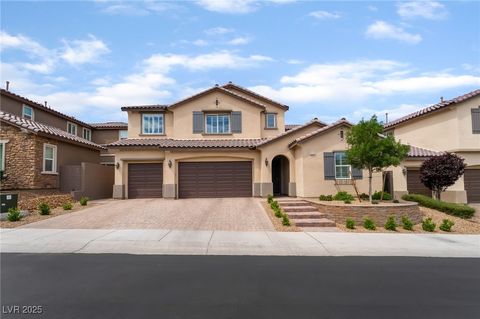
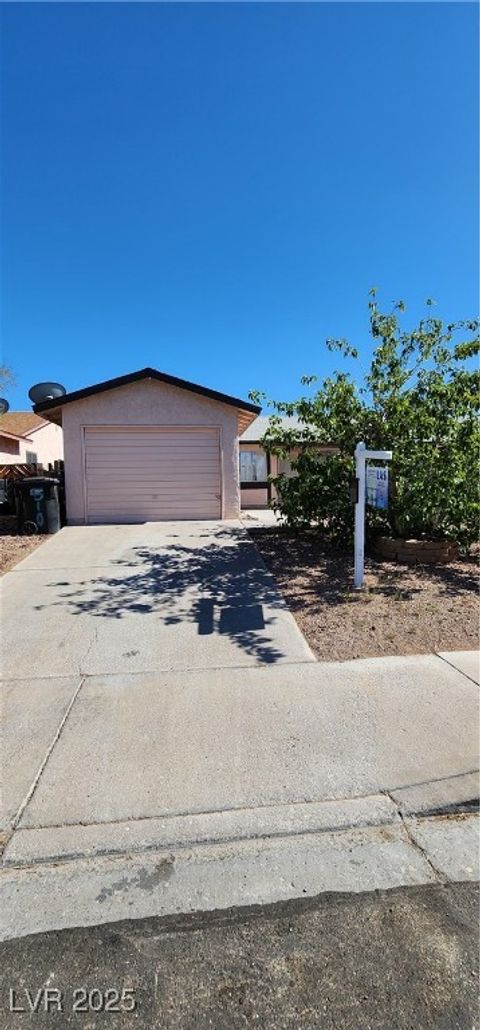
$430,000
3
bds
|
2
ba
|
1,153
sqft
|
built
1996
394 Lombardy Cir, Henderson, NV 89015
$-652
Cash flow
-7.9%
Cash-on-Cash Return
4.4%
Cap rate
0.6%
Rent to Value Ratio
1,351 out of 1,437 properties for sale in Henderson, NV
Limited Results Shown
Create a free account, or log in to reveal all property listings and enjoy the complete experience.

Active
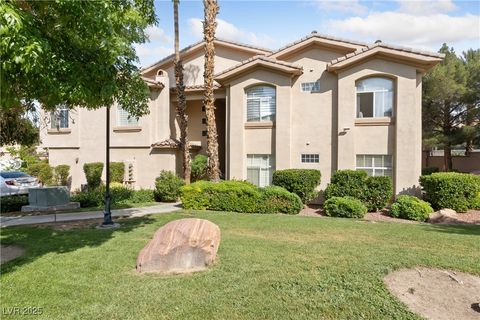
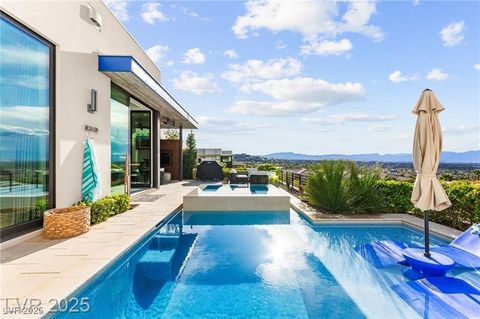
$1,450,000
5
bds
|
5
ba
|
3,824
sqft
|
built
2023
298 Watteau Ct, Henderson, NV 89012
$-5,773
Cash flow
-20.8%
Cash-on-Cash Return
1.5%
Cap rate
0.3%
Rent to Value Ratio
Active
$195,000
1
bds
|
2
ba
|
838
sqft
|
built
1983
516 Sellers Pl, Henderson, NV 89011
$-433
Cash flow
-11.6%
Cash-on-Cash Return
3.6%
Cap rate
0.7%
Rent to Value Ratio
Active
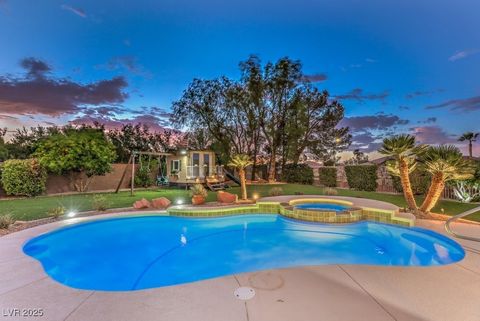
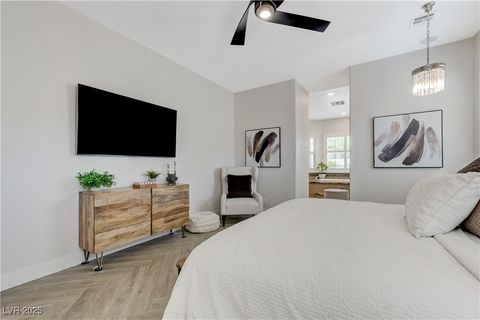
$849,900
4
bds
|
4
ba
|
3,091
sqft
|
built
2019
2575 Hazelburn Ave, Henderson, NV 89044
$-2,675
Cash flow
-16.4%
Cash-on-Cash Return
2.5%
Cap rate
0.4%
Rent to Value Ratio
Active
$429,000
3
bds
|
2
ba
|
1,542
sqft
|
built
1996
2050 W Warm Springs Rd, Henderson, NV 89014
$-1,090
Cash flow
-13.3%
Cash-on-Cash Return
3.2%
Cap rate
0.6%
Rent to Value Ratio

Active
$357,000
2
bds
|
3
ba
|
1,200
sqft
|
built
1992
1663 Cloister Ave, Henderson, NV 89014
$-914
Cash flow
-13.4%
Cash-on-Cash Return
3.2%
Cap rate
0.5%
Rent to Value Ratio

Active
$650,000
4
bds
|
3
ba
|
3,079
sqft
|
built
1986
1021 Calico Ridge Dr, Henderson, NV 89011
$-1,519
Cash flow
-12.2%
Cash-on-Cash Return
3.5%
Cap rate
0.5%
Rent to Value Ratio
Active
$1,195,000
2
bds
|
2
ba
|
2,499
sqft
|
built
2000
71 Fountainhead Cir, Henderson, NV 89052
$-3,528
Cash flow
-15.4%
Cash-on-Cash Return
2.7%
Cap rate
0.4%
Rent to Value Ratio
Active
$599,987
3
bds
|
2
ba
|
1,491
sqft
|
built
1996
2848 Skowhegan Dr, Henderson, NV 89074
$-1,641
Cash flow
-14.3%
Cash-on-Cash Return
3.0%
Cap rate
0.4%
Rent to Value Ratio

Active
$3,750,000
5
bds
|
7
ba
|
7,186
sqft
|
built
2002
15 Rue Du Rivoli Pl, Henderson, NV 89011
$-16,245
Cash flow
-22.6%
Cash-on-Cash Return
1.1%
Cap rate
0.2%
Rent to Value Ratio

Active
$9,600,000
5
bds
|
6
ba
|
10,111
sqft
|
built
2001
1520 Mac Donald Ranch Dr, Henderson, NV 89012
$-46,105
Cash flow
-25.1%
Cash-on-Cash Return
0.5%
Cap rate
0.1%
Rent to Value Ratio

Active
$535,000
3
bds
|
3
ba
|
2,294
sqft
|
built
2012
3232 Romanesque Art Ave, Henderson, NV 89044
$-1,157
Cash flow
-11.3%
Cash-on-Cash Return
3.7%
Cap rate
0.5%
Rent to Value Ratio
Active
$330,000
3
bds
|
2
ba
|
1,937
sqft
|
built
1981
510 Holick Ave, Henderson, NV 89011
$-800
Cash flow
-12.6%
Cash-on-Cash Return
3.4%
Cap rate
0.4%
Rent to Value Ratio

Active
$324,900
2
bds
|
2
ba
|
1,200
sqft
|
built
2004
2305 W Horizon Ridge Pkwy, Henderson, NV 89052
$-952
Cash flow
-15.3%
Cash-on-Cash Return
2.7%
Cap rate
0.5%
Rent to Value Ratio

Active
$600,000
3
bds
|
2
ba
|
2,161
sqft
|
built
2004
1008 New Creek Ave, Henderson, NV 89015
$-1,446
Cash flow
-12.6%
Cash-on-Cash Return
3.4%
Cap rate
0.5%
Rent to Value Ratio

Active
$369,900
2
bds
|
2
ba
|
1,341
sqft
|
built
2007
2555 Hampton Rd, Henderson, NV 89052
$-1,120
Cash flow
-15.8%
Cash-on-Cash Return
2.6%
Cap rate
0.5%
Rent to Value Ratio
Active
$2,750,000
3
bds
|
4
ba
|
3,024
sqft
|
built
2021
387 Suzanne Peak Ct, Henderson, NV 89012
$-13,601
Cash flow
-25.8%
Cash-on-Cash Return
0.3%
Cap rate
0.1%
Rent to Value Ratio

Active
$719,999
4
bds
|
3
ba
|
2,174
sqft
|
built
2022
832 Stepney Pl, Henderson, NV 89011
$-2,128
Cash flow
-15.4%
Cash-on-Cash Return
2.7%
Cap rate
0.4%
Rent to Value Ratio

Active
$644,000
4
bds
|
4
ba
|
2,488
sqft
|
built
2015
2606 Marvel Astoria St, Henderson, NV 89044
$-1,832
Cash flow
-14.8%
Cash-on-Cash Return
2.9%
Cap rate
0.5%
Rent to Value Ratio

Active
$1,300,000
3
bds
|
4
ba
|
3,002
sqft
|
built
2020
9 Porto Malaga St, Henderson, NV 89011
$-3,414
Cash flow
-13.7%
Cash-on-Cash Return
3.1%
Cap rate
0.5%
Rent to Value Ratio
Active
$1,275,000
4
bds
|
4
ba
|
3,350
sqft
|
built
2006
2168 Big Bar Dr, Henderson, NV 89052
$-3,599
Cash flow
-14.7%
Cash-on-Cash Return
2.9%
Cap rate
0.4%
Rent to Value Ratio

Active
$3,500,000
5
bds
|
5
ba
|
6,407
sqft
|
built
2001
2 Camino Barcelona Pl, Henderson, NV 89011
$-16,427
Cash flow
-24.5%
Cash-on-Cash Return
0.6%
Cap rate
0.2%
Rent to Value Ratio

Active
$459,999
4
bds
|
3
ba
|
1,937
sqft
|
built
2017
2240 Sky Island Dr, Henderson, NV 89002
$-1,294
Cash flow
-14.7%
Cash-on-Cash Return
2.9%
Cap rate
0.5%
Rent to Value Ratio
Active
$7,290,000
5
bds
|
5
ba
|
6,452
sqft
|
built
2019
673 Falcon Cliff Ct, Henderson, NV 89012
$-33,393
Cash flow
-23.9%
Cash-on-Cash Return
0.8%
Cap rate
0.2%
Rent to Value Ratio

Active
$839,000
3
bds
|
3
ba
|
2,826
sqft
|
built
2018
3155 Dalmazia Ave, Henderson, NV 89044
$-2,802
Cash flow
-17.4%
Cash-on-Cash Return
2.3%
Cap rate
0.4%
Rent to Value Ratio

Active
$699,900
4
bds
|
3
ba
|
2,518
sqft
|
built
2017
2486 Dragon Fire Ln, Henderson, NV 89052
$-1,993
Cash flow
-14.9%
Cash-on-Cash Return
2.8%
Cap rate
0.4%
Rent to Value Ratio
Active
$1,298,000
5
bds
|
5
ba
|
3,422
sqft
|
built
2022
2004 Peaceful Mesa Ct, Henderson, NV 89052
$-4,996
Cash flow
-20.1%
Cash-on-Cash Return
1.6%
Cap rate
0.3%
Rent to Value Ratio

Active
$519,900
4
bds
|
3
ba
|
2,409
sqft
|
built
2020
160 Lilt Ave, Henderson, NV 89011
$-1,404
Cash flow
-14.1%
Cash-on-Cash Return
3.0%
Cap rate
0.5%
Rent to Value Ratio

Active
$1,199,000
4
bds
|
3
ba
|
4,058
sqft
|
built
2000
464 Beardsley Cir, Henderson, NV 89052
$-4,112
Cash flow
-17.9%
Cash-on-Cash Return
2.1%
Cap rate
0.3%
Rent to Value Ratio
Active
$315,000
2
bds
|
2
ba
|
1,229
sqft
|
built
2005
1370 Crystal Hill Ln, Henderson, NV 89012
$-720
Cash flow
-11.9%
Cash-on-Cash Return
3.5%
Cap rate
0.6%
Rent to Value Ratio

Active
$320,000
3
bds
|
2
ba
|
1,330
sqft
|
built
2004
2291 W Horizon Ridge Pkwy, Henderson, NV 89052
$-792
Cash flow
-12.9%
Cash-on-Cash Return
3.3%
Cap rate
0.6%
Rent to Value Ratio

Active
$899,000
4
bds
|
3
ba
|
3,669
sqft
|
built
2006
25 Blue Valley Dr, Henderson, NV 89002
$-2,618
Cash flow
-15.2%
Cash-on-Cash Return
2.8%
Cap rate
0.4%
Rent to Value Ratio

Active
$775,000
3
bds
|
3
ba
|
2,826
sqft
|
built
2014
3158 Biancavilla Ave, Henderson, NV 89044
$-2,181
Cash flow
-14.7%
Cash-on-Cash Return
2.9%
Cap rate
0.5%
Rent to Value Ratio
Active
$550,000
3
bds
|
3
ba
|
2,017
sqft
|
built
2018
2613 Adesso Pl, Henderson, NV 89044
$-1,374
Cash flow
-13.0%
Cash-on-Cash Return
3.3%
Cap rate
0.5%
Rent to Value Ratio

Active
$749,995
4
bds
|
3
ba
|
2,661
sqft
|
built
2008
2673 Paris Amour St, Henderson, NV 89044
$-2,066
Cash flow
-14.4%
Cash-on-Cash Return
3.0%
Cap rate
0.4%
Rent to Value Ratio

Active
$389,000
2
bds
|
2
ba
|
1,000
sqft
|
built
1994
79 Magical Mystery Ln, Henderson, NV 89074
$-988
Cash flow
-13.3%
Cash-on-Cash Return
3.2%
Cap rate
0.5%
Rent to Value Ratio

Active
$468,900
3
bds
|
3
ba
|
1,594
sqft
|
built
2021
122 Cabaletta Ln, Henderson, NV 89015
$-1,387
Cash flow
-15.4%
Cash-on-Cash Return
2.7%
Cap rate
0.4%
Rent to Value Ratio

Active
$699,000
5
bds
|
5
ba
|
3,465
sqft
|
built
2022
234 Polaris Ridge Ave, Henderson, NV 89011
$-1,447
Cash flow
-10.8%
Cash-on-Cash Return
3.8%
Cap rate
0.6%
Rent to Value Ratio
Active
$430,000
3
bds
|
2
ba
|
1,153
sqft
|
built
1996
394 Lombardy Cir, Henderson, NV 89015
$-652
Cash flow
-7.9%
Cash-on-Cash Return
4.4%
Cap rate
0.6%
Rent to Value Ratio
Active
$760,000
3
bds
|
3
ba
|
2,486
sqft
|
built
2023
689 Moonstone Beach Pl, Henderson, NV 89011
$-2,571
Cash flow
-17.6%
Cash-on-Cash Return
2.2%
Cap rate
0.4%
Rent to Value Ratio

Active
$1,474,900
4
bds
|
4
ba
|
3,658
sqft
|
built
2007
2240 Boutique Ave, Henderson, NV 89044
$-5,688
Cash flow
-20.1%
Cash-on-Cash Return
1.6%
Cap rate
0.3%
Rent to Value Ratio