Henderson, NV Investment Properties for Sale
Browse homes for sale and investment properties in Henderson, NV. Refine your search by price, property type, or more.
Best cash flowing properties in Henderson, NV
Active
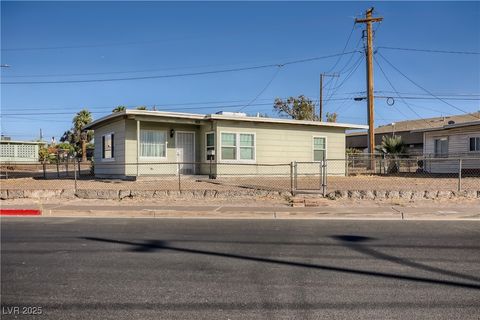
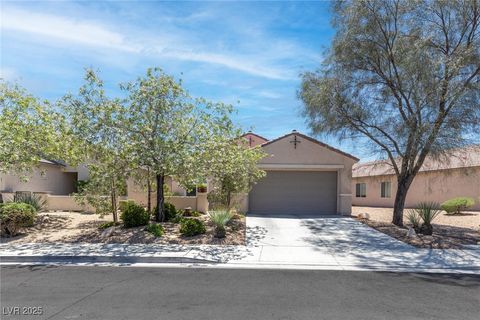
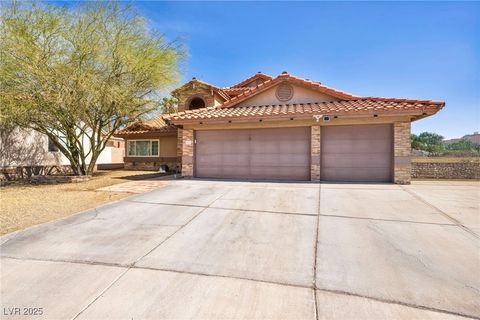
$300,000
3
bds
|
1
ba
|
878
sqft
|
built
1942
103 W Victory Rd, Henderson, NV 89015
$-425
Cash flow
-7.4%
Cash-on-Cash Return
4.6%
Cap rate
0.6%
Rent to Value Ratio

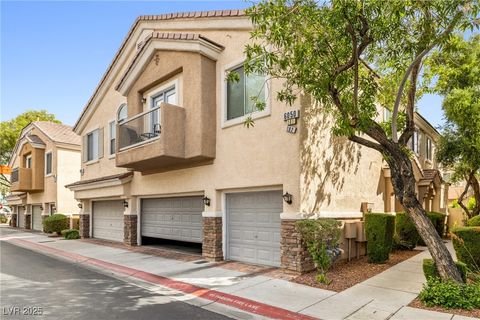
Active
$262,000
2
bds
|
2
ba
|
1,249
sqft
|
built
2006
833 Aspen Peak Loop, Henderson, NV 89011
$-592
Cash flow
-11.8%
Cash-on-Cash Return
3.6%
Cap rate
0.6%
Rent to Value Ratio
1,358 out of 1,444 properties for sale in Henderson, NV
Limited Results Shown
Create a free account, or log in to reveal all property listings and enjoy the complete experience.

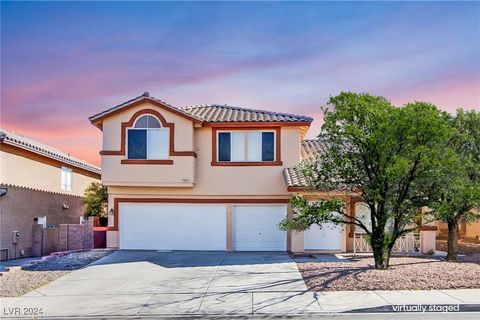
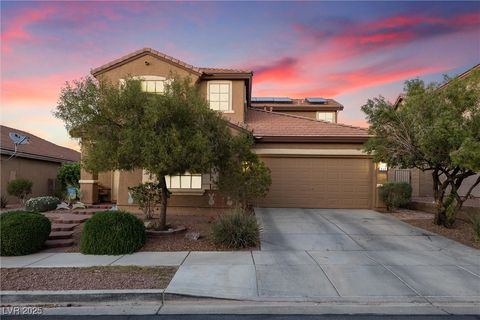
Active
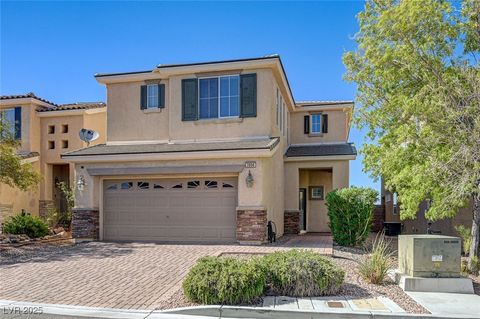
$749,990
3
bds
|
2
ba
|
1,950
sqft
|
built
2003
2144 Paganini Ave, Henderson, NV 89052
$-1,608
Cash flow
-11.2%
Cash-on-Cash Return
3.7%
Cap rate
0.5%
Rent to Value Ratio

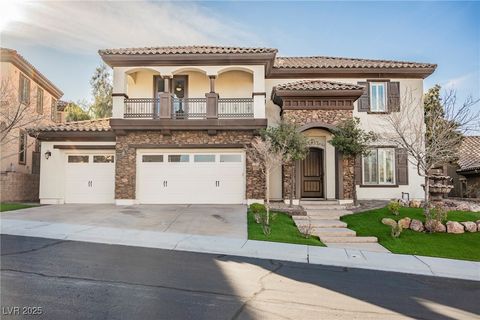
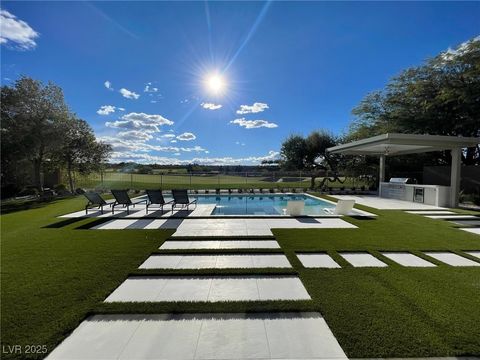
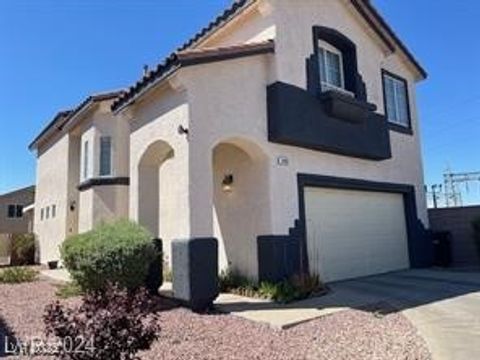
Active
$592,000
3
bds
|
3
ba
|
2,098
sqft
|
built
1994
819 Sandsprings St, Henderson, NV 89011
$-1,562
Cash flow
-13.8%
Cash-on-Cash Return
3.1%
Cap rate
0.4%
Rent to Value Ratio
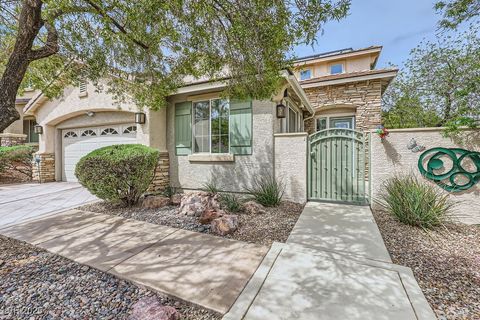
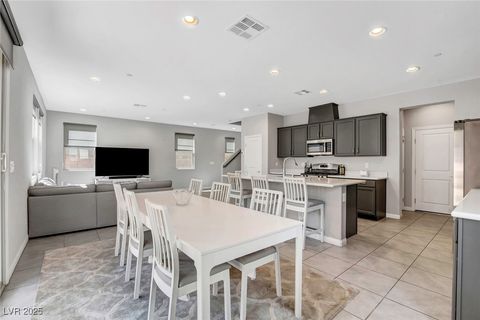
Active
$1,799,000
4
bds
|
5
ba
|
3,879
sqft
|
built
2004
5 Via Ravenna Ct, Henderson, NV 89011
$-5,849
Cash flow
-17.0%
Cash-on-Cash Return
2.4%
Cap rate
0.4%
Rent to Value Ratio

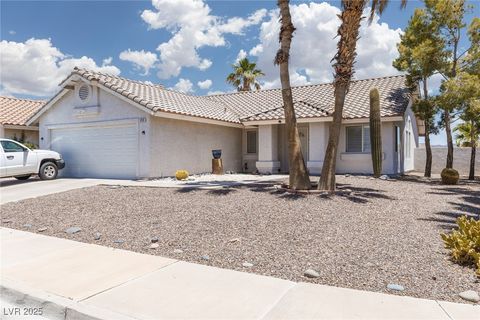
Active
$850,000
4
bds
|
3
ba
|
3,050
sqft
|
built
2002
1501 Via Salaria Ct, Henderson, NV 89052
$-2,717
Cash flow
-16.7%
Cash-on-Cash Return
2.4%
Cap rate
0.4%
Rent to Value Ratio

Active
$830,000
4
bds
|
3
ba
|
2,920
sqft
|
built
1989
2108 Inverness Dr, Henderson, NV 89074
$-2,534
Cash flow
-15.9%
Cash-on-Cash Return
2.6%
Cap rate
0.4%
Rent to Value Ratio
Active
$519,999
3
bds
|
3
ba
|
2,463
sqft
|
built
1996
1028 Twin Berry Ct, Henderson, NV 89002
$-1,374
Cash flow
-13.8%
Cash-on-Cash Return
3.1%
Cap rate
0.4%
Rent to Value Ratio
Active
$1,595,000
5
bds
|
6
ba
|
4,805
sqft
|
built
2006
2768 Liberation Dr, Henderson, NV 89044
$-3,923
Cash flow
-12.8%
Cash-on-Cash Return
3.3%
Cap rate
0.5%
Rent to Value Ratio
Active
$520,000
3
bds
|
2
ba
|
1,928
sqft
|
built
2005
2799 Alnwick Ct, Henderson, NV 89044
$-1,406
Cash flow
-14.1%
Cash-on-Cash Return
3.0%
Cap rate
0.4%
Rent to Value Ratio

Active
$849,900
5
bds
|
4
ba
|
3,225
sqft
|
built
2001
1667 Sabatini Dr, Henderson, NV 89052
$-2,419
Cash flow
-14.8%
Cash-on-Cash Return
2.8%
Cap rate
0.4%
Rent to Value Ratio

Active
$635,000
5
bds
|
3
ba
|
2,838
sqft
|
built
2000
104 Glendive St, Henderson, NV 89012
$-1,554
Cash flow
-12.8%
Cash-on-Cash Return
3.3%
Cap rate
0.5%
Rent to Value Ratio

Active
$430,000
3
bds
|
3
ba
|
1,901
sqft
|
built
2010
684 Calamus Palm Pl, Henderson, NV 89011
$-1,095
Cash flow
-13.3%
Cash-on-Cash Return
3.2%
Cap rate
0.5%
Rent to Value Ratio

Active
$419,900
4
bds
|
2
ba
|
1,382
sqft
|
built
1999
733 Hitchen Post Dr, Henderson, NV 89011
$-1,051
Cash flow
-13.1%
Cash-on-Cash Return
3.3%
Cap rate
0.4%
Rent to Value Ratio

Active
$385,000
3
bds
|
2
ba
|
1,474
sqft
|
built
1994
521 Landra Ln, Henderson, NV 89015
$-766
Cash flow
-10.4%
Cash-on-Cash Return
3.9%
Cap rate
0.5%
Rent to Value Ratio
Active
$539,999
5
bds
|
3
ba
|
2,260
sqft
|
built
2006
648 Sunrise Lake Pl, Henderson, NV 89002
$-1,297
Cash flow
-12.5%
Cash-on-Cash Return
3.4%
Cap rate
0.5%
Rent to Value Ratio
Active
$2,750,000
6
bds
|
5
ba
|
5,092
sqft
|
built
2002
5 Clear Crossing Trl, Henderson, NV 89052
$-7,712
Cash flow
-14.6%
Cash-on-Cash Return
2.9%
Cap rate
0.4%
Rent to Value Ratio

Active
$1,140,000
5
bds
|
5
ba
|
4,200
sqft
|
built
2006
1265 Vietti St, Henderson, NV 89012
$-3,186
Cash flow
-14.6%
Cash-on-Cash Return
2.9%
Cap rate
0.4%
Rent to Value Ratio
Active
$560,000
3
bds
|
3
ba
|
2,186
sqft
|
built
2003
215 Sunset Shower Dr, Henderson, NV 89012
$-1,146
Cash flow
-10.7%
Cash-on-Cash Return
3.8%
Cap rate
0.5%
Rent to Value Ratio
Active
$262,000
2
bds
|
2
ba
|
1,249
sqft
|
built
2006
833 Aspen Peak Loop, Henderson, NV 89011
$-592
Cash flow
-11.8%
Cash-on-Cash Return
3.6%
Cap rate
0.6%
Rent to Value Ratio
Active
$574,900
4
bds
|
3
ba
|
2,088
sqft
|
built
1989
266 Cordero Dr, Henderson, NV 89074
$-1,265
Cash flow
-11.5%
Cash-on-Cash Return
3.6%
Cap rate
0.5%
Rent to Value Ratio

Active
$659,999
5
bds
|
3
ba
|
2,108
sqft
|
built
1988
353 Templeton Dr, Henderson, NV 89074
$-1,707
Cash flow
-13.5%
Cash-on-Cash Return
3.2%
Cap rate
0.4%
Rent to Value Ratio

Active
$540,000
4
bds
|
3
ba
|
2,303
sqft
|
built
2001
89 Autumn Day St, Henderson, NV 89012
$-1,300
Cash flow
-12.6%
Cash-on-Cash Return
3.4%
Cap rate
0.5%
Rent to Value Ratio
Active
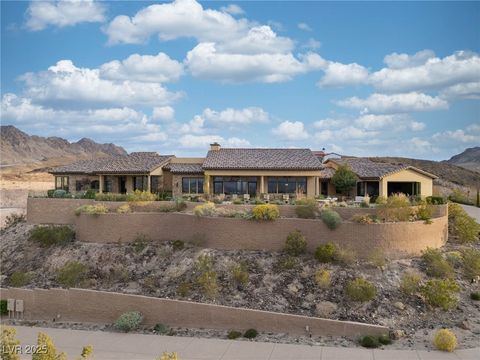
$4,999,999
4
bds
|
7
ba
|
6,890
sqft
|
built
2019
1123 Christian Rd, Henderson, NV 89002
$-24,603
Cash flow
-25.7%
Cash-on-Cash Return
0.4%
Cap rate
0.1%
Rent to Value Ratio
Active
$500,000
4
bds
|
2
ba
|
1,830
sqft
|
built
1978
2423 Vista Colina St, Henderson, NV 89014
$-822
Cash flow
-8.6%
Cash-on-Cash Return
4.3%
Cap rate
0.6%
Rent to Value Ratio
Active
$340,000
3
bds
|
3
ba
|
1,423
sqft
|
built
2004
6050 Golden Corral Trl, Henderson, NV 89011
$-846
Cash flow
-13.0%
Cash-on-Cash Return
3.3%
Cap rate
0.5%
Rent to Value Ratio

Active
$849,000
4
bds
|
5
ba
|
2,961
sqft
|
built
2005
25 Luce Del Sole, Henderson, NV 89011
$-2,445
Cash flow
-15.0%
Cash-on-Cash Return
2.8%
Cap rate
0.6%
Rent to Value Ratio

Active
$235,000
2
bds
|
2
ba
|
1,019
sqft
|
built
1996
520 Arrowhead Trl, Henderson, NV 89015
$-659
Cash flow
-14.6%
Cash-on-Cash Return
2.9%
Cap rate
0.6%
Rent to Value Ratio

Active
$895,000
5
bds
|
3
ba
|
3,058
sqft
|
built
2018
3195 Hazy Hills Ave, Henderson, NV 89052
$-2,729
Cash flow
-15.9%
Cash-on-Cash Return
2.6%
Cap rate
0.4%
Rent to Value Ratio
Active
$605,000
4
bds
|
3
ba
|
2,170
sqft
|
built
2018
2767 Alta Vista St, Henderson, NV 89044
$-1,449
Cash flow
-12.5%
Cash-on-Cash Return
3.4%
Cap rate
0.5%
Rent to Value Ratio
Active
$490,000
3
bds
|
3
ba
|
1,835
sqft
|
built
2016
367 Wilford Springs St, Henderson, NV 89014
$-1,219
Cash flow
-13.0%
Cash-on-Cash Return
3.3%
Cap rate
0.5%
Rent to Value Ratio
Active
$499,900
4
bds
|
3
ba
|
2,403
sqft
|
built
2007
1557 Blue Sierra Ct, Henderson, NV 89074
$-1,394
Cash flow
-14.5%
Cash-on-Cash Return
2.9%
Cap rate
0.4%
Rent to Value Ratio
Active
$1,100,000
5
bds
|
4
ba
|
3,903
sqft
|
built
2003
1436 Via Merano St, Henderson, NV 89052
$-2,418
Cash flow
-11.5%
Cash-on-Cash Return
3.6%
Cap rate
0.5%
Rent to Value Ratio
Active
$300,000
3
bds
|
1
ba
|
878
sqft
|
built
1942
103 W Victory Rd, Henderson, NV 89015
$-425
Cash flow
-7.4%
Cash-on-Cash Return
4.6%
Cap rate
0.6%
Rent to Value Ratio
Active
$590,000
4
bds
|
3
ba
|
2,462
sqft
|
built
2007
2856 Trossachs St, Henderson, NV 89044
$-1,709
Cash flow
-15.1%
Cash-on-Cash Return
2.8%
Cap rate
0.4%
Rent to Value Ratio
Active
$429,900
4
bds
|
3
ba
|
1,874
sqft
|
built
2004
648 Jumbled Sage Ct, Henderson, NV 89015
$-897
Cash flow
-10.9%
Cash-on-Cash Return
3.8%
Cap rate
0.5%
Rent to Value Ratio

Active
$600,000
2
bds
|
3
ba
|
2,039
sqft
|
built
2006
472 Via Stretto Ave, Henderson, NV 89011
$-1,777
Cash flow
-15.5%
Cash-on-Cash Return
2.7%
Cap rate
0.4%
Rent to Value Ratio
Active
$649,900
5
bds
|
3
ba
|
2,490
sqft
|
built
2021
15 Santo Mio Ct, Henderson, NV 89011
$-1,639
Cash flow
-13.2%
Cash-on-Cash Return
3.2%
Cap rate
0.5%
Rent to Value Ratio
Active
$475,000
3
bds
|
2
ba
|
1,668
sqft
|
built
1996
998 Hunters Run Dr, Henderson, NV 89002
$-1,145
Cash flow
-12.6%
Cash-on-Cash Return
3.4%
Cap rate
0.5%
Rent to Value Ratio
Active
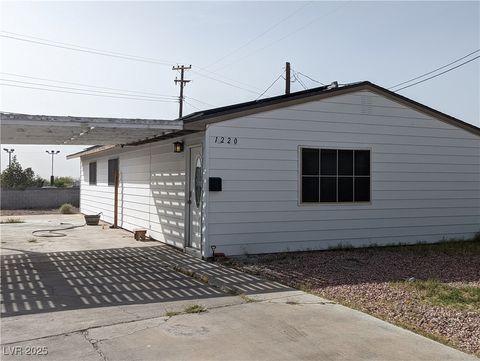
$359,900
4
bds
|
2
ba
|
1,152
sqft
|
built
1970
1220 Toledo St, Henderson, NV 89015
$-689
Cash flow
-10.0%
Cash-on-Cash Return
4.0%
Cap rate
0.5%
Rent to Value Ratio
Active
$600,000
4
bds
|
3
ba
|
2,222
sqft
|
built
1981
327 Fuente Dr, Henderson, NV 89014
$-1,383
Cash flow
-12.0%
Cash-on-Cash Return
3.5%
Cap rate
0.5%
Rent to Value Ratio
Active
$1,295,000
3
bds
|
4
ba
|
2,614
sqft
|
built
2003
37 Stonemark Dr, Henderson, NV 89052
$-4,237
Cash flow
-17.1%
Cash-on-Cash Return
2.3%
Cap rate
0.4%
Rent to Value Ratio