Henderson, NV Investment Properties for Sale
Browse homes for sale and investment properties in Henderson, NV. Refine your search by price, property type, or more.
Best cash flowing properties in Henderson, NV

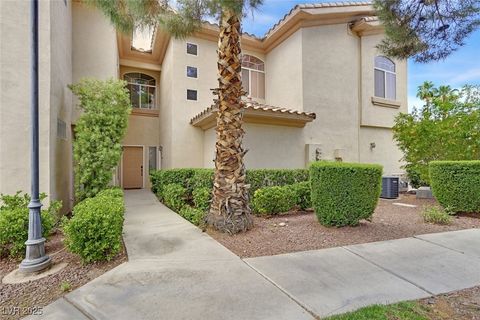
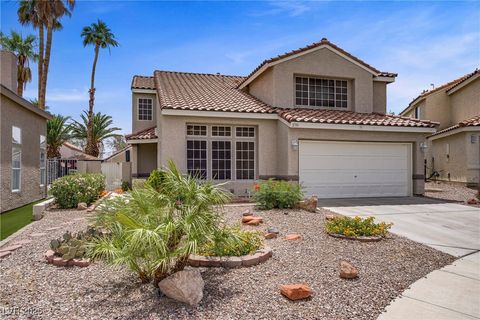
Active
$629,000
4
bds
|
3
ba
|
2,505
sqft
|
built
1989
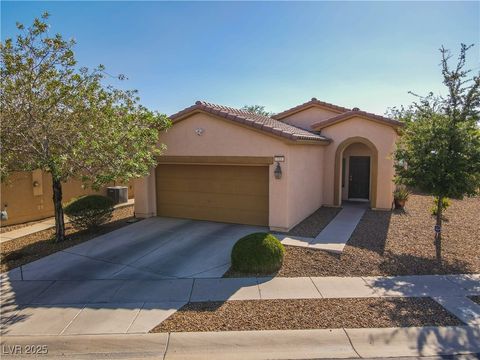
1808 Michael Ct, Henderson, NV 89014
$-402
Cash flow
-3.3%
Cash-on-Cash Return
4.9%
Cap rate
0.7%
Rent to Value Ratio

Active
$259,750
2
bds
|
2
ba
|
1,151
sqft
|
built
1995
698 S Racetrack Rd, Henderson, NV 89015
$-409
Cash flow
-8.2%
Cash-on-Cash Return
3.8%
Cap rate
0.6%
Rent to Value Ratio
1,287 out of 1,361 properties for sale in Henderson, NV
Limited Results Shown
Create a free account, or log in to reveal all property listings and enjoy the complete experience.
Active
$259,750
2
bds
|
2
ba
|
1,151
sqft
|
built
1995
698 S Racetrack Rd, Henderson, NV 89015
$-409
Cash flow
-8.2%
Cash-on-Cash Return
3.8%
Cap rate
0.6%
Rent to Value Ratio

Active
$560,000
4
bds
|
2
ba
|
1,824
sqft
|
built
2021
393 Mullen Ave, Henderson, NV 89044
$-1,272
Cash flow
-11.9%
Cash-on-Cash Return
3.0%
Cap rate
0.5%
Rent to Value Ratio

Active
$410,000
3
bds
|
3
ba
|
1,431
sqft
|
built
2001
730 Goshawk St, Henderson, NV 89015
$-760
Cash flow
-9.7%
Cash-on-Cash Return
3.5%
Cap rate
0.5%
Rent to Value Ratio

Active
$433,000
3
bds
|
2
ba
|
1,629
sqft
|
built
1992
472 Tiger Lily Way, Henderson, NV 89015
$-608
Cash flow
-7.3%
Cash-on-Cash Return
4.0%
Cap rate
0.5%
Rent to Value Ratio

Active
$1,150,000
5
bds
|
5
ba
|
3,713
sqft
|
built
2015
245 Hull St, Henderson, NV 89015
$-2,928
Cash flow
-13.3%
Cash-on-Cash Return
2.6%
Cap rate
0.4%
Rent to Value Ratio

Active
$979,900
4
bds
|
4
ba
|
3,304
sqft
|
built
2007
2124 Pont National Dr, Henderson, NV 89044
$-1,664
Cash flow
-8.9%
Cash-on-Cash Return
3.6%
Cap rate
0.5%
Rent to Value Ratio

Active
$624,999
4
bds
|
4
ba
|
2,841
sqft
|
built
2009
2037 Brush Stroke St, Henderson, NV 89044
$-1,330
Cash flow
-11.1%
Cash-on-Cash Return
3.1%
Cap rate
0.4%
Rent to Value Ratio
Active
$329,900
2
bds
|
2
ba
|
1,340
sqft
|
built
1996
2050 W Warm Springs Rd, Henderson, NV 89014
$-763
Cash flow
-12.1%
Cash-on-Cash Return
2.9%
Cap rate
0.6%
Rent to Value Ratio

Active
$364,888
2
bds
|
3
ba
|
1,436
sqft
|
built
2023
216 Callen Falls Ave, Henderson, NV 89011
$-854
Cash flow
-12.2%
Cash-on-Cash Return
2.9%
Cap rate
0.5%
Rent to Value Ratio
Active
$630,000
3
bds
|
3
ba
|
2,237
sqft
|
built
2024
161 Cabo Cruces Dr, Henderson, NV 89011
$-1,902
Cash flow
-15.8%
Cash-on-Cash Return
2.1%
Cap rate
0.4%
Rent to Value Ratio
Active under contract
$599,995
3
bds
|
2
ba
|
2,011
sqft
|
built
2023
741 Monroe Hill Pl, Henderson, NV 89011
$-1,392
Cash flow
-12.1%
Cash-on-Cash Return
2.9%
Cap rate
0.5%
Rent to Value Ratio

Active under contract
$699,900
5
bds
|
3
ba
|
3,800
sqft
|
built
2007
2189 De Narvik Dr, Henderson, NV 89044
$-1,458
Cash flow
-10.9%
Cash-on-Cash Return
3.2%
Cap rate
0.5%
Rent to Value Ratio

Active
$1,220,000
4
bds
|
5
ba
|
3,266
sqft
|
built
2015
881 Barrhead Ave, Henderson, NV 89012
$-2,103
Cash flow
-9.0%
Cash-on-Cash Return
3.6%
Cap rate
0.5%
Rent to Value Ratio

Active
$549,900
3
bds
|
2
ba
|
1,754
sqft
|
built
2004
2425 Sturrock Dr, Henderson, NV 89044
$-1,337
Cash flow
-12.7%
Cash-on-Cash Return
2.8%
Cap rate
0.4%
Rent to Value Ratio

Active
$749,999
4
bds
|
3
ba
|
2,705
sqft
|
built
1999
2725 Cool Lilac Ave, Henderson, NV 89052
$-1,395
Cash flow
-9.7%
Cash-on-Cash Return
3.4%
Cap rate
0.5%
Rent to Value Ratio
Active
$410,000
3
bds
|
2
ba
|
1,154
sqft
|
built
1988
765 Butternut Ct, Henderson, NV 89014
$-718
Cash flow
-9.1%
Cash-on-Cash Return
3.6%
Cap rate
0.5%
Rent to Value Ratio

Active
$385,000
3
bds
|
2
ba
|
1,417
sqft
|
built
2022
12728 Feathersong St, Henderson, NV 89044
$-771
Cash flow
-10.4%
Cash-on-Cash Return
3.3%
Cap rate
0.6%
Rent to Value Ratio

Active
$340,000
3
bds
|
3
ba
|
1,537
sqft
|
built
1999
221 Oro Canyon St, Henderson, NV 89074
$-625
Cash flow
-9.6%
Cash-on-Cash Return
3.5%
Cap rate
0.5%
Rent to Value Ratio
Active
$629,000
4
bds
|
3
ba
|
2,505
sqft
|
built
1989
1808 Michael Ct, Henderson, NV 89014
$-402
Cash flow
-3.3%
Cash-on-Cash Return
4.9%
Cap rate
0.7%
Rent to Value Ratio

Pending
$599,500
4
bds
|
3
ba
|
2,081
sqft
|
built
1992
71 Sea Holly Way, Henderson, NV 89074
$-622
Cash flow
-5.4%
Cash-on-Cash Return
4.4%
Cap rate
0.6%
Rent to Value Ratio

Active
$535,000
4
bds
|
3
ba
|
2,283
sqft
|
built
2018
1556 Olivia Pkwy, Henderson, NV 89011
$-1,275
Cash flow
-12.4%
Cash-on-Cash Return
2.8%
Cap rate
0.5%
Rent to Value Ratio

Active
$3,888,888
5
bds
|
7
ba
|
7,794
sqft
|
built
1989
13 Dovetail Cir, Henderson, NV 89014
$-15,108
Cash flow
-20.3%
Cash-on-Cash Return
1.0%
Cap rate
0.2%
Rent to Value Ratio
Active under contract
$579,999
4
bds
|
3
ba
|
2,222
sqft
|
built
1990
270 Snowy River Cir, Henderson, NV 89074
$-717
Cash flow
-6.4%
Cash-on-Cash Return
4.2%
Cap rate
0.6%
Rent to Value Ratio
Active
$415,000
2
bds
|
3
ba
|
1,811
sqft
|
built
1996
310 Pissarro Pl, Henderson, NV 89074
$-1,003
Cash flow
-12.6%
Cash-on-Cash Return
2.8%
Cap rate
0.5%
Rent to Value Ratio

Active
$675,000
3
bds
|
2
ba
|
1,674
sqft
|
built
2016
1120 Via Della Curia, Henderson, NV 89011
$-2,009
Cash flow
-15.5%
Cash-on-Cash Return
2.1%
Cap rate
0.4%
Rent to Value Ratio

Active
$777,888
5
bds
|
3
ba
|
2,951
sqft
|
built
1990
2016 Catalina Marie Ave, Henderson, NV 89074
$-1,848
Cash flow
-12.4%
Cash-on-Cash Return
2.8%
Cap rate
0.4%
Rent to Value Ratio

Pending
$399,999
3
bds
|
3
ba
|
1,736
sqft
|
built
2018
2878 Via Firenze, Henderson, NV 89044
$-613
Cash flow
-8.0%
Cash-on-Cash Return
3.8%
Cap rate
0.6%
Rent to Value Ratio
Active
$575,000
4
bds
|
3
ba
|
2,468
sqft
|
built
2024
89 Via Franello, Henderson, NV 89011
$-1,199
Cash flow
-10.9%
Cash-on-Cash Return
3.2%
Cap rate
0.5%
Rent to Value Ratio

Active
$730,000
5
bds
|
4
ba
|
2,816
sqft
|
built
1999
1339 Echo Creek St, Henderson, NV 89052
$-1,763
Cash flow
-12.6%
Cash-on-Cash Return
2.8%
Cap rate
0.4%
Rent to Value Ratio
Pending
$535,000
5
bds
|
3
ba
|
2,944
sqft
|
built
2018
2333 Mundare Dr, Henderson, NV 89002
$-1,154
Cash flow
-11.3%
Cash-on-Cash Return
3.1%
Cap rate
0.5%
Rent to Value Ratio
Active
$335,000
2
bds
|
2
ba
|
1,229
sqft
|
built
2005
23 Hudson Canyon St, Henderson, NV 89012
$-824
Cash flow
-12.8%
Cash-on-Cash Return
2.7%
Cap rate
0.5%
Rent to Value Ratio
Active
$350,000
3
bds
|
3
ba
|
1,527
sqft
|
built
2021
965 Nevada State Dr, Henderson, NV 89002
$-778
Cash flow
-11.6%
Cash-on-Cash Return
3.0%
Cap rate
0.5%
Rent to Value Ratio

Active
$264,444
2
bds
|
2
ba
|
1,151
sqft
|
built
1995
698 S Racetrack Rd, Henderson, NV 89015
$-571
Cash flow
-11.3%
Cash-on-Cash Return
3.1%
Cap rate
0.5%
Rent to Value Ratio

Active
$369,500
3
bds
|
3
ba
|
1,412
sqft
|
built
2008
1525 Spiced Wine Ave, Henderson, NV 89074
$-608
Cash flow
-8.6%
Cash-on-Cash Return
3.7%
Cap rate
0.6%
Rent to Value Ratio

Pending
$359,000
3
bds
|
3
ba
|
1,285
sqft
|
built
1986
165 Spinnaker Dr, Henderson, NV 89015
$-570
Cash flow
-8.3%
Cash-on-Cash Return
3.8%
Cap rate
0.5%
Rent to Value Ratio

Active
$699,000
3
bds
|
3
ba
|
1,905
sqft
|
built
2003
35 Glade Water Dr, Henderson, NV 89052
$-1,590
Cash flow
-11.9%
Cash-on-Cash Return
2.9%
Cap rate
0.5%
Rent to Value Ratio
Active
$749,999
3
bds
|
3
ba
|
2,151
sqft
|
built
2024
80 Cathedral Wash Pl, Henderson, NV 89011
$-2,177
Cash flow
-15.1%
Cash-on-Cash Return
2.2%
Cap rate
0.4%
Rent to Value Ratio
Active
$669,900
4
bds
|
4
ba
|
3,181
sqft
|
built
2015
741 Flowing Meadow Dr, Henderson, NV 89014
$-1,677
Cash flow
-13.1%
Cash-on-Cash Return
2.7%
Cap rate
0.4%
Rent to Value Ratio

Active
$472,500
4
bds
|
2
ba
|
1,799
sqft
|
built
1995
538 Ancient Mayan Dr, Henderson, NV 89015
$-844
Cash flow
-9.3%
Cash-on-Cash Return
3.5%
Cap rate
0.5%
Rent to Value Ratio
Active
$395,000
3
bds
|
2
ba
|
1,273
sqft
|
built
2011
711 Golden Sedum Dr, Henderson, NV 89011
$-811
Cash flow
-10.7%
Cash-on-Cash Return
3.2%
Cap rate
0.5%
Rent to Value Ratio