Henderson, NV Investment Properties for Sale
Browse homes for sale and investment properties in Henderson, NV. Refine your search by price, property type, or more.
Best cash flowing properties in Henderson, NV
Active under contract
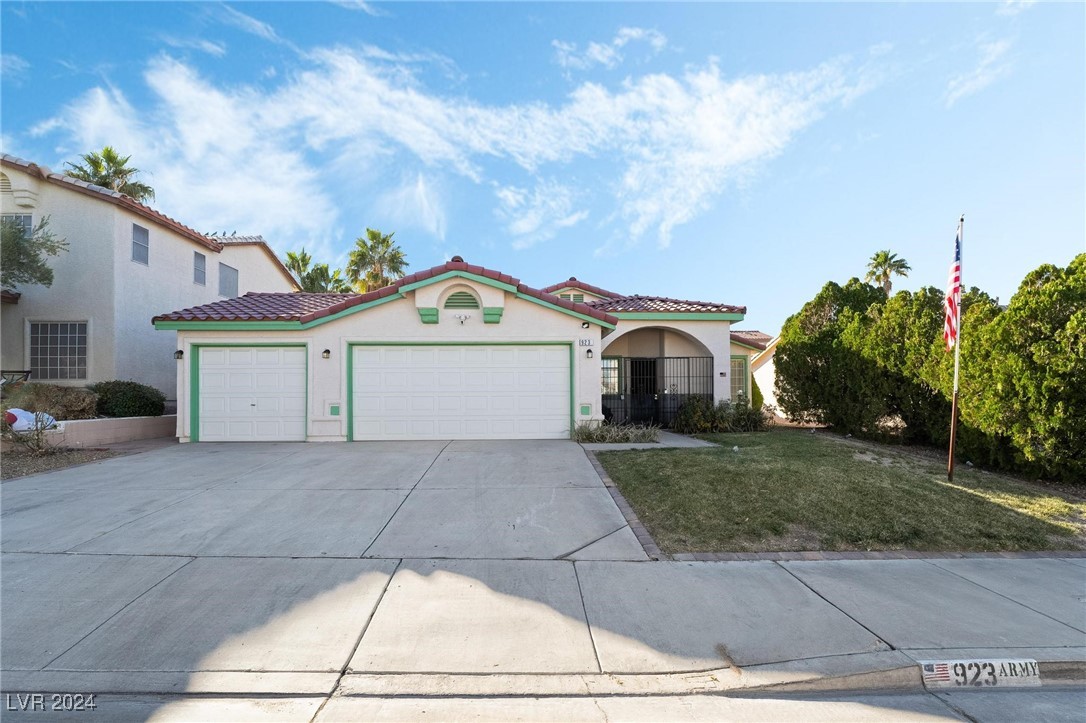
$399,000
4
bds
|
2
ba
|
1,616
sqft
|
built
1994
923 Highland Trails Ave, Henderson, NV 89015
$-407
Cash flow
-5.3%
Cash-on-Cash Return
4.5%
Cap rate
0.6%
Rent to Value Ratio
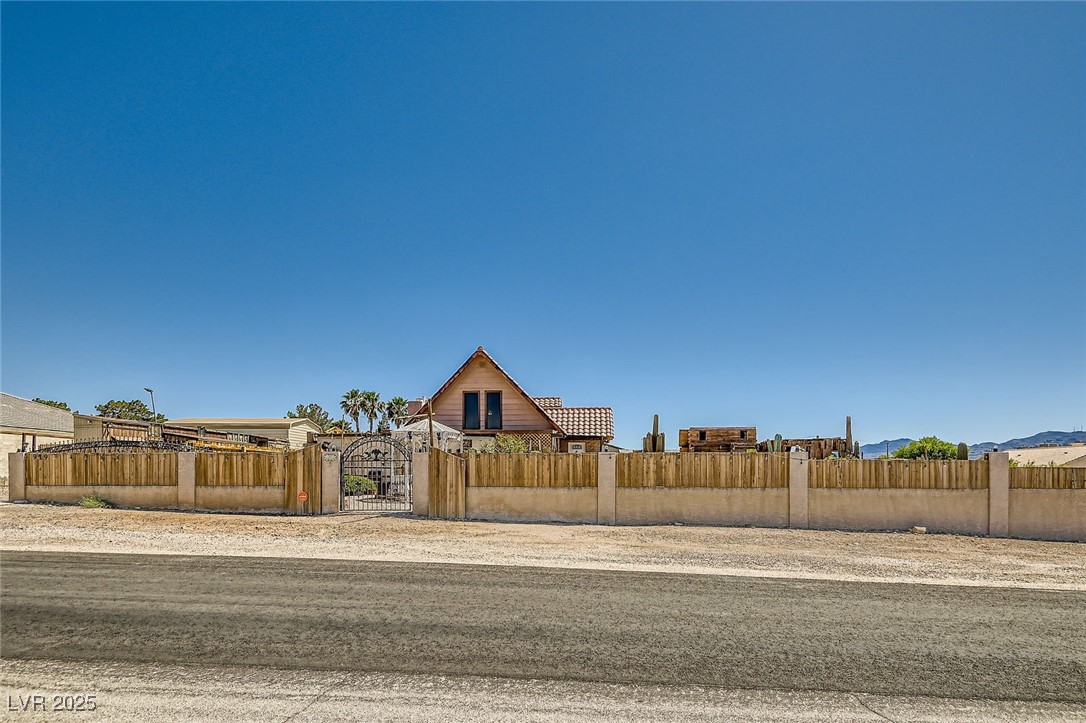
Active under contract
$575,000
3
bds
|
3
ba
|
2,054
sqft
|
built
1982
919 Havre Ave, Henderson, NV 89015
$-459
Cash flow
-4.2%
Cash-on-Cash Return
4.7%
Cap rate
0.6%
Rent to Value Ratio
1,307 out of 1,382 properties for sale in Henderson, NV
Limited Results Shown
Create a free account, or log in to reveal all property listings and enjoy the complete experience.

Active
$369,000
3
bds
|
3
ba
|
1,541
sqft
|
built
2022
965 Nevada State Dr, Henderson, NV 89002
$-853
Cash flow
-12.1%
Cash-on-Cash Return
2.9%
Cap rate
0.5%
Rent to Value Ratio
Active
$355,000
3
bds
|
3
ba
|
1,527
sqft
|
built
2021
965 Nevada State Dr, Henderson, NV 89002
$-871
Cash flow
-12.8%
Cash-on-Cash Return
2.7%
Cap rate
0.5%
Rent to Value Ratio
Active
$749,999
5
bds
|
3
ba
|
2,982
sqft
|
built
1997
820 Sandhill Sage St, Henderson, NV 89052
$-1,614
Cash flow
-11.2%
Cash-on-Cash Return
3.1%
Cap rate
0.4%
Rent to Value Ratio
Active
$415,000
3
bds
|
4
ba
|
2,207
sqft
|
built
2007
1092 Via Corto St, Henderson, NV 89011
$-888
Cash flow
-11.2%
Cash-on-Cash Return
3.1%
Cap rate
0.6%
Rent to Value Ratio
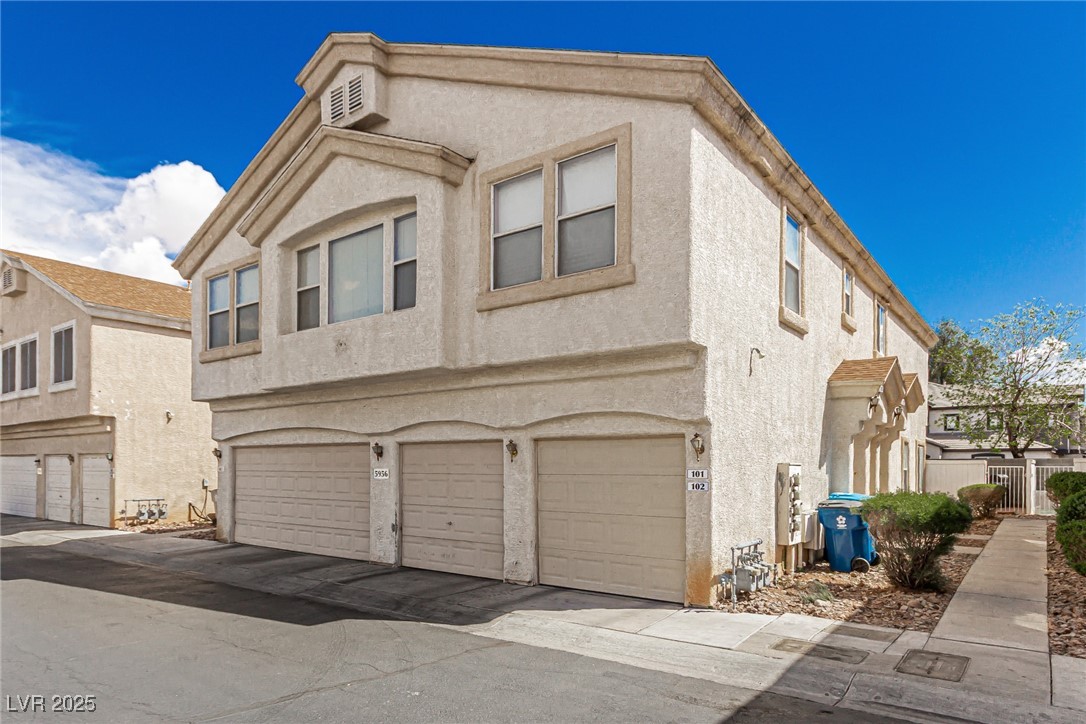
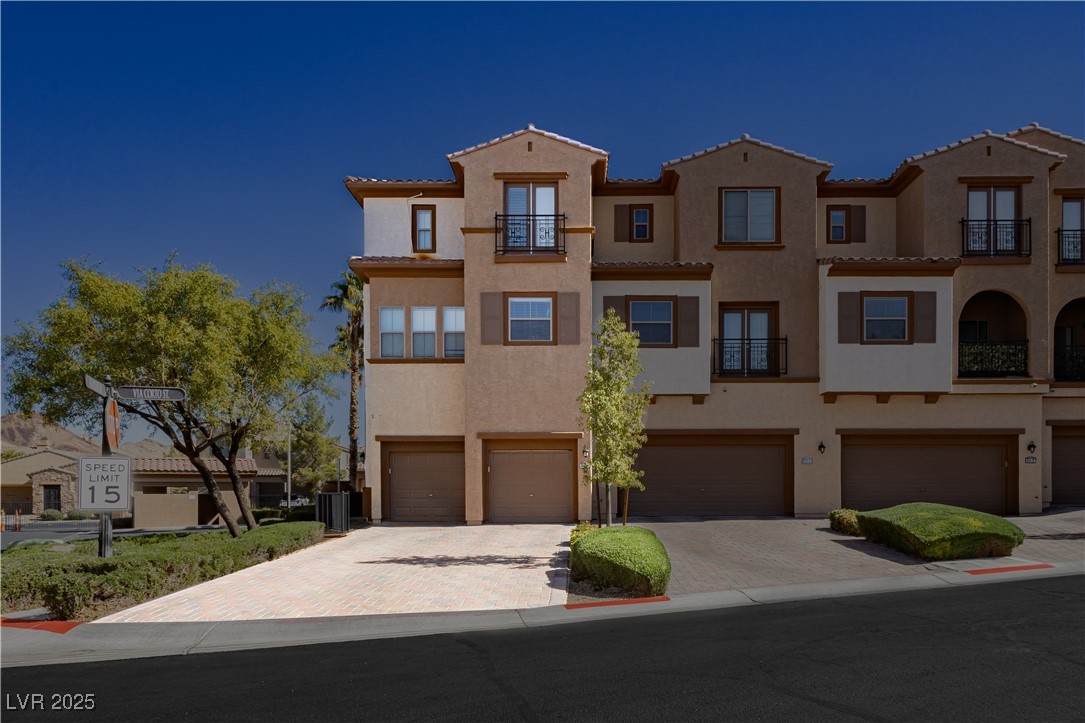
Active under contract
$275,000
2
bds
|
2
ba
|
1,069
sqft
|
built
2001
5948 High Steed St, Henderson, NV 89011
$-564
Cash flow
-10.7%
Cash-on-Cash Return
3.2%
Cap rate
0.5%
Rent to Value Ratio
Active
$499,900
3
bds
|
3
ba
|
1,853
sqft
|
built
2005
2526 Begonia Valley Ave, Henderson, NV 89074
$-892
Cash flow
-9.3%
Cash-on-Cash Return
3.5%
Cap rate
0.5%
Rent to Value Ratio
Active
$559,000
4
bds
|
4
ba
|
2,144
sqft
|
built
2023
2503 Cracked Stone St, Henderson, NV 89044
$-962
Cash flow
-9.0%
Cash-on-Cash Return
3.6%
Cap rate
0.6%
Rent to Value Ratio
Active
$935,000
5
bds
|
3
ba
|
3,862
sqft
|
built
2002
2566 Antique Blossom Ave, Henderson, NV 89052
$-2,183
Cash flow
-12.2%
Cash-on-Cash Return
2.9%
Cap rate
0.4%
Rent to Value Ratio
Active
$1,100,000
3
bds
|
5
ba
|
3,084
sqft
|
built
2014
221 Errogie St, Henderson, NV 89012
$-1,108
Cash flow
-5.3%
Cash-on-Cash Return
4.5%
Cap rate
0.6%
Rent to Value Ratio
Active
$599,900
3
bds
|
3
ba
|
2,503
sqft
|
built
1996
2204 Ambermill Ct, Henderson, NV 89052
$-1,149
Cash flow
-10.0%
Cash-on-Cash Return
3.4%
Cap rate
0.5%
Rent to Value Ratio
Active
$854,000
5
bds
|
4
ba
|
3,052
sqft
|
built
1999
2241 Verde Cape Ave, Henderson, NV 89052
$-2,133
Cash flow
-13.0%
Cash-on-Cash Return
2.7%
Cap rate
0.4%
Rent to Value Ratio
Active
$2,250,000
4
bds
|
5
ba
|
4,025
sqft
|
built
2004
3 Pine Hollow Dr, Henderson, NV 89052
$-6,243
Cash flow
-14.5%
Cash-on-Cash Return
2.3%
Cap rate
0.4%
Rent to Value Ratio
Active
$1,500,000
3
bds
|
2
ba
|
2,184
sqft
|
built
1991
12745 Fairfield Ave, Henderson, NV 89044
$-4,285
Cash flow
-14.9%
Cash-on-Cash Return
2.3%
Cap rate
0.3%
Rent to Value Ratio
Active
$1,100,000
6
bds
|
3
ba
|
3,715
sqft
|
built
2001
394 Gatlinburg Ct, Henderson, NV 89012
$-2,465
Cash flow
-11.7%
Cash-on-Cash Return
3.0%
Cap rate
0.4%
Rent to Value Ratio
Active under contract
$575,000
3
bds
|
3
ba
|
2,054
sqft
|
built
1982
919 Havre Ave, Henderson, NV 89015
$-459
Cash flow
-4.2%
Cash-on-Cash Return
4.7%
Cap rate
0.6%
Rent to Value Ratio
Active under contract
$399,000
4
bds
|
2
ba
|
1,616
sqft
|
built
1994
923 Highland Trails Ave, Henderson, NV 89015
$-407
Cash flow
-5.3%
Cash-on-Cash Return
4.5%
Cap rate
0.6%
Rent to Value Ratio
Active
$374,999
3
bds
|
2
ba
|
1,225
sqft
|
built
2005
457 E Merlayne Dr, Henderson, NV 89011
$-642
Cash flow
-8.9%
Cash-on-Cash Return
3.6%
Cap rate
0.5%
Rent to Value Ratio
Active
$309,000
2
bds
|
2
ba
|
1,126
sqft
|
built
1994
1851 Hillpointe Rd, Henderson, NV 89074
$-533
Cash flow
-9.0%
Cash-on-Cash Return
3.6%
Cap rate
0.6%
Rent to Value Ratio

Active
$238,000
1
bds
|
1
ba
|
704
sqft
|
built
1999
2900 Sunridge Heights Pkwy, Henderson, NV 89052
$-512
Cash flow
-11.2%
Cash-on-Cash Return
3.1%
Cap rate
0.5%
Rent to Value Ratio
Active
$555,000
4
bds
|
3
ba
|
2,605
sqft
|
built
2003
774 Wigan Pier Dr, Henderson, NV 89002
$-1,264
Cash flow
-11.9%
Cash-on-Cash Return
2.9%
Cap rate
0.5%
Rent to Value Ratio
Active
$3,999,995
6
bds
|
8
ba
|
7,690
sqft
|
built
2023
21 Canyon Bay Dr, Henderson, NV 89011
$-13,909
Cash flow
-18.1%
Cash-on-Cash Return
1.5%
Cap rate
0.2%
Rent to Value Ratio
Active
$355,000
2
bds
|
1
ba
|
1,071
sqft
|
built
1989
715 Rusty Spur Dr, Henderson, NV 89014
$-568
Cash flow
-8.3%
Cash-on-Cash Return
3.8%
Cap rate
0.5%
Rent to Value Ratio
Active
$1,099,900
5
bds
|
3
ba
|
3,484
sqft
|
built
2001
1494 Neyland Dr, Henderson, NV 89012
$-1,639
Cash flow
-7.8%
Cash-on-Cash Return
3.9%
Cap rate
0.5%
Rent to Value Ratio
Active
$774,900
5
bds
|
5
ba
|
3,597
sqft
|
built
2000
283 Grand Olympia Dr, Henderson, NV 89012
$-1,586
Cash flow
-10.7%
Cash-on-Cash Return
3.2%
Cap rate
0.5%
Rent to Value Ratio

Active
$490,000
3
bds
|
3
ba
|
2,036
sqft
|
built
2020
1004 Huckburn Ave, Henderson, NV 89015
$-1,084
Cash flow
-11.5%
Cash-on-Cash Return
3.0%
Cap rate
0.5%
Rent to Value Ratio
Active
$949,900
3
bds
|
4
ba
|
1,972
sqft
|
built
2005
12 Via Ravello, Henderson, NV 89011
$-3,204
Cash flow
-17.6%
Cash-on-Cash Return
1.6%
Cap rate
0.3%
Rent to Value Ratio
Active under contract
$507,000
3
bds
|
2
ba
|
1,505
sqft
|
built
1978
386 Summer Creek Ct, Henderson, NV 89002
$-1,167
Cash flow
-12.0%
Cash-on-Cash Return
2.9%
Cap rate
0.4%
Rent to Value Ratio

Active
$799,990
3
bds
|
2
ba
|
2,661
sqft
|
built
2004
2764 Leys Burnett Ave, Henderson, NV 89044
$-1,764
Cash flow
-11.5%
Cash-on-Cash Return
3.0%
Cap rate
0.4%
Rent to Value Ratio
Active
$1,699,000
4
bds
|
3
ba
|
3,846
sqft
|
built
1992
2337 Prometheus Ct, Henderson, NV 89074
$-1,886
Cash flow
-5.8%
Cash-on-Cash Return
4.3%
Cap rate
0.6%
Rent to Value Ratio
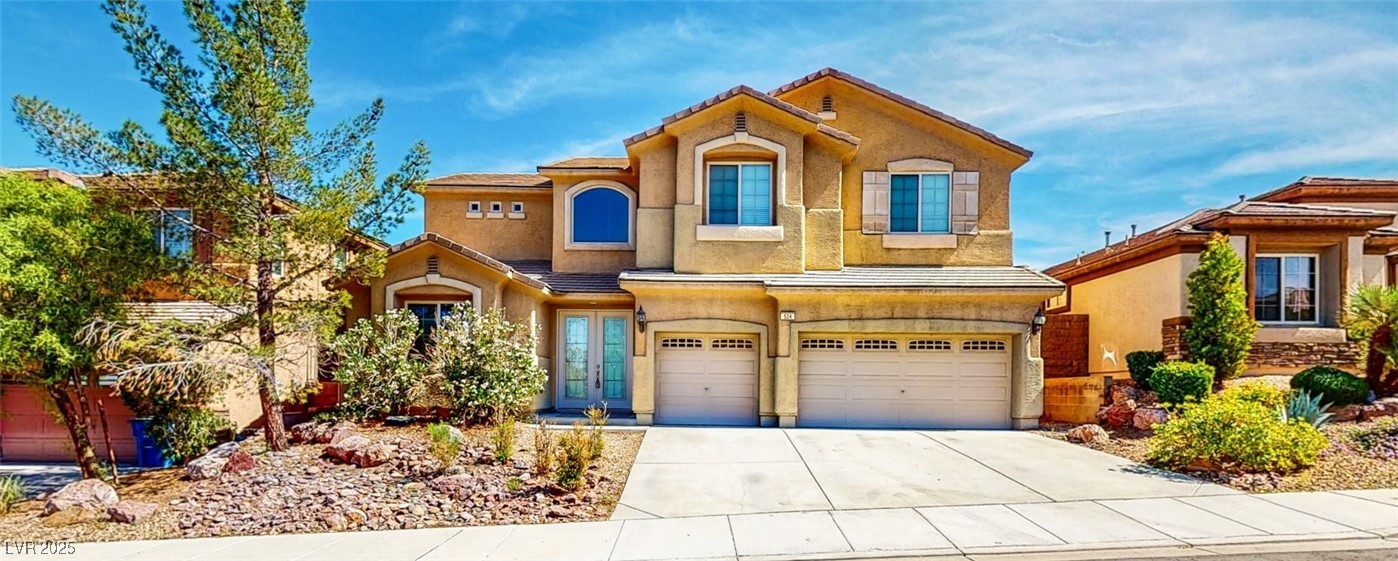
Active
$780,000
5
bds
|
4
ba
|
3,734
sqft
|
built
2006
524 Blanche Ct, Henderson, NV 89052
$-1,669
Cash flow
-11.2%
Cash-on-Cash Return
3.1%
Cap rate
0.4%
Rent to Value Ratio
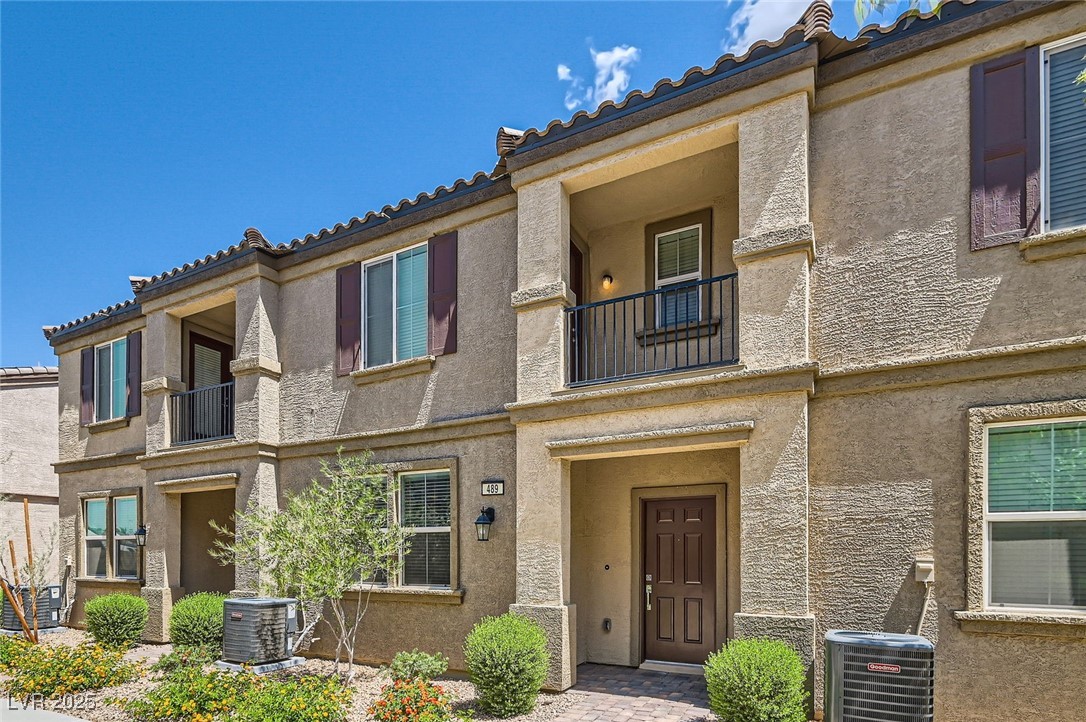
Active
$388,000
3
bds
|
3
ba
|
1,832
sqft
|
built
2021
489 Filaree Pl, Henderson, NV 89015
$-789
Cash flow
-10.6%
Cash-on-Cash Return
3.2%
Cap rate
0.6%
Rent to Value Ratio
Active
$489,000
3
bds
|
3
ba
|
1,824
sqft
|
built
2009
1141 Cactus Rock St, Henderson, NV 89011
$-1,019
Cash flow
-10.9%
Cash-on-Cash Return
3.2%
Cap rate
0.4%
Rent to Value Ratio
Active
$1,350,000
3
bds
|
4
ba
|
2,601
sqft
|
built
2020
103 Reflection Cove Dr, Henderson, NV 89011
$-3,025
Cash flow
-11.7%
Cash-on-Cash Return
3.0%
Cap rate
0.5%
Rent to Value Ratio

Active
$330,000
3
bds
|
2
ba
|
1,159
sqft
|
built
2001
950 Seven Hills Dr, Henderson, NV 89052
$-727
Cash flow
-11.5%
Cash-on-Cash Return
3.0%
Cap rate
0.5%
Rent to Value Ratio
Active
$510,000
4
bds
|
3
ba
|
2,018
sqft
|
built
1996
845 Holly Lake Way, Henderson, NV 89002
$-1,049
Cash flow
-10.7%
Cash-on-Cash Return
3.2%
Cap rate
0.5%
Rent to Value Ratio
Active
$499,000
4
bds
|
3
ba
|
1,936
sqft
|
built
2024
145 Aqua Commons Ln, Henderson, NV 89015
$-1,412
Cash flow
-14.8%
Cash-on-Cash Return
2.3%
Cap rate
0.4%
Rent to Value Ratio
Active
$4,750,000
4
bds
|
6
ba
|
8,107
sqft
|
built
2000
1309 Imperia Dr, Henderson, NV 89052
$-18,629
Cash flow
-20.5%
Cash-on-Cash Return
1.0%
Cap rate
0.2%
Rent to Value Ratio

Active
$3,400,000
5
bds
|
6
ba
|
5,367
sqft
|
built
1996
6 Rue Du Ville Way, Henderson, NV 89011
$-9,191
Cash flow
-14.1%
Cash-on-Cash Return
2.4%
Cap rate
0.4%
Rent to Value Ratio
Active
$760,000
4
bds
|
3
ba
|
2,490
sqft
|
built
2021
28 Verde Rosa Dr, Henderson, NV 89011
$-2,074
Cash flow
-14.2%
Cash-on-Cash Return
2.4%
Cap rate
0.4%
Rent to Value Ratio

Active
$900,000
3
bds
|
3
ba
|
2,331
sqft
|
built
2019
1199 N Water St, Henderson, NV 89011
$-998
Cash flow
-5.8%
Cash-on-Cash Return
4.3%
Cap rate
0.6%
Rent to Value Ratio