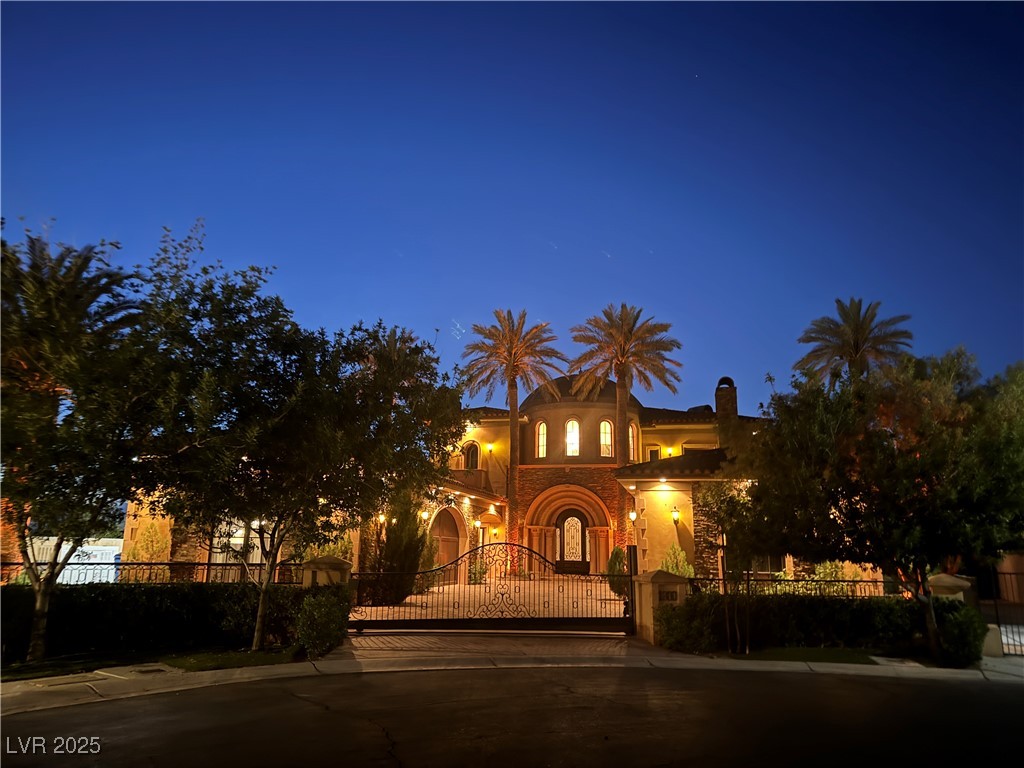
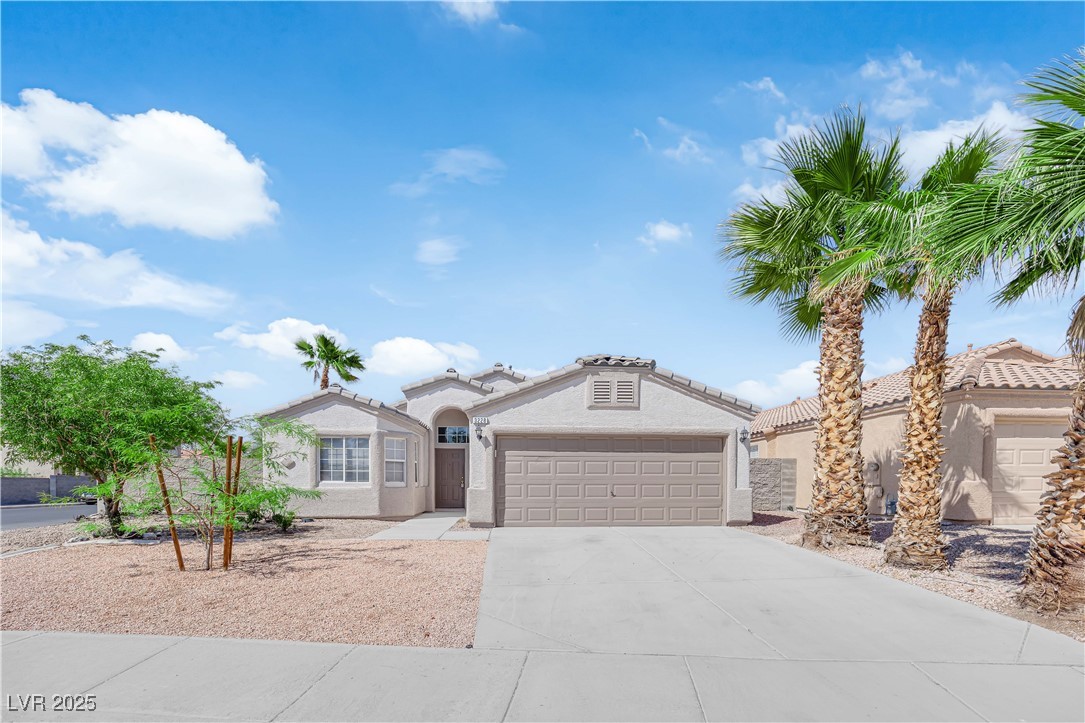
Henderson, NV Investment Properties for Sale
Browse homes for sale and investment properties in Henderson, NV. Refine your search by price, property type, or more.
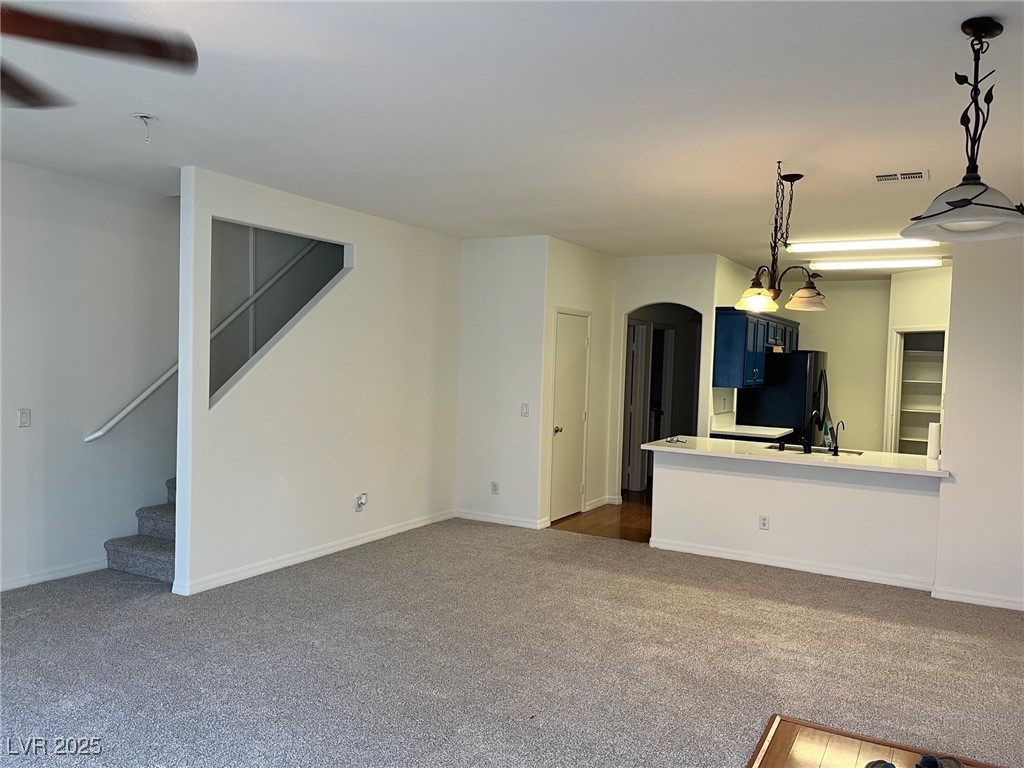
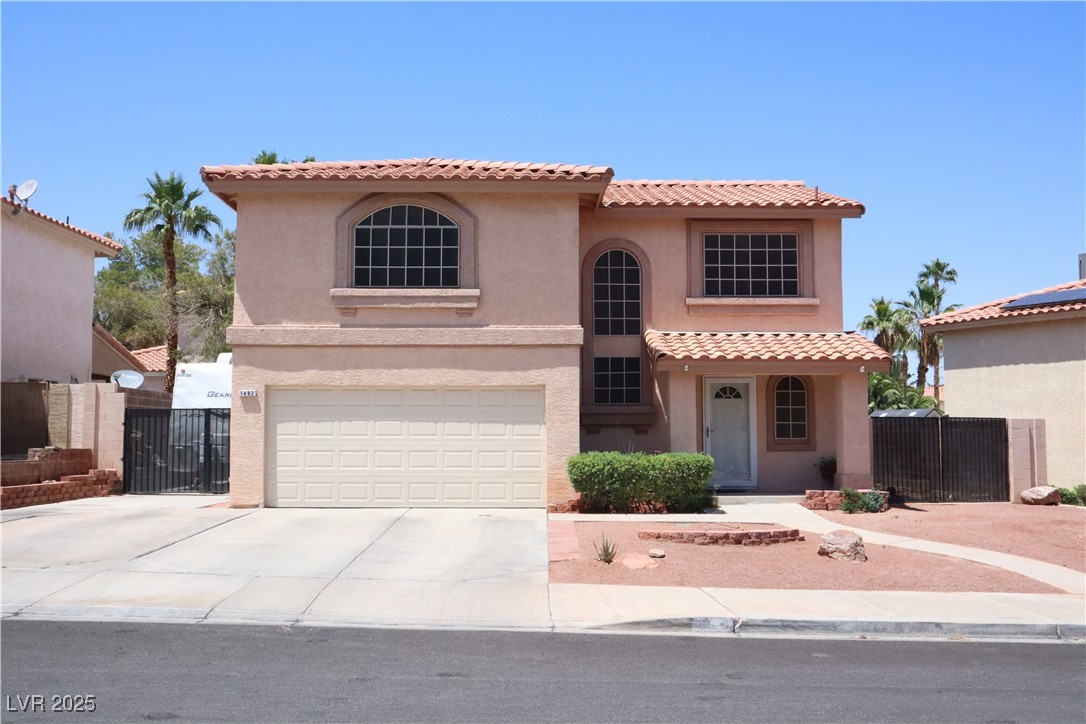
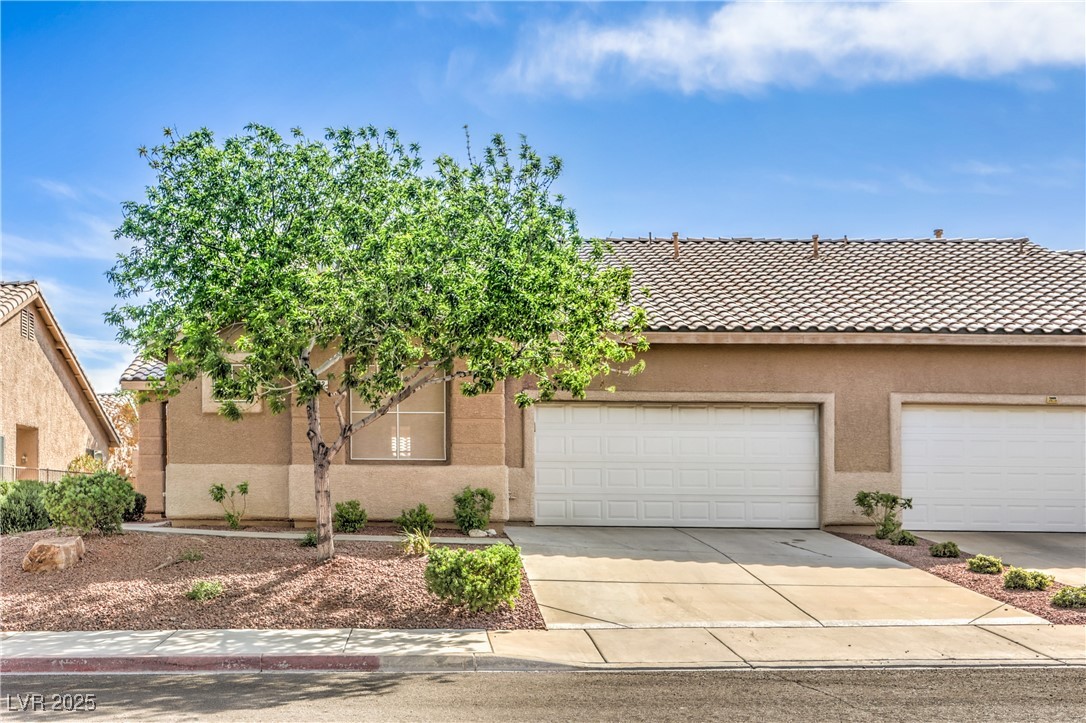
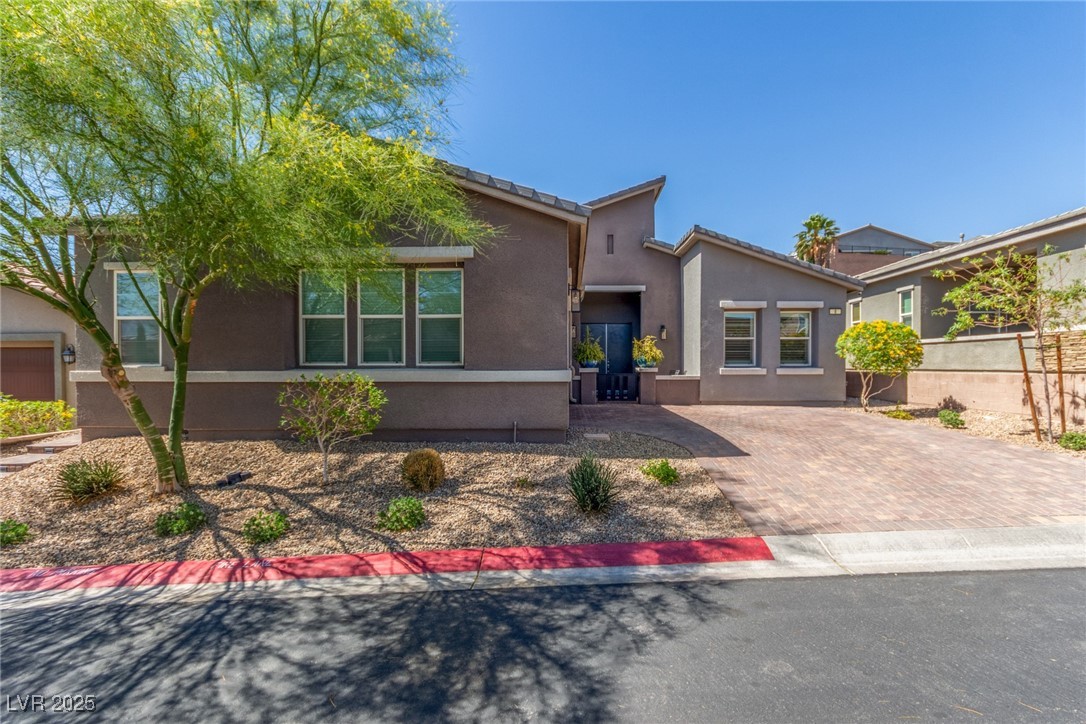
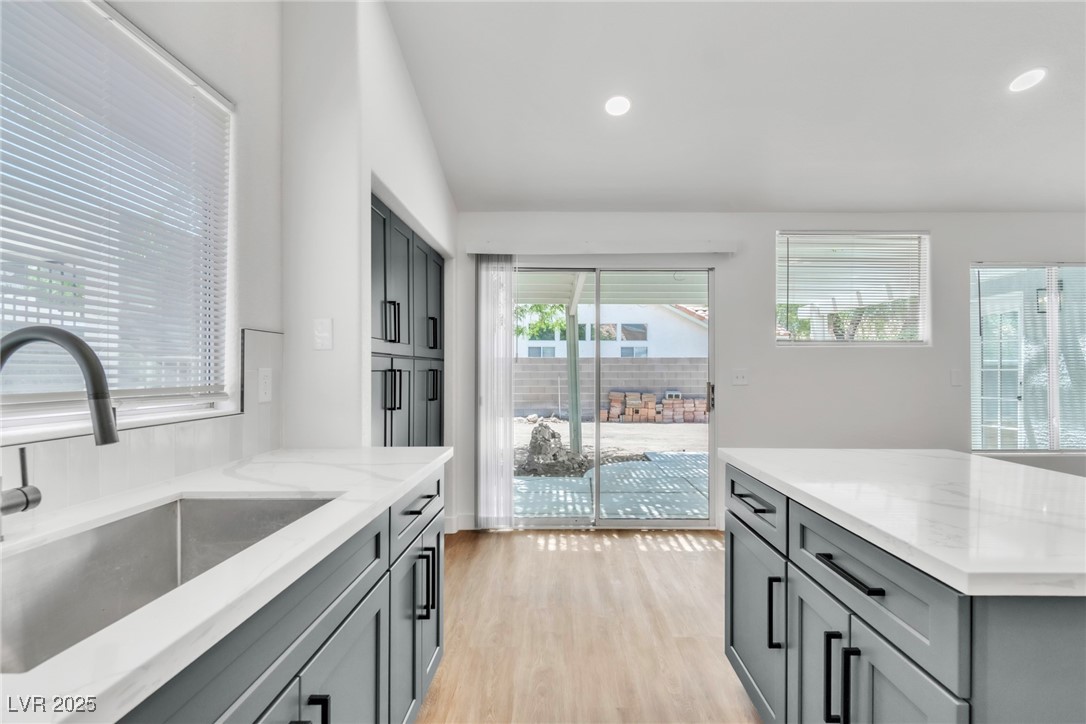
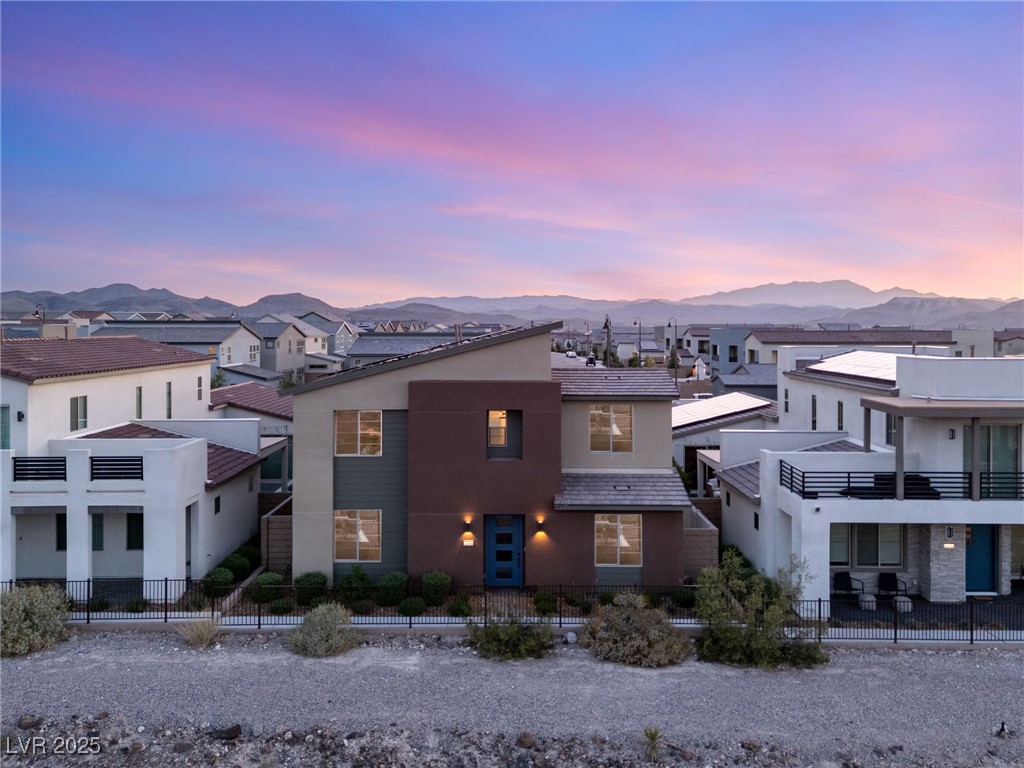
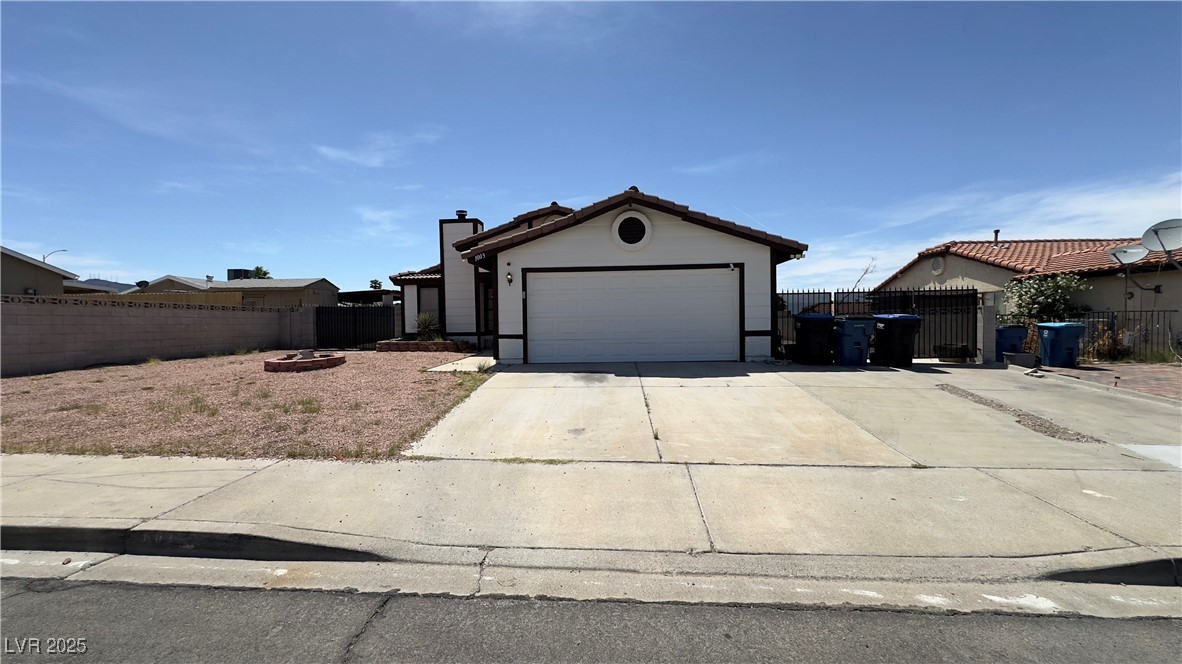
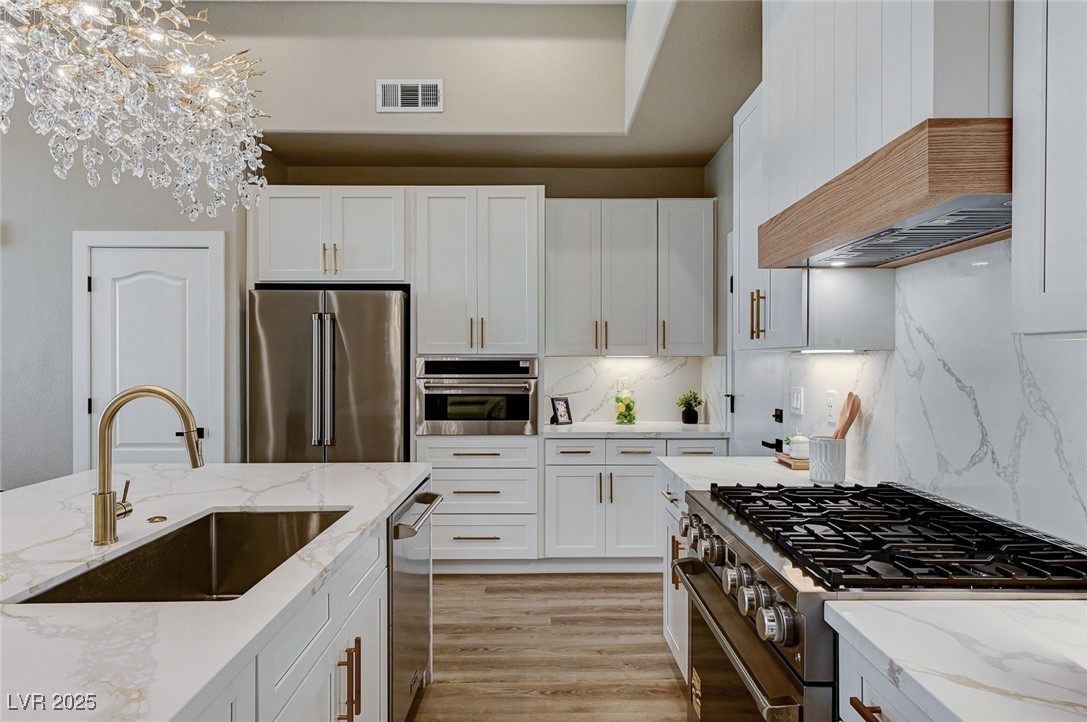
Best cash flowing properties in Henderson, NV
Active
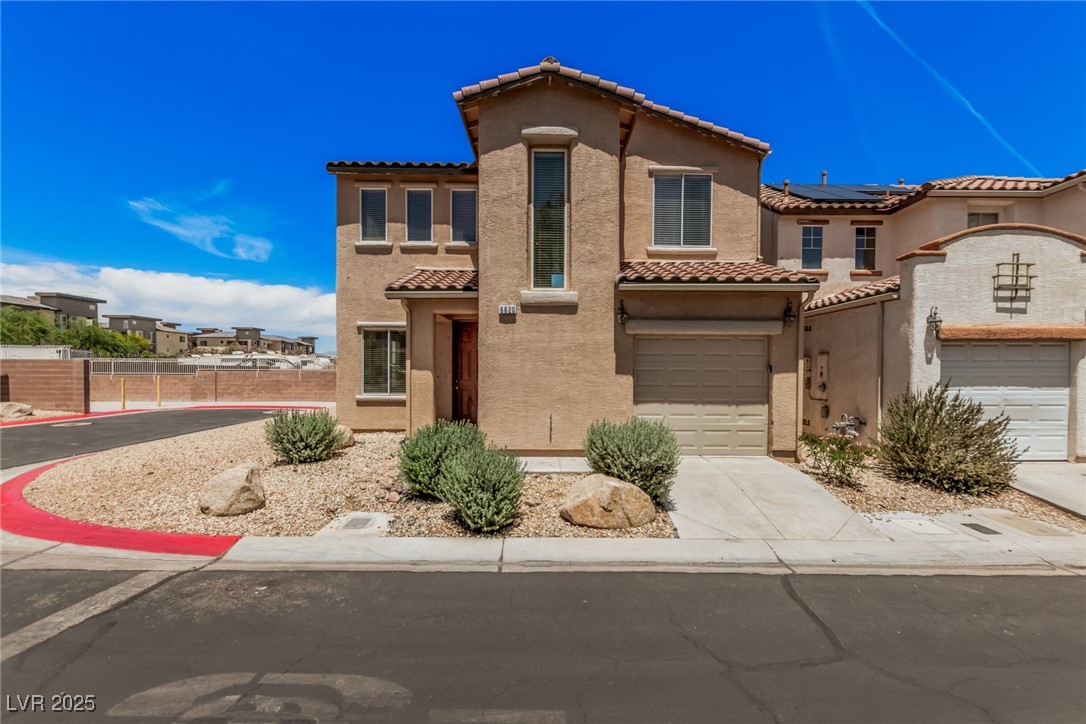
$198,000
1
bds
|
1
ba
|
687
sqft
|
built
1993
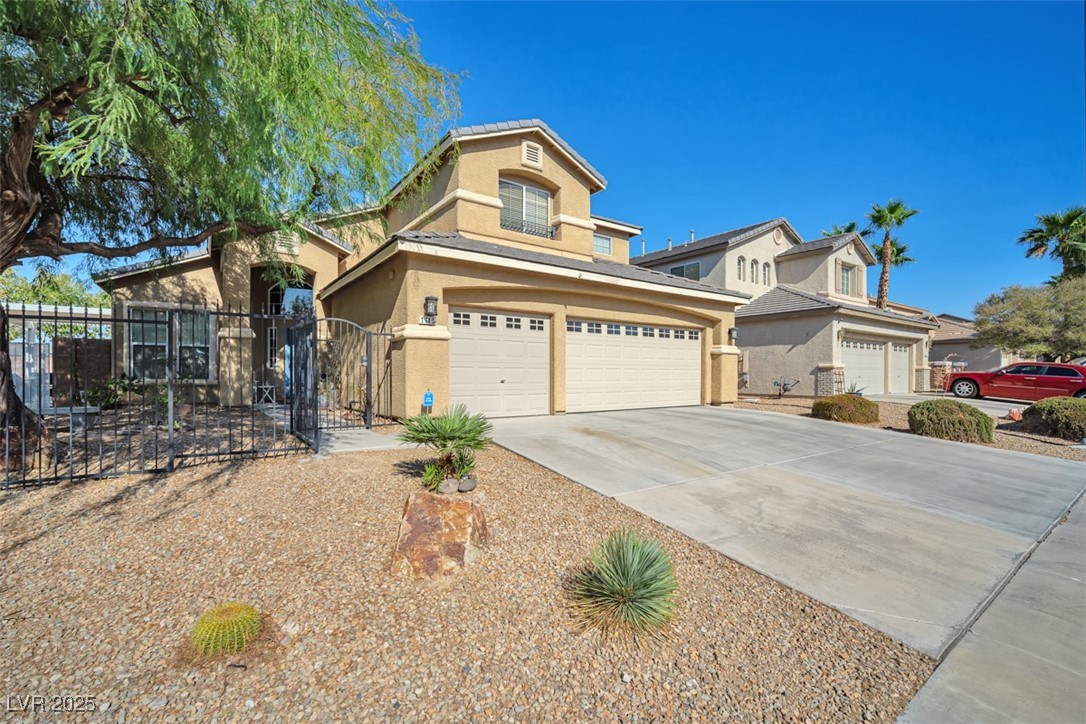
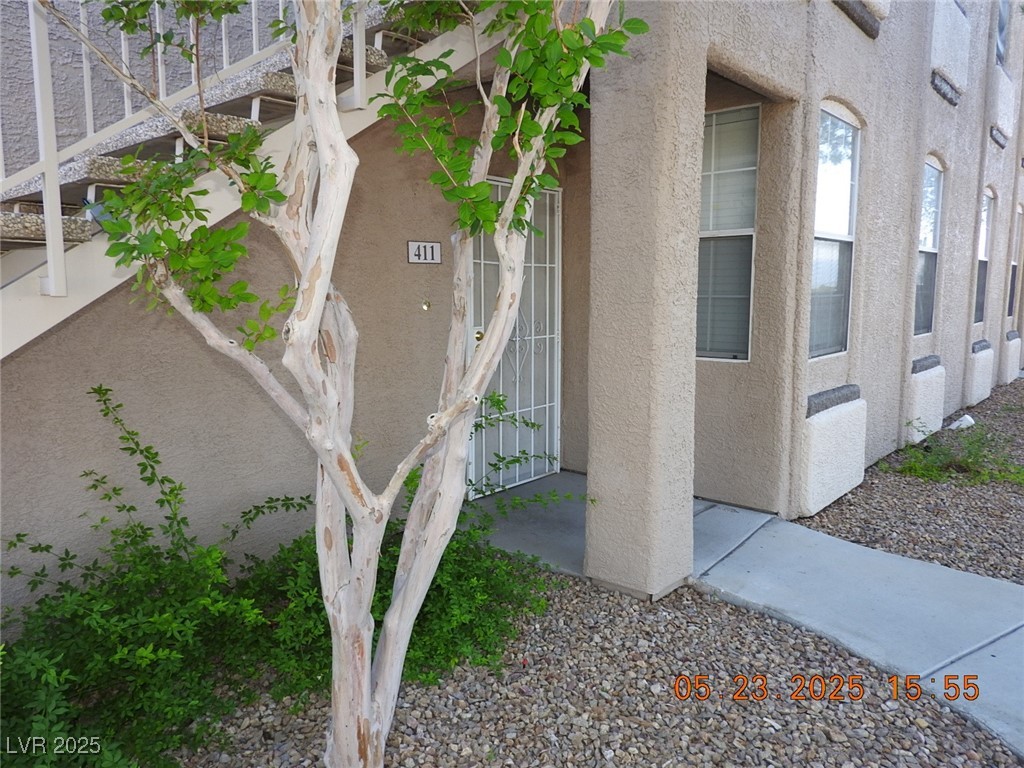
2120 Ramrod Ave, Henderson, NV 89014
$-502
Cash flow
-13.2%
Cash-on-Cash Return
3.2%
Cap rate
0.6%
Rent to Value Ratio
Active
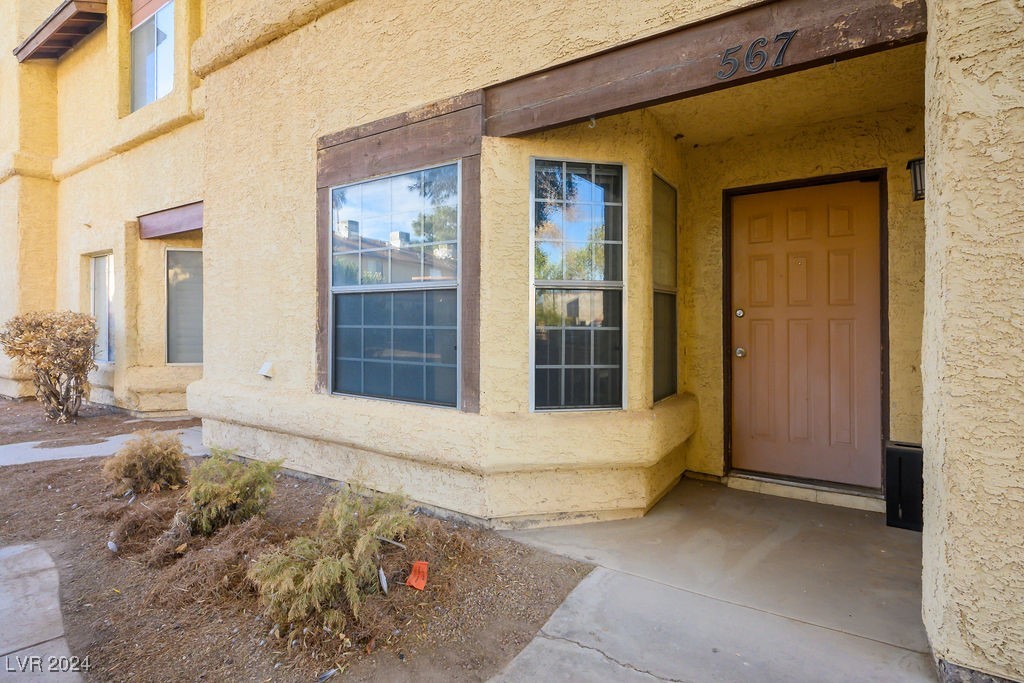
$215,000
2
bds
|
3
ba
|
1,178
sqft
|
built
1986
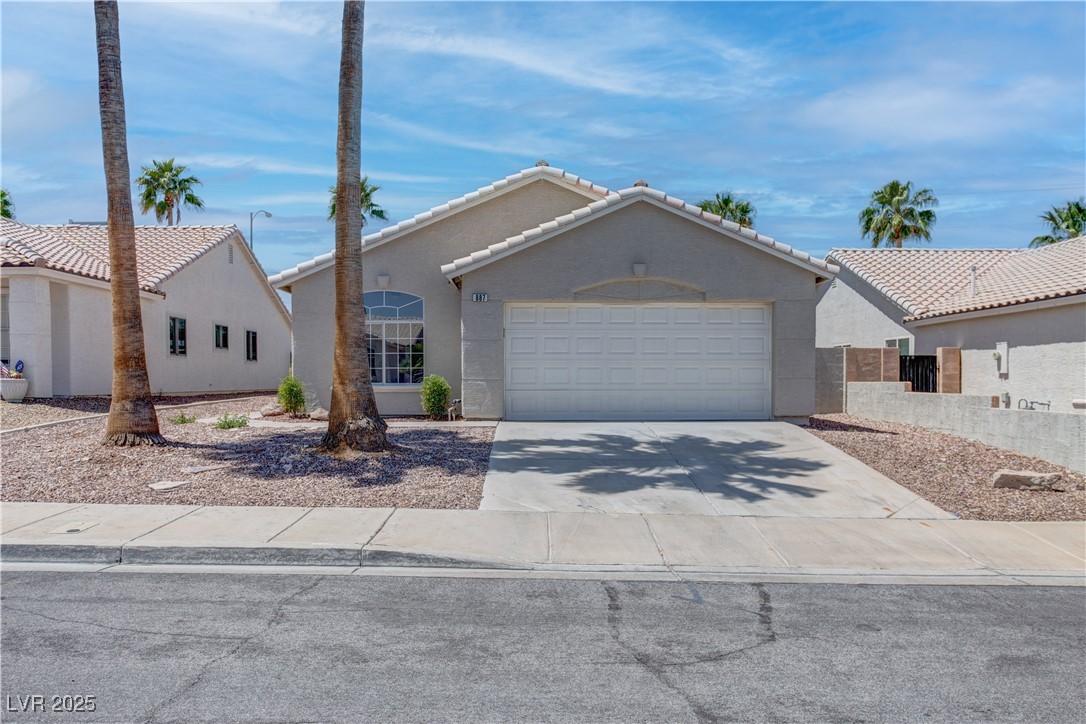
567 Kristin Ln, Henderson, NV 89011
$-528
Cash flow
-12.8%
Cash-on-Cash Return
3.3%
Cap rate
0.7%
Rent to Value Ratio
1,305 out of 1,380 properties for sale in Henderson, NV
Limited Results Shown
Create a free account, or log in to reveal all property listings and enjoy the complete experience.
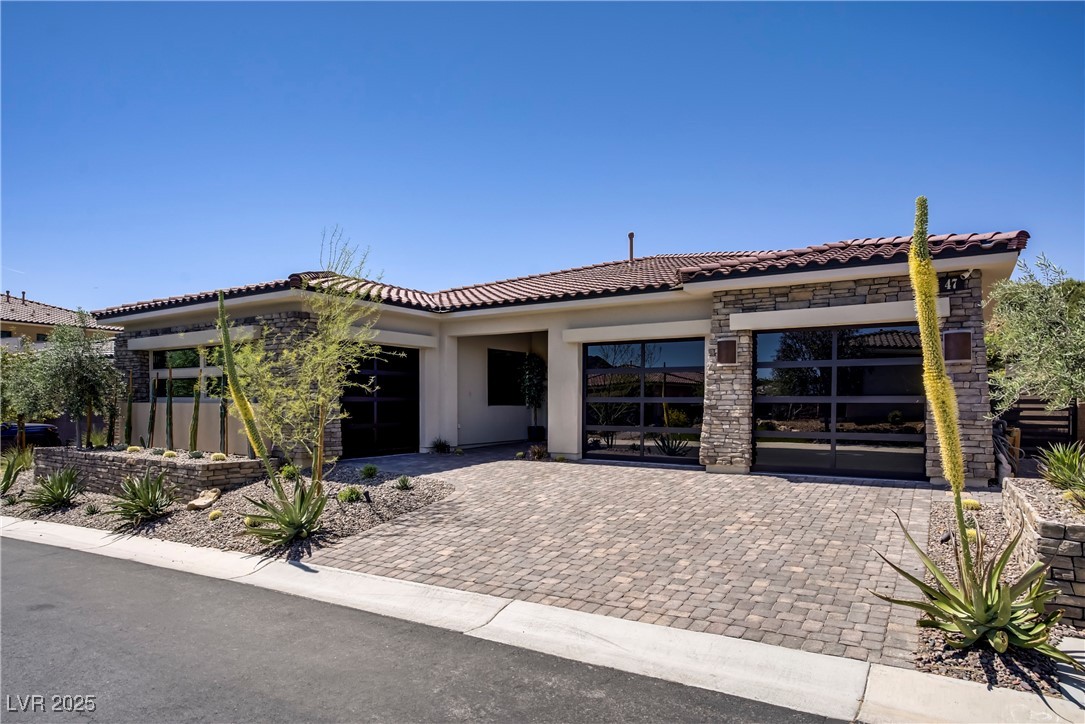
Active under contract
$1,599,999
3
bds
|
4
ba
|
3,264
sqft
|
built
2021
47 Garibaldi Way, Henderson, NV 89011
$-6,649
Cash flow
-21.7%
Cash-on-Cash Return
1.3%
Cap rate
0.3%
Rent to Value Ratio
Active
$743,888
4
bds
|
3
ba
|
2,654
sqft
|
built
1992
8953 Belconte Ln, Henderson, NV 89074
$-1,994
Cash flow
-14.0%
Cash-on-Cash Return
3.1%
Cap rate
0.4%
Rent to Value Ratio
Active
$339,995
3
bds
|
3
ba
|
1,553
sqft
|
built
2003
6462 Saddle Up Ave, Henderson, NV 89011
$-759
Cash flow
-11.6%
Cash-on-Cash Return
3.6%
Cap rate
0.5%
Rent to Value Ratio
Active
$439,900
4
bds
|
3
ba
|
1,573
sqft
|
built
1991
1482 Flintrock Rd, Henderson, NV 89014
$-1,069
Cash flow
-12.7%
Cash-on-Cash Return
3.4%
Cap rate
0.5%
Rent to Value Ratio
Active
$389,900
3
bds
|
2
ba
|
1,438
sqft
|
built
2001
202 Twin Creek St, Henderson, NV 89074
$-1,115
Cash flow
-14.9%
Cash-on-Cash Return
2.9%
Cap rate
0.5%
Rent to Value Ratio
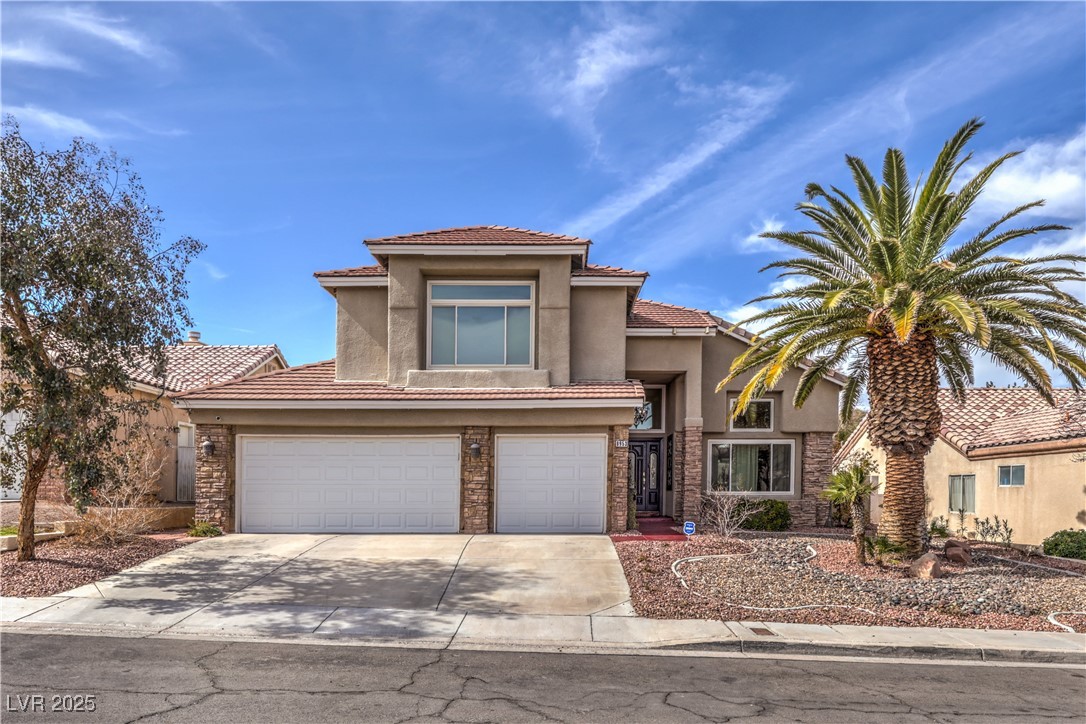
Active
$1,099,999
4
bds
|
4
ba
|
3,123
sqft
|
built
2018
8 Via Tiberina, Henderson, NV 89011
$-3,630
Cash flow
-17.2%
Cash-on-Cash Return
2.3%
Cap rate
0.4%
Rent to Value Ratio
Active
$365,000
3
bds
|
3
ba
|
1,534
sqft
|
built
2005
6620 Tulip Falls Dr, Henderson, NV 89011
$-800
Cash flow
-11.4%
Cash-on-Cash Return
3.7%
Cap rate
0.5%
Rent to Value Ratio
Active
$520,000
3
bds
|
3
ba
|
2,040
sqft
|
built
2020
3531 Montepulciano Ln, Henderson, NV 89044
$-1,404
Cash flow
-14.1%
Cash-on-Cash Return
3.0%
Cap rate
0.5%
Rent to Value Ratio
Active
$1,450,000
5
bds
|
5
ba
|
4,575
sqft
|
built
2016
2400 Trissino Ct, Henderson, NV 89044
$-5,337
Cash flow
-19.2%
Cash-on-Cash Return
1.9%
Cap rate
0.3%
Rent to Value Ratio
Active
$3,249,000
5
bds
|
6
ba
|
6,606
sqft
|
built
2007
6 Yorkridge Ct, Henderson, NV 89052
$-12,009
Cash flow
-19.3%
Cash-on-Cash Return
1.8%
Cap rate
0.3%
Rent to Value Ratio
Active
$689,999
4
bds
|
3
ba
|
2,661
sqft
|
built
2006
1740 Flores Ln, Henderson, NV 89012
$-1,856
Cash flow
-14.0%
Cash-on-Cash Return
3.1%
Cap rate
0.4%
Rent to Value Ratio
Active
$420,000
3
bds
|
2
ba
|
1,303
sqft
|
built
1998
887 Cozy Valley St, Henderson, NV 89015
$-849
Cash flow
-10.5%
Cash-on-Cash Return
3.9%
Cap rate
0.5%
Rent to Value Ratio
Active under contract
$1,775,000
5
bds
|
4
ba
|
4,591
sqft
|
built
2002
1737 Cypress Manor Dr, Henderson, NV 89012
$-3,970
Cash flow
-11.7%
Cash-on-Cash Return
3.6%
Cap rate
0.5%
Rent to Value Ratio
Active
$495,000
3
bds
|
2
ba
|
1,681
sqft
|
built
1988
234 Geronimo Ct, Henderson, NV 89074
$-1,248
Cash flow
-13.2%
Cash-on-Cash Return
3.3%
Cap rate
0.4%
Rent to Value Ratio
Active
$454,900
4
bds
|
2
ba
|
1,598
sqft
|
built
1995
831 Purple Sage Ter, Henderson, NV 89015
$-1,287
Cash flow
-14.8%
Cash-on-Cash Return
2.9%
Cap rate
0.4%
Rent to Value Ratio
Active
$995,000
4
bds
|
4
ba
|
3,245
sqft
|
built
2022
2578 Skylark Trail St, Henderson, NV 89044
$-3,240
Cash flow
-17.0%
Cash-on-Cash Return
2.4%
Cap rate
0.4%
Rent to Value Ratio

Pending
$639,999
4
bds
|
3
ba
|
2,283
sqft
|
built
1997
2549 Sundew Ave, Henderson, NV 89052
$-1,603
Cash flow
-13.1%
Cash-on-Cash Return
3.3%
Cap rate
0.5%
Rent to Value Ratio
Active
$389,999
3
bds
|
2
ba
|
1,070
sqft
|
built
1986
1003 Palo Verde Dr, Henderson, NV 89015
$-889
Cash flow
-11.9%
Cash-on-Cash Return
3.5%
Cap rate
0.5%
Rent to Value Ratio
Active
$819,800
4
bds
|
2
ba
|
2,369
sqft
|
built
2001
2714 Langlade Ave, Henderson, NV 89052
$-2,641
Cash flow
-16.8%
Cash-on-Cash Return
2.4%
Cap rate
0.4%
Rent to Value Ratio
Active
$279,900
2
bds
|
2
ba
|
1,080
sqft
|
built
1997
75 N Valle Verde Dr, Henderson, NV 89074
$-802
Cash flow
-14.9%
Cash-on-Cash Return
2.8%
Cap rate
0.6%
Rent to Value Ratio
Active
$414,900
3
bds
|
3
ba
|
1,939
sqft
|
built
2019
1040 Via Panfilo Ave, Henderson, NV 89011
$-1,044
Cash flow
-13.1%
Cash-on-Cash Return
3.3%
Cap rate
0.6%
Rent to Value Ratio
Active
$799,000
4
bds
|
4
ba
|
3,096
sqft
|
built
1989
2104 Inverness Dr, Henderson, NV 89074
$-2,139
Cash flow
-14.0%
Cash-on-Cash Return
3.1%
Cap rate
0.4%
Rent to Value Ratio
Active
$539,999
4
bds
|
3
ba
|
2,122
sqft
|
built
1994
59 Desert Dawn Ln, Henderson, NV 89074
$-1,309
Cash flow
-12.6%
Cash-on-Cash Return
3.4%
Cap rate
0.5%
Rent to Value Ratio
Active
$330,000
2
bds
|
2
ba
|
1,111
sqft
|
built
2021
965 Nevada State Dr, Henderson, NV 89002
$-959
Cash flow
-15.2%
Cash-on-Cash Return
2.8%
Cap rate
0.5%
Rent to Value Ratio
Active
$499,900
3
bds
|
2
ba
|
1,928
sqft
|
built
2004
2970 Strathspey Ct, Henderson, NV 89044
$-1,301
Cash flow
-13.6%
Cash-on-Cash Return
3.2%
Cap rate
0.5%
Rent to Value Ratio
Pending
$1,250,000
6
bds
|
3
ba
|
4,250
sqft
|
built
1983
1227 San Gabriel Ave, Henderson, NV 89002
$-4,984
Cash flow
-20.8%
Cash-on-Cash Return
1.5%
Cap rate
0.2%
Rent to Value Ratio
Active
$215,000
2
bds
|
3
ba
|
1,178
sqft
|
built
1986
567 Kristin Ln, Henderson, NV 89011
$-528
Cash flow
-12.8%
Cash-on-Cash Return
3.3%
Cap rate
0.7%
Rent to Value Ratio
Active
$965,000
4
bds
|
4
ba
|
3,096
sqft
|
built
1990
217 Windsong Dr, Henderson, NV 89074
$-3,116
Cash flow
-16.8%
Cash-on-Cash Return
2.4%
Cap rate
0.4%
Rent to Value Ratio
Active
$539,999
4
bds
|
3
ba
|
2,514
sqft
|
built
2019
632 Comodo St, Henderson, NV 89011
$-1,133
Cash flow
-10.9%
Cash-on-Cash Return
3.8%
Cap rate
0.6%
Rent to Value Ratio
Pending
$650,000
4
bds
|
4
ba
|
2,545
sqft
|
built
1999
1367 Minuet St, Henderson, NV 89052
$-1,771
Cash flow
-14.2%
Cash-on-Cash Return
3.0%
Cap rate
0.4%
Rent to Value Ratio
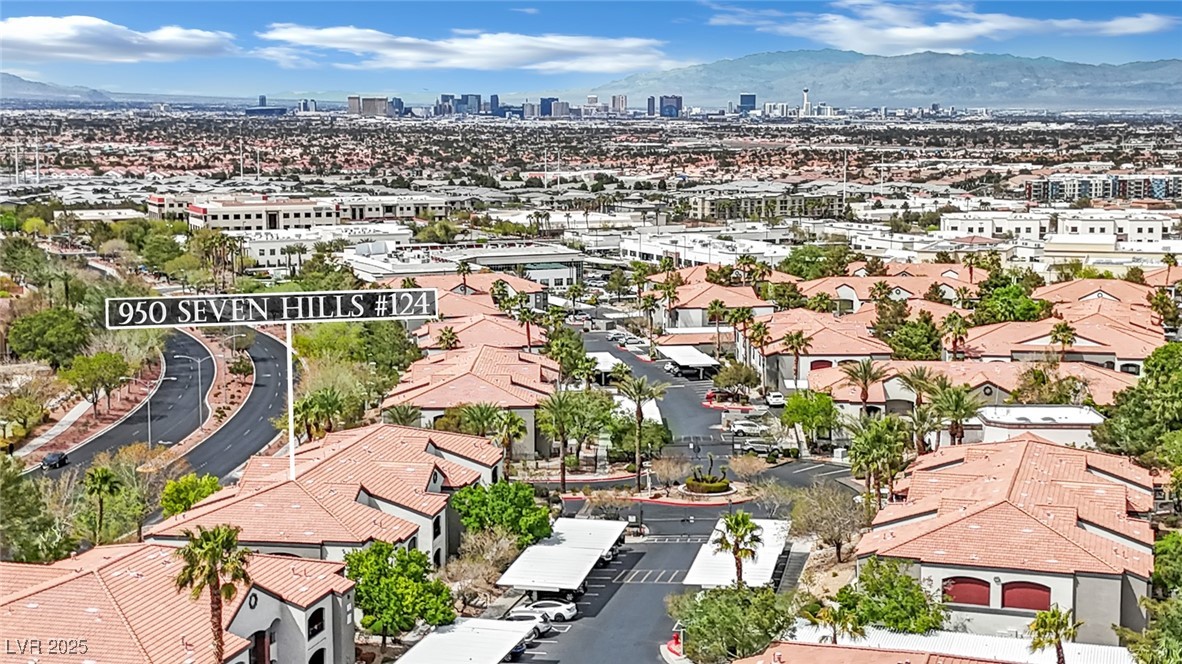
Active
$245,000
1
bds
|
1
ba
|
660
sqft
|
built
2001
950 Seven Hills Dr, Henderson, NV 89052
$-691
Cash flow
-14.7%
Cash-on-Cash Return
2.9%
Cap rate
0.6%
Rent to Value Ratio
Active
$859,995
4
bds
|
3
ba
|
2,851
sqft
|
built
1991
1144 Calico Ridge Dr, Henderson, NV 89011
$-2,889
Cash flow
-17.5%
Cash-on-Cash Return
2.3%
Cap rate
0.3%
Rent to Value Ratio
Active
$460,000
3
bds
|
3
ba
|
2,161
sqft
|
built
2004
632 Monument Point St, Henderson, NV 89002
$-1,093
Cash flow
-12.4%
Cash-on-Cash Return
3.4%
Cap rate
0.5%
Rent to Value Ratio
Active
$438,200
3
bds
|
2
ba
|
1,587
sqft
|
built
1995
735 Wolf Point St, Henderson, NV 89002
$-1,062
Cash flow
-12.6%
Cash-on-Cash Return
3.4%
Cap rate
0.5%
Rent to Value Ratio
Active
$1,099,995
5
bds
|
5
ba
|
4,178
sqft
|
built
2015
2497 Birch Hollow St, Henderson, NV 89044
$-3,351
Cash flow
-15.9%
Cash-on-Cash Return
2.6%
Cap rate
0.4%
Rent to Value Ratio
Active
$650,000
5
bds
|
4
ba
|
2,927
sqft
|
built
2017
1425 Overseer Ave, Henderson, NV 89074
$-1,867
Cash flow
-15.0%
Cash-on-Cash Return
2.8%
Cap rate
0.4%
Rent to Value Ratio
Active
$3,500,000
5
bds
|
6
ba
|
6,649
sqft
|
built
2007
1800 Amarone Way, Henderson, NV 89012
$-11,537
Cash flow
-17.2%
Cash-on-Cash Return
2.3%
Cap rate
0.4%
Rent to Value Ratio
Active
$529,900
3
bds
|
2
ba
|
1,612
sqft
|
built
2000
3228 Jumping Hills Ave, Henderson, NV 89052
$-1,616
Cash flow
-15.9%
Cash-on-Cash Return
2.6%
Cap rate
0.4%
Rent to Value Ratio
Active
$198,000
1
bds
|
1
ba
|
687
sqft
|
built
1993
2120 Ramrod Ave, Henderson, NV 89014
$-502
Cash flow
-13.2%
Cash-on-Cash Return
3.2%
Cap rate
0.6%
Rent to Value Ratio
Active
$399,990
4
bds
|
2
ba
|
1,460
sqft
|
built
1942
343 W Basic Rd, Henderson, NV 89015
$-890
Cash flow
-11.6%
Cash-on-Cash Return
3.6%
Cap rate
0.5%
Rent to Value Ratio