Illinois Investment Properties for Sale
Browse homes for sale and investment properties in Illinois. Refine your search by price, property type, or more.
Best cash flowing properties in Illinois
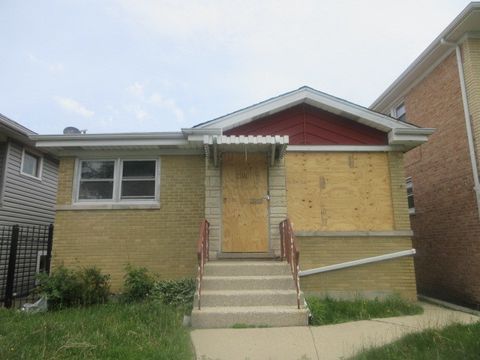
Active
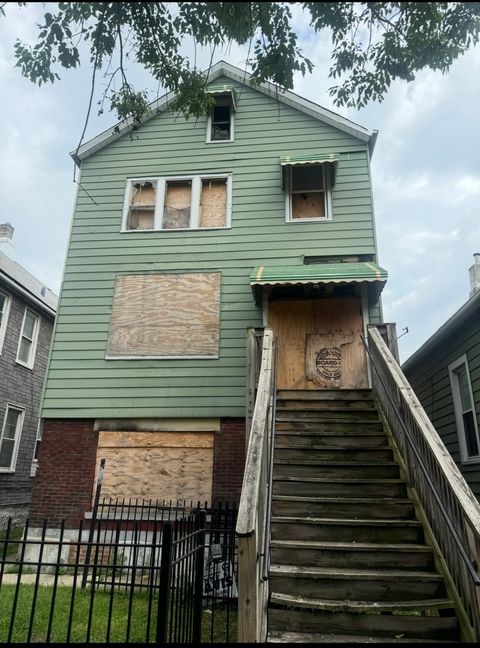
$100,000
9
bds
|
3
ba
|
0
sqft
|
built
1888
5427 S Princeton Ave, Chicago, IL 60609
$1,353
Cash flow
70.6%
Cash-on-Cash Return
21.9%
Cap rate
2.8%
Rent to Value Ratio
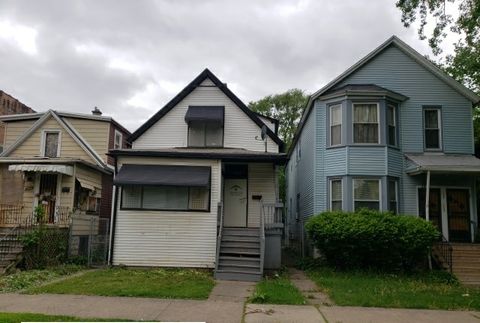
Active
$66,900
4
bds
|
2
ba
|
1,248
sqft
|
built
1898
11842 S State St, Chicago, IL 60628
$1,336
Cash flow
23.3%
Cash-on-Cash Return
24.0%
Cap rate
3.0%
Rent to Value Ratio
7,520 out of 11,269 properties for sale in Illinois
Limited Results Shown
Create a free account, or log in to reveal all property listings and enjoy the complete experience.

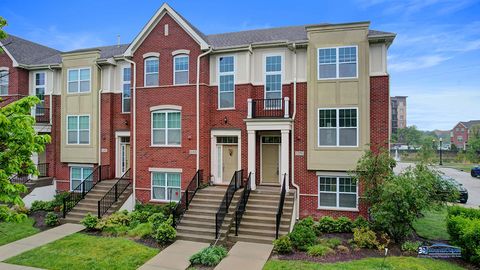
Active
$229,900
3
bds
|
1
ba
|
1,104
sqft
|
built
1948
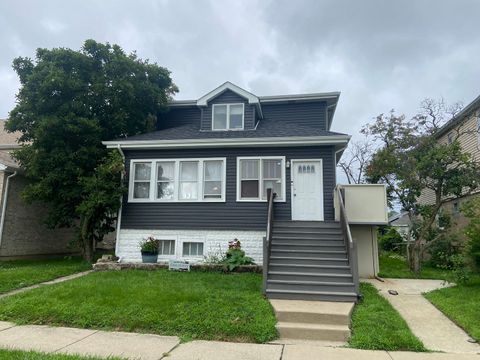
1503 Cherokee Dr, Round Lake Beach, IL 60073
$-306
Cash flow
-6.9%
Cash-on-Cash Return
4.1%
Cap rate
0.8%
Rent to Value Ratio
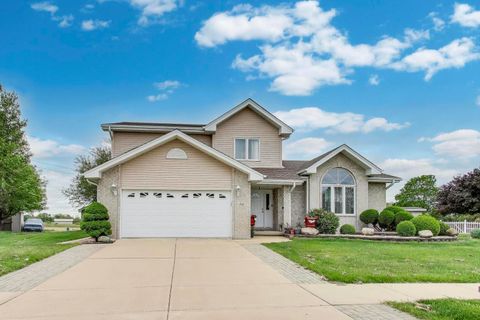
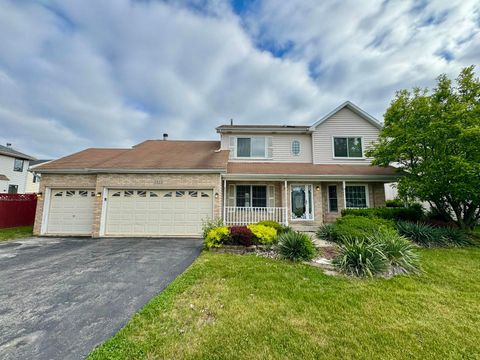
Active
$420,000
4
bds
|
4
ba
|
2,773
sqft
|
built
2005
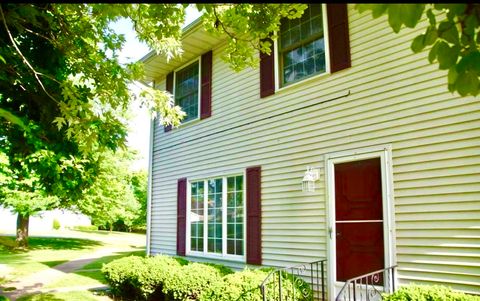
1347 Rainbow Cir, Manteno, IL 60950
$-1,476
Cash flow
-18.3%
Cash-on-Cash Return
1.5%
Cap rate
0.5%
Rent to Value Ratio
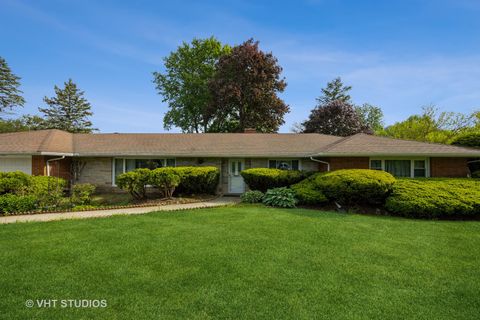
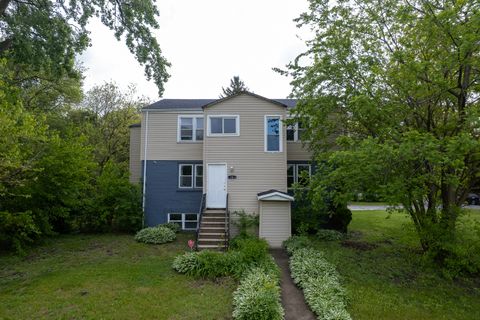
Active
$375,000
4
bds
|
3
ba
|
2,398
sqft
|
built
1952
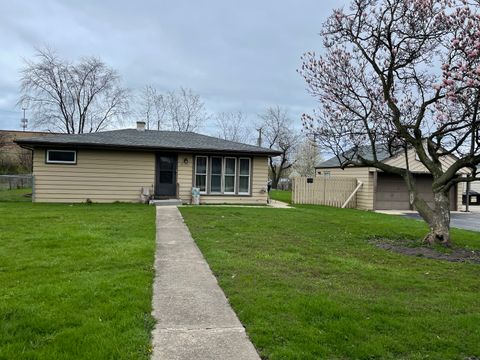
1715 W Main St, Sleepy Hollow, IL 60118
$-226
Cash flow
-3.1%
Cash-on-Cash Return
5.0%
Cap rate
0.9%
Rent to Value Ratio
Active
$98,000
3
bds
|
1
ba
|
1,636
sqft
|
built
1908
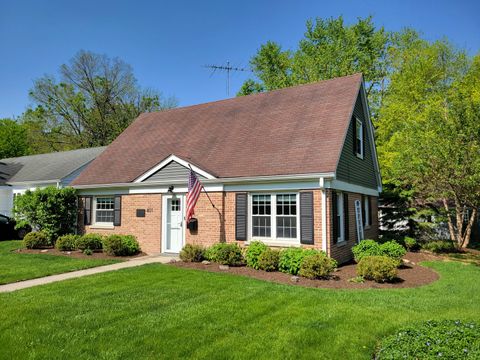
603 7th Ave, Sterling, IL 61081
$312
Cash flow
16.6%
Cash-on-Cash Return
9.5%
Cap rate
1.3%
Rent to Value Ratio

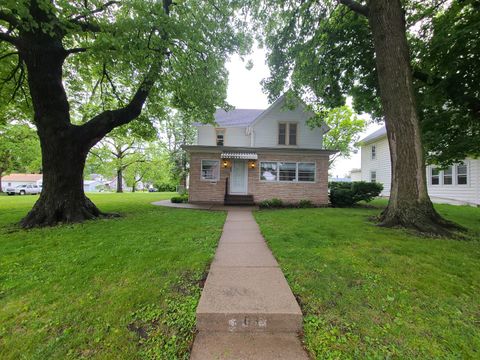
Active
$339,000
5
bds
|
3
ba
|
2,718
sqft
|
built
1881
321 E Chamberlin St, Dixon, IL 61021
$-682
Cash flow
-10.5%
Cash-on-Cash Return
3.3%
Cap rate
0.6%
Rent to Value Ratio
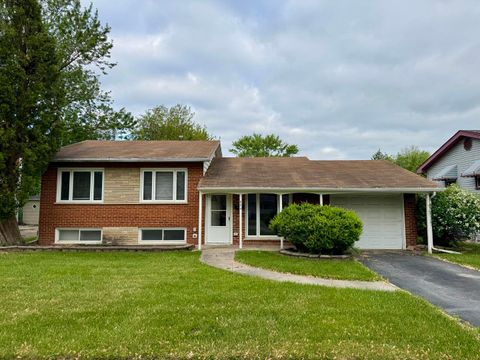
Active
$211,000
3
bds
|
3
ba
|
1,044
sqft
|
built
1961
824 Dartmouth Ave, Matteson, IL 60443
$150
Cash flow
3.7%
Cash-on-Cash Return
6.5%
Cap rate
1.1%
Rent to Value Ratio
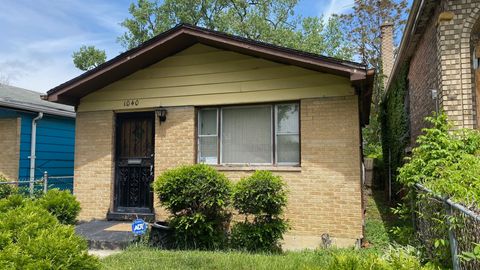
Active
$135,000
3
bds
|
2
ba
|
1,159
sqft
|
built
1972
1040 W 104th St, Chicago, IL 60643
$673
Cash flow
26.0%
Cash-on-Cash Return
11.7%
Cap rate
1.6%
Rent to Value Ratio
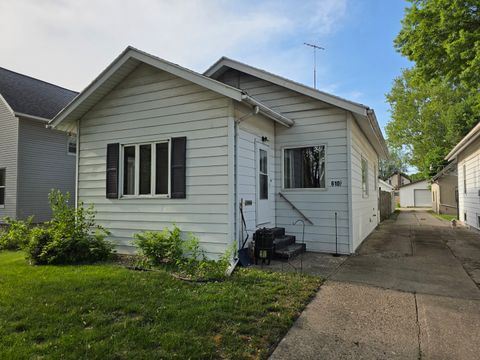
Active
$77,500
2
bds
|
1
ba
|
832
sqft
|
built
1923
610 1/2 W 7th St, Sterling, IL 61081
$153
Cash flow
10.3%
Cash-on-Cash Return
8.1%
Cap rate
1.4%
Rent to Value Ratio
Active
$510,000
2
bds
|
3
ba
|
1,776
sqft
|
built
2016
1255 Danforth Ct, Vernon Hills, IL 60061
$-1,555
Cash flow
-15.9%
Cash-on-Cash Return
2.0%
Cap rate
0.6%
Rent to Value Ratio

Active
$180,500
3
bds
|
2
ba
|
1,242
sqft
|
built
1953
1315 Loral Ave, Joliet, IL 60435
$-141
Cash flow
-4.1%
Cash-on-Cash Return
4.7%
Cap rate
1.0%
Rent to Value Ratio
Active
$318,000
3
bds
|
3
ba
|
1,972
sqft
|
built
1994
5522 Mallard Dr, Matteson, IL 60443
$-506
Cash flow
-8.3%
Cash-on-Cash Return
3.8%
Cap rate
0.9%
Rent to Value Ratio

Active
$329,900
3
bds
|
2
ba
|
0
sqft
|
built
1900
558 Franklin Blvd, Elgin, IL 60120
$-413
Cash flow
-6.5%
Cash-on-Cash Return
4.2%
Cap rate
0.7%
Rent to Value Ratio
Active
$175,000
5
bds
|
2
ba
|
2,100
sqft
|
built
1954
17231 Laflin Ave, East Hazel Crest, IL 60429
$152
Cash flow
4.5%
Cash-on-Cash Return
6.7%
Cap rate
1.3%
Rent to Value Ratio
Active
$310,000
3
bds
|
2
ba
|
900
sqft
|
built
1962
2311 N Natchez Ave, Chicago, IL 60707
$205
Cash flow
3.5%
Cash-on-Cash Return
6.5%
Cap rate
0.9%
Rent to Value Ratio
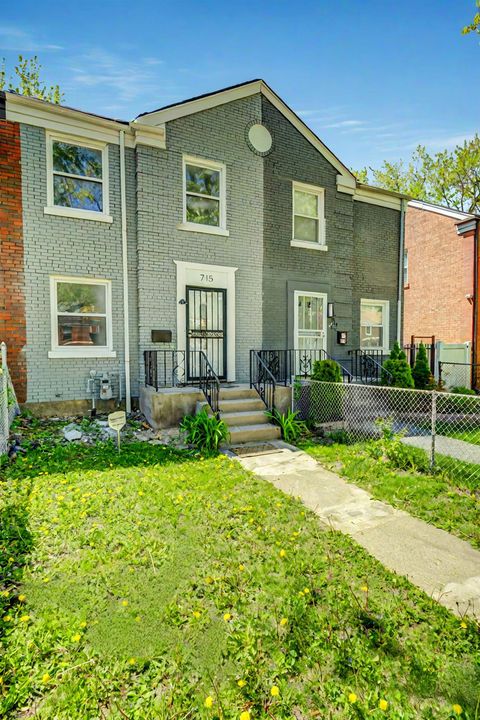
Active
$169,000
2
bds
|
1
ba
|
0
sqft
|
built
1942
715 E 105th Pl, Chicago, IL 60628
$107
Cash flow
3.3%
Cash-on-Cash Return
6.4%
Cap rate
0.8%
Rent to Value Ratio
Active
$280,000
3
bds
|
2
ba
|
1,830
sqft
|
built
1979
849 N Piatt St, Bement, IL 61813
$-512
Cash flow
-9.5%
Cash-on-Cash Return
3.5%
Cap rate
0.6%
Rent to Value Ratio
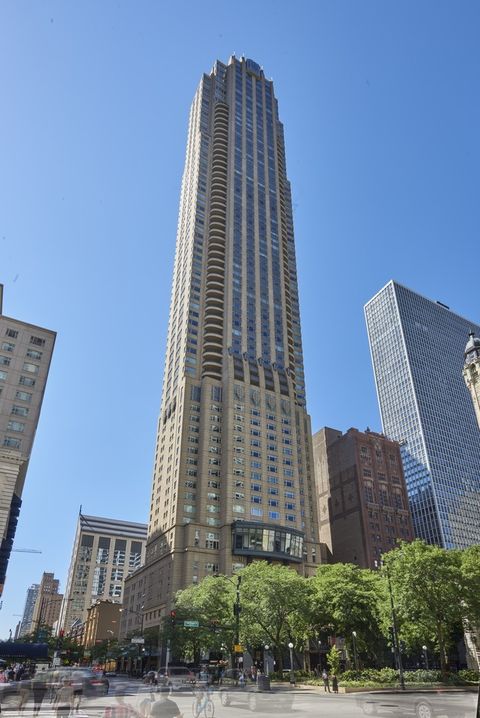
Active
$875,000
2
bds
|
3
ba
|
2,000
sqft
|
built
2000
800 N Michigan Ave, Chicago, IL 60611
$-3,489
Cash flow
-20.8%
Cash-on-Cash Return
0.9%
Cap rate
0.7%
Rent to Value Ratio
Active
$1,475,000
4
bds
|
4
ba
|
3,824
sqft
|
built
1950
1343 N Sutton Pl, Chicago, IL 60610
$-4,822
Cash flow
-17.1%
Cash-on-Cash Return
1.8%
Cap rate
0.5%
Rent to Value Ratio
Active
$539,900
4
bds
|
3
ba
|
2,226
sqft
|
built
1973
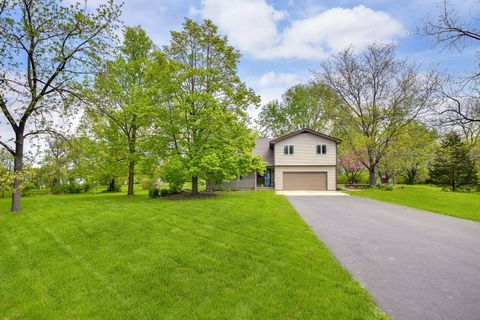
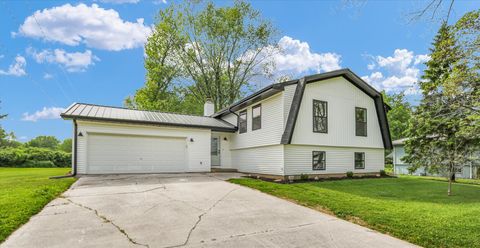
13 Gunflint Ct, Oswego, IL 60543
$-1,119
Cash flow
-10.8%
Cash-on-Cash Return
3.2%
Cap rate
0.6%
Rent to Value Ratio

Active
$119,000
3
bds
|
1
ba
|
1,120
sqft
|
built
1886
321 E North St, Sheffield, IL 61361
$58
Cash flow
2.5%
Cash-on-Cash Return
6.3%
Cap rate
0.8%
Rent to Value Ratio

Active
$295,000
3
bds
|
1
ba
|
1,420
sqft
|
built
1956
805 Grand Blvd, Joliet, IL 60436
$-552
Cash flow
-9.8%
Cash-on-Cash Return
3.4%
Cap rate
0.7%
Rent to Value Ratio
Active
$365,000
3
bds
|
1
ba
|
1,315
sqft
|
built
1962
5108 S Massasoit Ave, Chicago, IL 60638
$-266
Cash flow
-3.8%
Cash-on-Cash Return
4.8%
Cap rate
0.7%
Rent to Value Ratio
Active
$189,900
3
bds
|
1
ba
|
1,200
sqft
|
built
1943
28069 N Lake Dr, Wauconda, IL 60084
$-16
Cash flow
-0.4%
Cash-on-Cash Return
5.6%
Cap rate
0.9%
Rent to Value Ratio
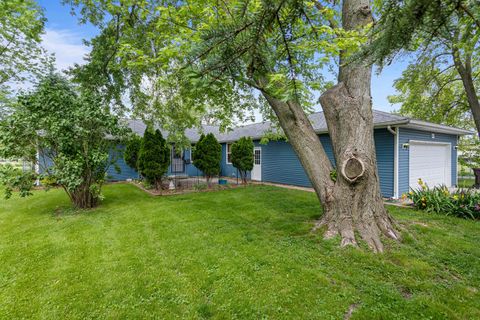
Active
$179,000
3
bds
|
2
ba
|
0
sqft
|
built
1962
3724 W 135th St, Robbins, IL 60472
$-561
Cash flow
-16.4%
Cash-on-Cash Return
1.9%
Cap rate
0.8%
Rent to Value Ratio
Active
$225,000
3
bds
|
3
ba
|
1,953
sqft
|
built
1971
1420 Vicksburg Dr, Belleville, IL 62221
$-53
Cash flow
-1.2%
Cash-on-Cash Return
5.4%
Cap rate
0.9%
Rent to Value Ratio
Active
$299,900
3
bds
|
2
ba
|
1,300
sqft
|
built
1920
6414 N Hoyne Ave, Chicago, IL 60645
$-373
Cash flow
-6.5%
Cash-on-Cash Return
4.2%
Cap rate
0.7%
Rent to Value Ratio
Active
$405,000
2
bds
|
2
ba
|
1,404
sqft
|
built
2000
5555 N Cumberland Ave, Chicago, IL 60656
$-1,333
Cash flow
-17.2%
Cash-on-Cash Return
1.7%
Cap rate
0.5%
Rent to Value Ratio
Active
$249,900
3
bds
|
2
ba
|
2,739
sqft
|
built
1961
8605 S Calumet Ave, Chicago, IL 60619
$358
Cash flow
7.5%
Cash-on-Cash Return
7.4%
Cap rate
1.0%
Rent to Value Ratio
Active
$400,000
4
bds
|
3
ba
|
2,275
sqft
|
built
1978
1801 Cindy Lynn St, Urbana, IL 61802
$-876
Cash flow
-11.4%
Cash-on-Cash Return
3.1%
Cap rate
0.5%
Rent to Value Ratio
Active
$109,500
2
bds
|
1
ba
|
900
sqft
|
built
1946
2030 E 72nd Pl, Chicago, IL 60649
$81
Cash flow
3.9%
Cash-on-Cash Return
6.6%
Cap rate
1.4%
Rent to Value Ratio
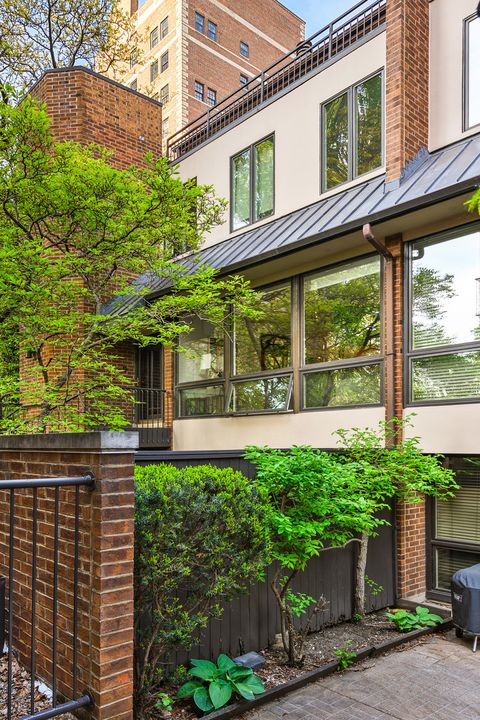
Active
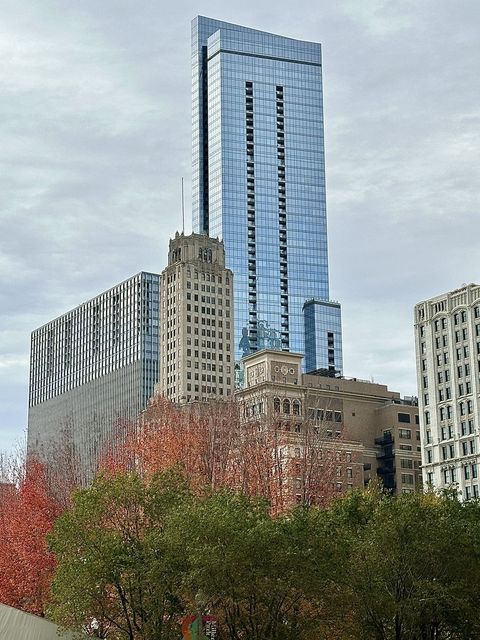
$1,199,000
2
bds
|
3
ba
|
1,999
sqft
|
built
2009
60 E Monroe St, Chicago, IL 60603
$-5,928
Cash flow
-25.8%
Cash-on-Cash Return
-0.3%
Cap rate
0.5%
Rent to Value Ratio
Active
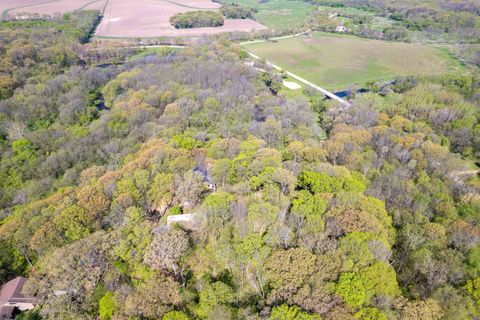
$499,000
4
bds
|
5
ba
|
6,152
sqft
|
built
1975
1479 Old Mill Rd, Franklin Grove, IL 61031
$-1,106
Cash flow
-11.6%
Cash-on-Cash Return
3.0%
Cap rate
0.6%
Rent to Value Ratio
Active
$345,500
4
bds
|
3
ba
|
2,325
sqft
|
built
1927
6432 41st St, Stickney, IL 60402
$-270
Cash flow
-4.1%
Cash-on-Cash Return
4.7%
Cap rate
0.8%
Rent to Value Ratio
Active
$159,900
4
bds
|
4
ba
|
2,904
sqft
|
built
1974
4327 W Tara Cir, Peoria, IL 61615
$238
Cash flow
7.8%
Cash-on-Cash Return
7.5%
Cap rate
1.3%
Rent to Value Ratio
Active
$475,000
2
bds
|
1
ba
|
888
sqft
|
built
1954
11 Shagbark Rd, Lake Bluff, IL 60044
$-1,273
Cash flow
-14.0%
Cash-on-Cash Return
2.5%
Cap rate
0.4%
Rent to Value Ratio
Active
$680,000
3
bds
|
2
ba
|
1,684
sqft
|
built
1949
401 S 4th Ave, Libertyville, IL 60048
$-1,887
Cash flow
-14.5%
Cash-on-Cash Return
2.3%
Cap rate
0.5%
Rent to Value Ratio
Active
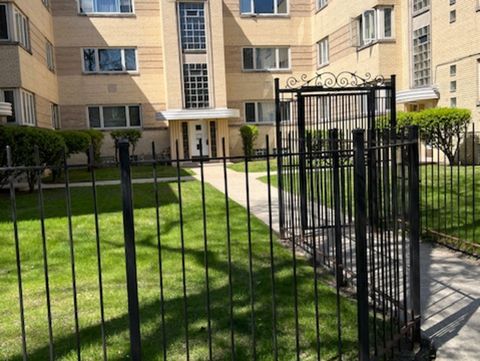
$219,999
1
bds
|
1
ba
|
0
sqft
|
built
2007
1122 W Catalpa Ave, Chicago, IL 60640
$-808
Cash flow
-19.2%
Cash-on-Cash Return
1.3%
Cap rate
0.9%
Rent to Value Ratio
Active
$585,000
4
bds
|
3
ba
|
2,064
sqft
|
built
1978
121 S Parkside Ave, Glen Ellyn, IL 60137
$-1,215
Cash flow
-10.8%
Cash-on-Cash Return
3.2%
Cap rate
0.6%
Rent to Value Ratio