Illinois Investment Properties for Sale
Browse homes for sale and investment properties in Illinois. Refine your search by price, property type, or more.
Best cash flowing properties in Illinois
Active
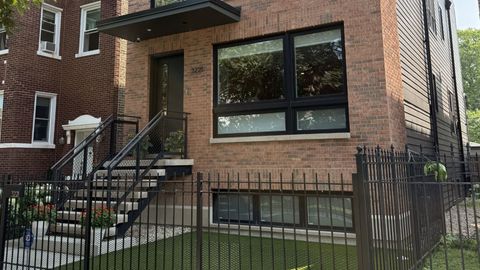
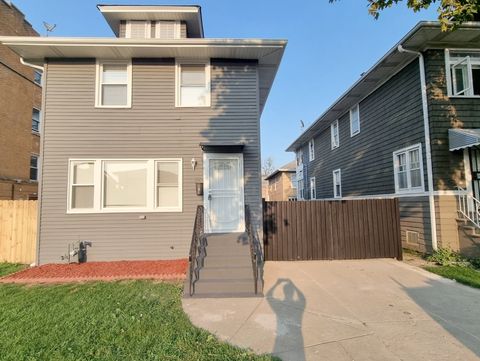
$1,019,900
3
bds
|
4
ba
|
3,548
sqft
|
built
2023
3221 N Kenneth Ave, Chicago, IL 60641
$931
Cash flow
4.8%
Cash-on-Cash Return
6.8%
Cap rate
0.9%
Rent to Value Ratio
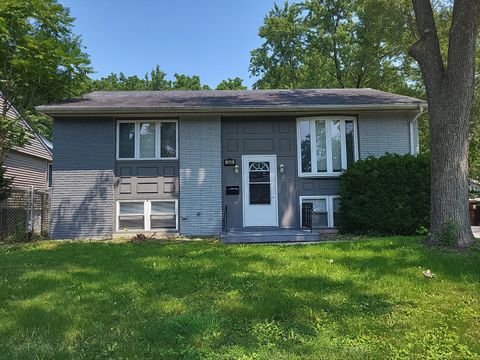
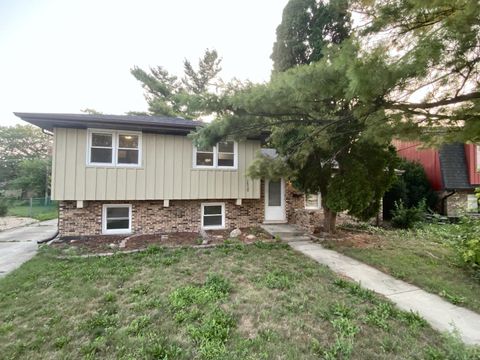
Active
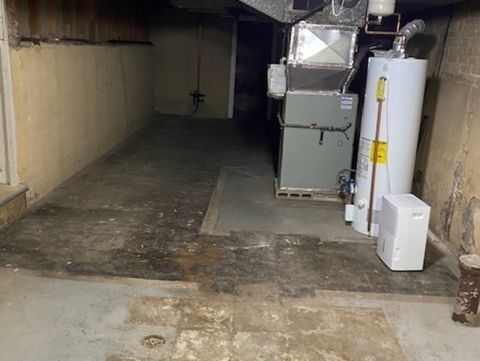
$189,900
3
bds
|
2
ba
|
1,886
sqft
|
built
1955
8928 S Bennett Ave, Chicago, IL 60617
$682
Cash flow
18.7%
Cash-on-Cash Return
10.0%
Cap rate
1.4%
Rent to Value Ratio
7,779 out of 11,636 properties for sale in Illinois
Limited Results Shown
Create a free account, or log in to reveal all property listings and enjoy the complete experience.
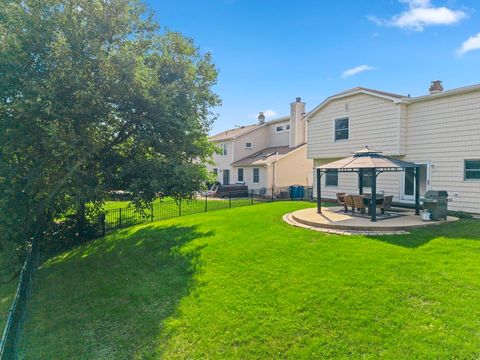
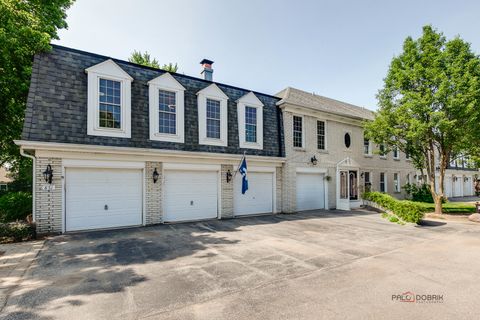
Active
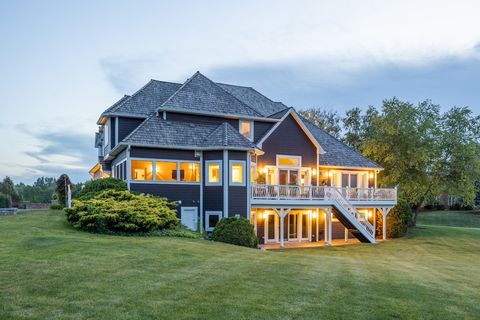
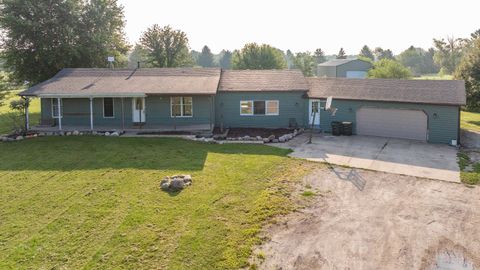
$930,000
5
bds
|
6
ba
|
5,000
sqft
|
built
2007
1624 Bull Valley Dr, Woodstock, IL 60098
$-3,195
Cash flow
-17.9%
Cash-on-Cash Return
1.6%
Cap rate
0.4%
Rent to Value Ratio
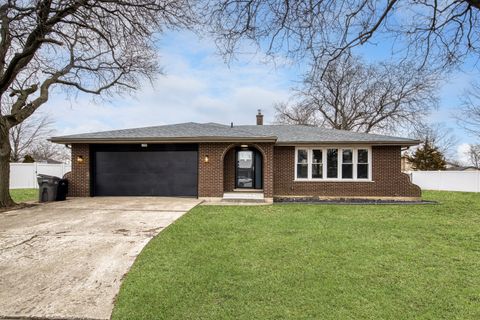
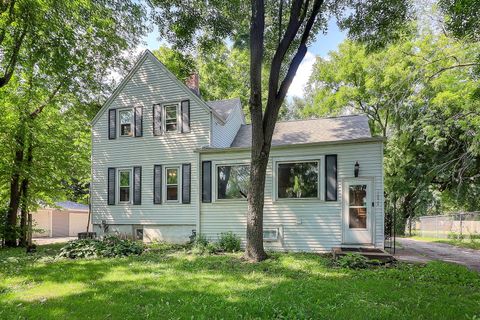
Active
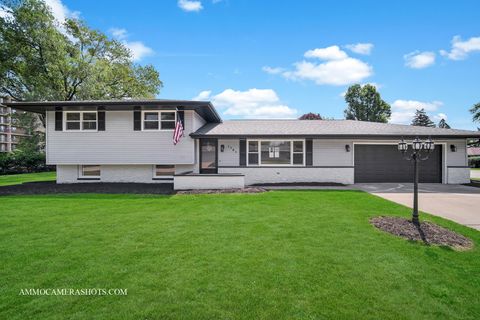
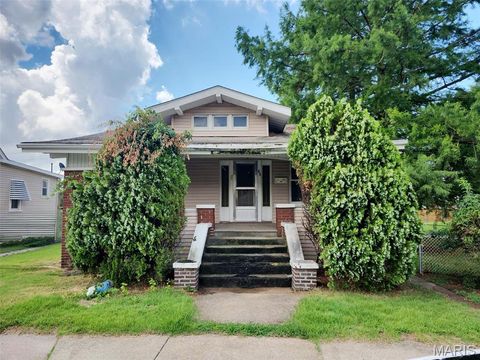
$299,900
4
bds
|
2
ba
|
0
sqft
|
built
1968
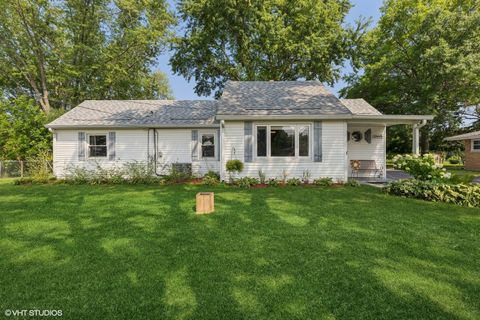
1701 Newton Dr, Morris, IL 60450
$-162
Cash flow
-2.8%
Cash-on-Cash Return
5.0%
Cap rate
0.8%
Rent to Value Ratio
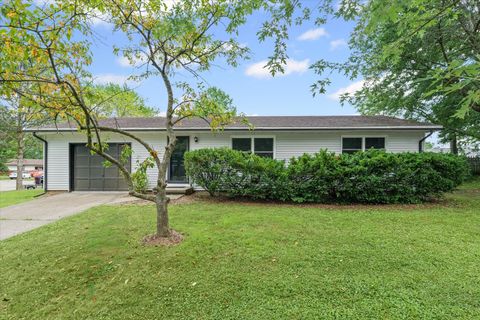
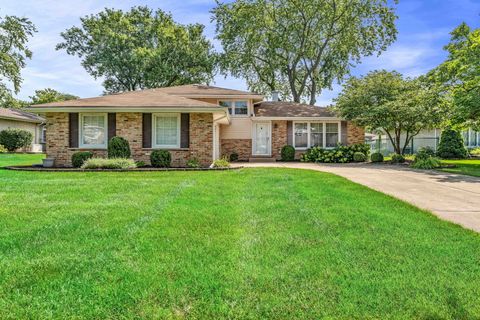
Active
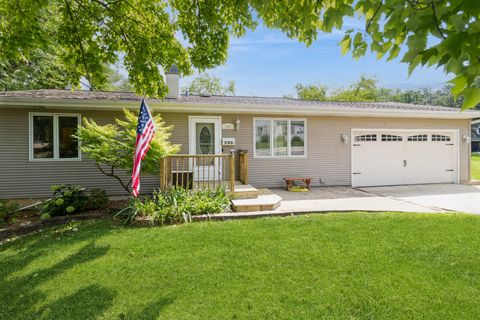
$499,000
4
bds
|
3
ba
|
2,660
sqft
|
built
1978
140 Amherst Dr, Bartlett, IL 60103
$-803
Cash flow
-8.4%
Cash-on-Cash Return
3.7%
Cap rate
0.7%
Rent to Value Ratio
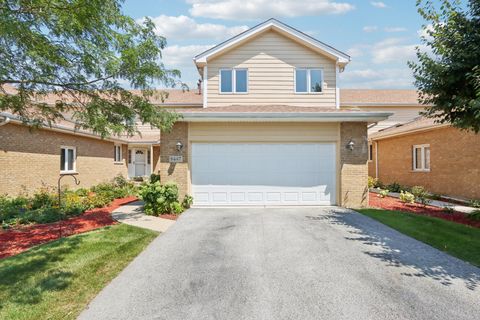
Active
$485,000
6
bds
|
3
ba
|
1,817
sqft
|
built
1973
15245 Narcissus Ct, Orland Park, IL 60462
$-842
Cash flow
-9.1%
Cash-on-Cash Return
3.6%
Cap rate
0.7%
Rent to Value Ratio
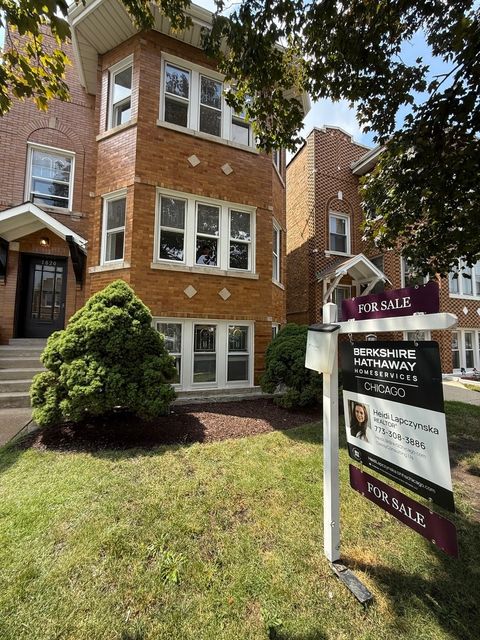
Active
$849,900
9
bds
|
3
ba
|
0
sqft
|
built
1928
1820 Gunderson Ave, Berwyn, IL 60402
$-3,635
Cash flow
-22.3%
Cash-on-Cash Return
0.5%
Cap rate
0.2%
Rent to Value Ratio
Active
$150,000
3
bds
|
1
ba
|
912
sqft
|
built
1978
2207 E Country Squire Dr, Urbana, IL 61802
$243
Cash flow
8.5%
Cash-on-Cash Return
7.6%
Cap rate
1.2%
Rent to Value Ratio

Active
$450,000
2
bds
|
2
ba
|
1,200
sqft
|
built
2015
2627 W Thomas St, Chicago, IL 60622
$-785
Cash flow
-9.1%
Cash-on-Cash Return
3.6%
Cap rate
0.7%
Rent to Value Ratio
Active
$575,000
5
bds
|
3
ba
|
0
sqft
|
built
1910
4426 N Drake Ave, Chicago, IL 60625
$-1,560
Cash flow
-14.2%
Cash-on-Cash Return
2.4%
Cap rate
0.5%
Rent to Value Ratio
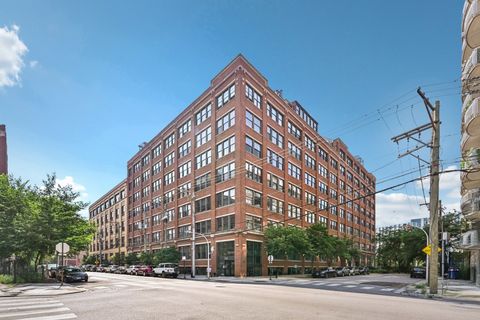
Active
$270,000
1
bds
|
1
ba
|
875
sqft
|
built
1985
70 W Huron St, Chicago, IL 60654
$-423
Cash flow
-8.2%
Cash-on-Cash Return
3.8%
Cap rate
1.1%
Rent to Value Ratio
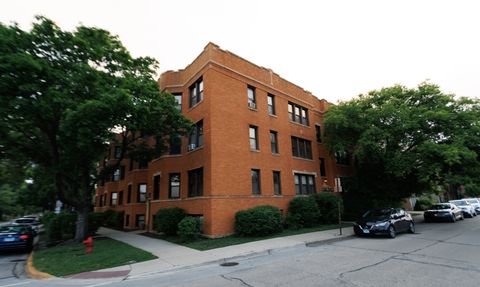
Active
$499,900
2
bds
|
3
ba
|
0
sqft
|
built
1920
1323 W Belden Ave, Chicago, IL 60614
$-641
Cash flow
-6.7%
Cash-on-Cash Return
4.1%
Cap rate
0.8%
Rent to Value Ratio
Active
$359,000
3
bds
|
2
ba
|
2,917
sqft
|
built
1991
6624 Arena Dr, Roscoe, IL 61073
$-639
Cash flow
-9.3%
Cash-on-Cash Return
3.5%
Cap rate
0.6%
Rent to Value Ratio
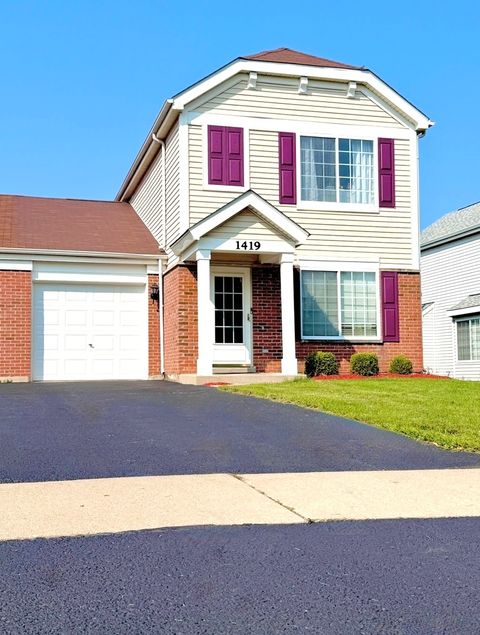
Active
$294,999
3
bds
|
3
ba
|
1,596
sqft
|
built
2005
1419 Kettleson Dr, Minooka, IL 60447
$-234
Cash flow
-4.1%
Cash-on-Cash Return
4.7%
Cap rate
0.8%
Rent to Value Ratio
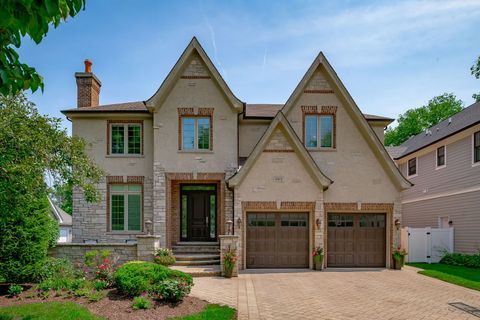
Active
$1,650,000
4
bds
|
5
ba
|
4,240
sqft
|
built
2006
665 S Euclid Ave, Elmhurst, IL 60126
$-5,591
Cash flow
-17.7%
Cash-on-Cash Return
1.6%
Cap rate
0.4%
Rent to Value Ratio
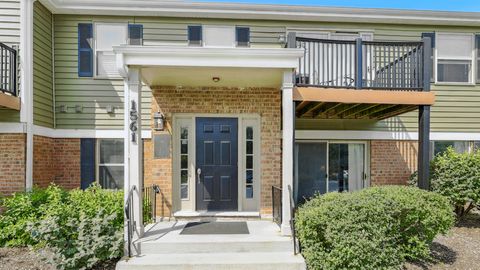
Active
$186,500
1
bds
|
1
ba
|
675
sqft
|
built
1985
1561 Raymond Dr, Naperville, IL 60563
$-259
Cash flow
-7.2%
Cash-on-Cash Return
4.0%
Cap rate
0.9%
Rent to Value Ratio
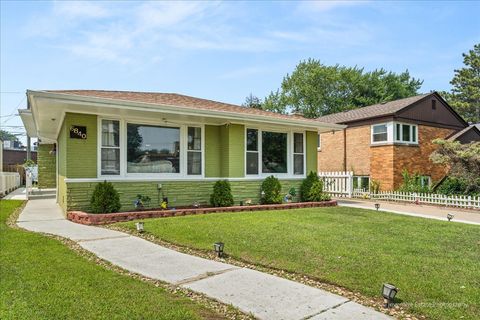
Active
$569,500
4
bds
|
2
ba
|
1,792
sqft
|
built
1955
6840 N Keystone Ave, Lincolnwood, IL 60712
$-503
Cash flow
-4.6%
Cash-on-Cash Return
4.6%
Cap rate
0.7%
Rent to Value Ratio
Active
$190,000
2
bds
|
1
ba
|
875
sqft
|
built
1954
39449 N Carol Ln, Beach Park, IL 60099
$15
Cash flow
0.4%
Cash-on-Cash Return
5.8%
Cap rate
0.9%
Rent to Value Ratio
Active
$173,000
1
bds
|
1
ba
|
690
sqft
|
built
1923
644 Harrison St, Oak Park, IL 60304
$-189
Cash flow
-5.7%
Cash-on-Cash Return
4.4%
Cap rate
1.1%
Rent to Value Ratio
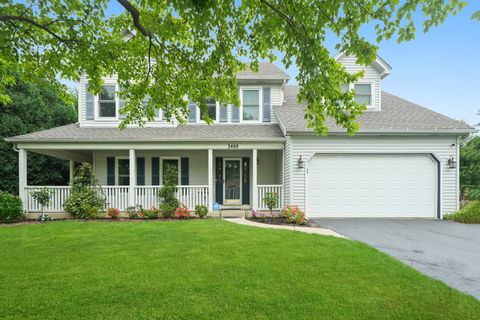
Active
$515,000
4
bds
|
3
ba
|
2,503
sqft
|
built
1991
2460 Millington Ct, Aurora, IL 60504
$-928
Cash flow
-9.4%
Cash-on-Cash Return
3.5%
Cap rate
0.7%
Rent to Value Ratio
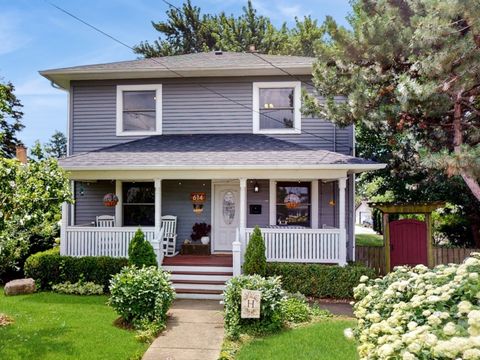
Active
$460,000
2
bds
|
2
ba
|
1,568
sqft
|
built
1898
614 Mc Carthy Rd, Lemont, IL 60439
$-334
Cash flow
-3.8%
Cash-on-Cash Return
4.8%
Cap rate
0.8%
Rent to Value Ratio
Active
$389,000
3
bds
|
2
ba
|
1,700
sqft
|
built
1917
827 S 19th Ave, Maywood, IL 60153
$-826
Cash flow
-11.1%
Cash-on-Cash Return
3.1%
Cap rate
0.6%
Rent to Value Ratio
Active
$399,900
3
bds
|
2
ba
|
0
sqft
|
built
1992
4416 E 29th Rd, Sheridan, IL 60551
$-1,102
Cash flow
-14.4%
Cash-on-Cash Return
2.4%
Cap rate
0.5%
Rent to Value Ratio
Active
$59,900
2
bds
|
1
ba
|
988
sqft
|
built
1920
72 E Acton Ave, Wood River, IL 62095
$648
Cash flow
12.6%
Cash-on-Cash Return
13.0%
Cap rate
2.0%
Rent to Value Ratio
Active
$369,000
3
bds
|
2
ba
|
2,044
sqft
|
built
1976
295 S Walnut St, South Elgin, IL 60177
$-498
Cash flow
-7.0%
Cash-on-Cash Return
4.1%
Cap rate
0.7%
Rent to Value Ratio
Active
$241,000
4
bds
|
2
ba
|
1,650
sqft
|
built
1968
349 E Maple Dr, Glenwood, IL 60425
$311
Cash flow
6.7%
Cash-on-Cash Return
7.2%
Cap rate
1.2%
Rent to Value Ratio
Active
$279,000
1
bds
|
1
ba
|
900
sqft
|
built
1914
913 W Van Buren St, Chicago, IL 60607
$-236
Cash flow
-4.4%
Cash-on-Cash Return
4.7%
Cap rate
0.9%
Rent to Value Ratio
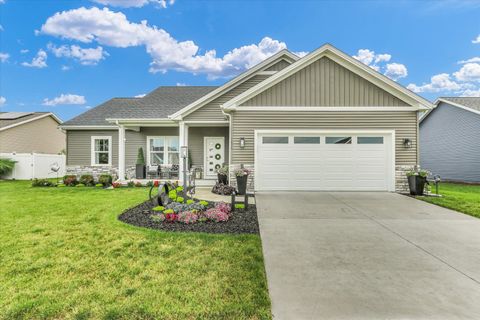
Active
$320,000
2
bds
|
2
ba
|
1,512
sqft
|
built
2021
1606 E Horizon Ln, Urbana, IL 61802
$49
Cash flow
0.8%
Cash-on-Cash Return
5.9%
Cap rate
0.8%
Rent to Value Ratio
Active
$699,900
4
bds
|
4
ba
|
2,872
sqft
|
built
2018
5 Fieldcrest Dr, Monticello, IL 61856
$-2,490
Cash flow
-18.6%
Cash-on-Cash Return
1.4%
Cap rate
0.4%
Rent to Value Ratio
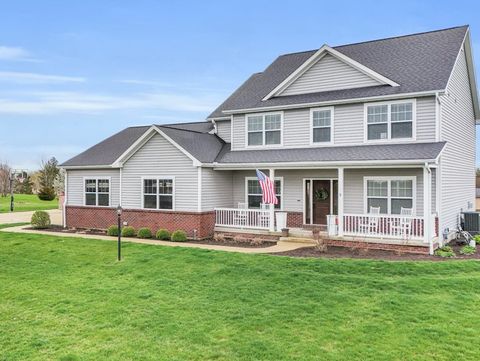
Active
$499,900
5
bds
|
4
ba
|
2,639
sqft
|
built
1994
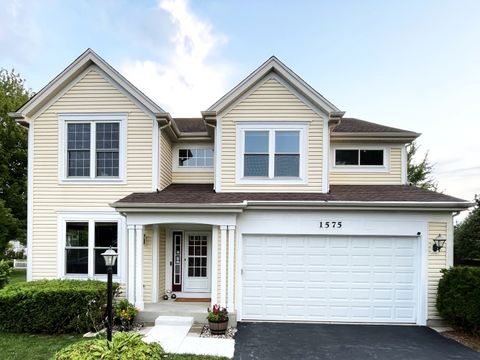
1575 Sage Ct, Gurnee, IL 60031
$-868
Cash flow
-9.1%
Cash-on-Cash Return
3.6%
Cap rate
0.7%
Rent to Value Ratio
Active
$350,000
5
bds
|
5
ba
|
3,392
sqft
|
built
1880
644 Genesee Ave, Morrison, IL 61270
$-727
Cash flow
-10.8%
Cash-on-Cash Return
3.2%
Cap rate
0.6%
Rent to Value Ratio
Active
$389,900
3
bds
|
3
ba
|
2,754
sqft
|
built
1993
132 Fox Trot, Dixon, IL 61021
$-886
Cash flow
-11.9%
Cash-on-Cash Return
3.0%
Cap rate
0.7%
Rent to Value Ratio
Active
$674,000
4
bds
|
6
ba
|
5,506
sqft
|
built
1993
1616 10th Fairway Dr, Belleville, IL 62220
$-1,715
Cash flow
-13.3%
Cash-on-Cash Return
2.6%
Cap rate
0.6%
Rent to Value Ratio
Active
$267,000
3
bds
|
2
ba
|
1,250
sqft
|
built
1979
851 Garfield Ave, Libertyville, IL 60048
$-131
Cash flow
-2.6%
Cash-on-Cash Return
5.1%
Cap rate
1.0%
Rent to Value Ratio
Active
$315,000
3
bds
|
3
ba
|
1,119
sqft
|
built
1900
10828 W Grand Ave, Melrose Park, IL 60164
$-189
Cash flow
-3.1%
Cash-on-Cash Return
5.0%
Cap rate
0.8%
Rent to Value Ratio
Active
$455,000
3
bds
|
2
ba
|
1,950
sqft
|
built
1968
7629 Baimbridge Dr, Downers Grove, IL 60516
$-611
Cash flow
-7.0%
Cash-on-Cash Return
4.1%
Cap rate
0.7%
Rent to Value Ratio
Active
$389,900
2
bds
|
4
ba
|
2,200
sqft
|
built
2003
8447 Dunmore Dr, Tinley Park, IL 60487
$-857
Cash flow
-11.5%
Cash-on-Cash Return
3.0%
Cap rate
0.7%
Rent to Value Ratio
Active
$265,000
3
bds
|
2
ba
|
1,147
sqft
|
built
1978
16428 Wabash Ave, South Holland, IL 60473
$196
Cash flow
3.9%
Cash-on-Cash Return
6.6%
Cap rate
1.2%
Rent to Value Ratio
Active
$299,900
3
bds
|
1
ba
|
1,137
sqft
|
built
1957
16521 W 146th Pl, Lockport, IL 60441
$-70
Cash flow
-1.2%
Cash-on-Cash Return
5.4%
Cap rate
0.8%
Rent to Value Ratio
Active
$149,900
7
bds
|
2
ba
|
0
sqft
|
built
1898
7125 S Drexel Ave, Chicago, IL 60619
$547
Cash flow
19.0%
Cash-on-Cash Return
10.1%
Cap rate
1.3%
Rent to Value Ratio