Indiana Investment Properties for Sale
Browse homes for sale and investment properties in Indiana. Refine your search by price, property type, or more.
Best cash flowing properties in Indiana
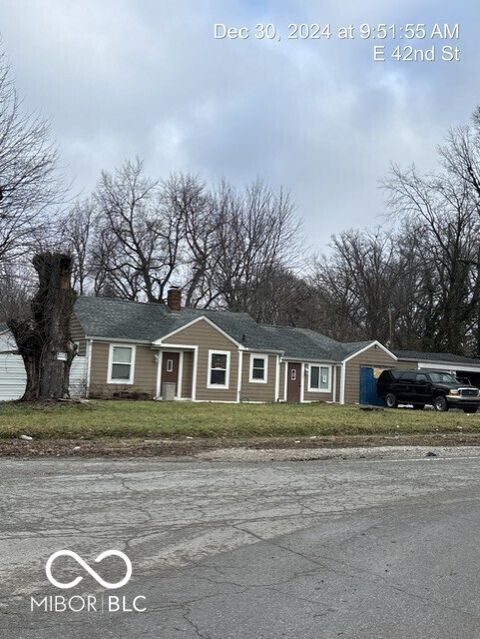
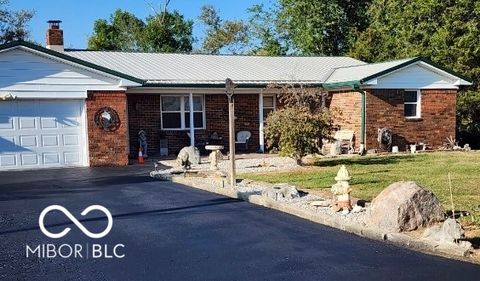
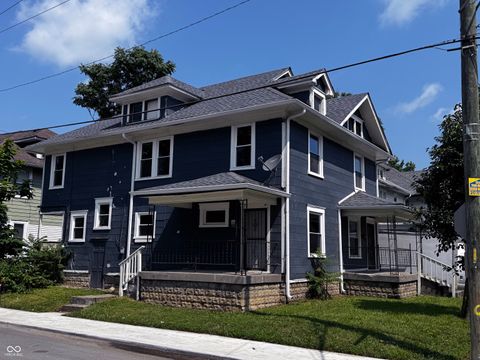
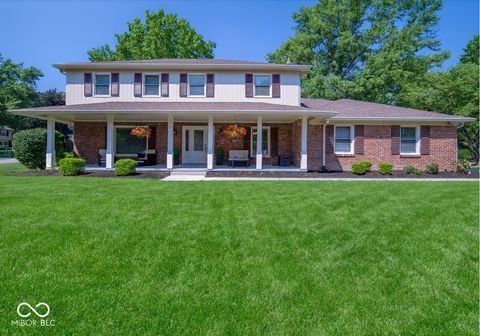
Active
$140,000
3
bds
|
2
ba
|
1,204
sqft
|
built
1950
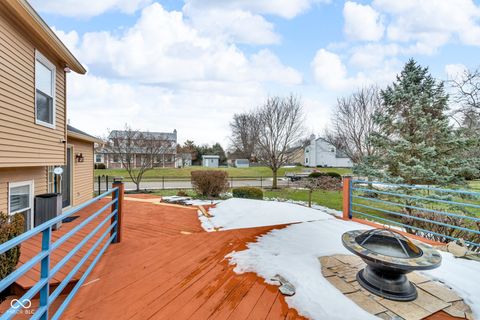
3302 E 42nd St, Indianapolis, IN 46205
$525
Cash flow
19.6%
Cash-on-Cash Return
10.6%
Cap rate
1.3%
Rent to Value Ratio
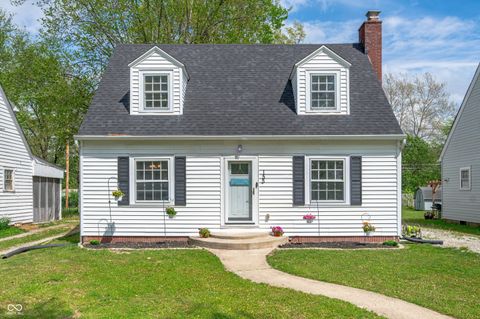
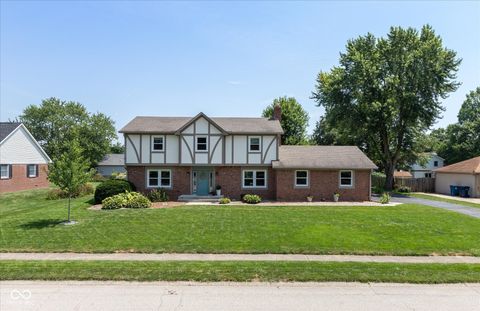
Active
$110,000
2
bds
|
1
ba
|
1,925
sqft
|
built
1951
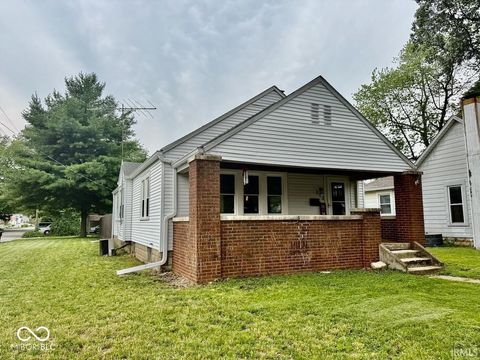
3505 N Layman Ave, Indianapolis, IN 46218
$403
Cash flow
19.1%
Cash-on-Cash Return
10.5%
Cap rate
1.3%
Rent to Value Ratio
3,610 out of 4,456 properties for sale in Indiana
Limited Results Shown
Create a free account, or log in to reveal all property listings and enjoy the complete experience.
Active
$125,000
2
bds
|
0
ba
|
872
sqft
|
built
1870
324 Burgess Ave, Indianapolis, IN 46219
$326
Cash flow
13.6%
Cash-on-Cash Return
9.3%
Cap rate
1.1%
Rent to Value Ratio
Active
$460,000
4
bds
|
3
ba
|
3,294
sqft
|
built
2000
13068 Lamarque Pl, Fishers, IN 46038
$-745
Cash flow
-8.4%
Cash-on-Cash Return
4.2%
Cap rate
0.5%
Rent to Value Ratio
Active
$340,000
4
bds
|
2
ba
|
1,540
sqft
|
built
1960
3348 W 800 N, Fairland, IN 46126
$-845
Cash flow
-13.0%
Cash-on-Cash Return
3.2%
Cap rate
0.4%
Rent to Value Ratio
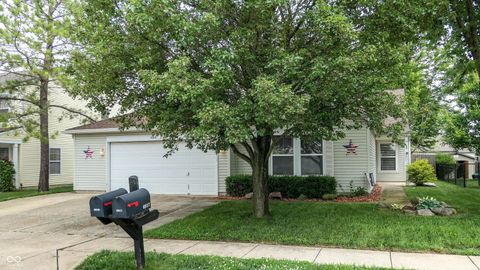
Active
$160,000
5
bds
|
0
ba
|
0
sqft
|
built
1900
104 E North St, Greenfield, IN 46140
$-130
Cash flow
-4.2%
Cash-on-Cash Return
5.2%
Cap rate
0.6%
Rent to Value Ratio

Active
$309,900
3
bds
|
4
ba
|
1,960
sqft
|
built
1930
213 S State Ave, Indianapolis, IN 46201
$-828
Cash flow
-13.9%
Cash-on-Cash Return
2.9%
Cap rate
0.4%
Rent to Value Ratio

Active
$299,000
3
bds
|
3
ba
|
3,418
sqft
|
built
2003
9873 Blue Ridge Way, Indianapolis, IN 46234
$-52
Cash flow
-0.9%
Cash-on-Cash Return
5.9%
Cap rate
0.7%
Rent to Value Ratio
Active
$224,900
3
bds
|
2
ba
|
1,776
sqft
|
built
1958
8045 Briarwood Dr, Indianapolis, IN 46227
$90
Cash flow
2.1%
Cash-on-Cash Return
6.6%
Cap rate
0.8%
Rent to Value Ratio
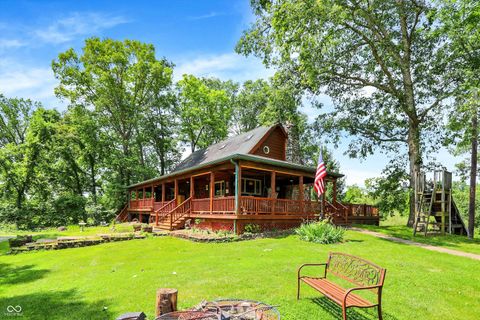
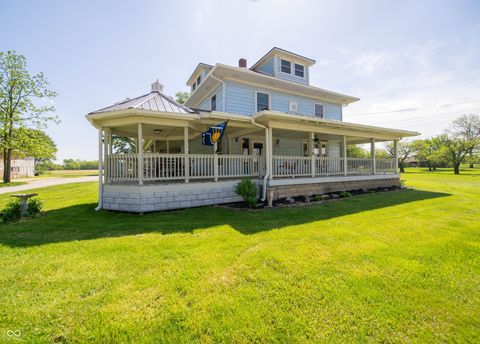
Active
$899,900
5
bds
|
2
ba
|
3,180
sqft
|
built
1979
1155 Cope Rd, Martinsville, IN 46151
$-1,919
Cash flow
-11.1%
Cash-on-Cash Return
3.6%
Cap rate
0.4%
Rent to Value Ratio

Active
$150,000
3
bds
|
2
ba
|
1,288
sqft
|
built
1925
3614 E New York St, Indianapolis, IN 46201
$-9
Cash flow
-0.3%
Cash-on-Cash Return
6.1%
Cap rate
0.7%
Rent to Value Ratio
Active
$360,000
3
bds
|
3
ba
|
2,660
sqft
|
built
1992
4549 Pepper Ct, Indianapolis, IN 46237
$-153
Cash flow
-2.2%
Cash-on-Cash Return
5.6%
Cap rate
0.7%
Rent to Value Ratio

Active
$218,900
2
bds
|
2
ba
|
1,413
sqft
|
built
1977
5491 Vin Rose Ln, Lawrence, IN 46226
$-450
Cash flow
-10.7%
Cash-on-Cash Return
3.7%
Cap rate
0.7%
Rent to Value Ratio
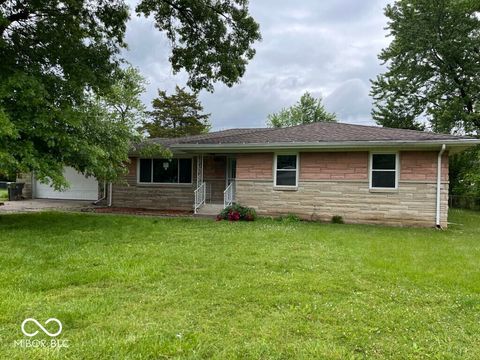
Active
$125,000
2
bds
|
1
ba
|
1,168
sqft
|
built
1928
313 S Brittain Ave, Muncie, IN 47303
$257
Cash flow
10.7%
Cash-on-Cash Return
8.6%
Cap rate
1.0%
Rent to Value Ratio

Active
$344,900
4
bds
|
8
ba
|
2,688
sqft
|
built
1997
10629 Simsbury Ct, Indianapolis, IN 46236
$-313
Cash flow
-4.7%
Cash-on-Cash Return
5.1%
Cap rate
0.6%
Rent to Value Ratio
Active
$650,000
5
bds
|
4
ba
|
4,556
sqft
|
built
2008
608 E 21st St, Indianapolis, IN 46202
$-915
Cash flow
-7.3%
Cash-on-Cash Return
4.5%
Cap rate
0.5%
Rent to Value Ratio
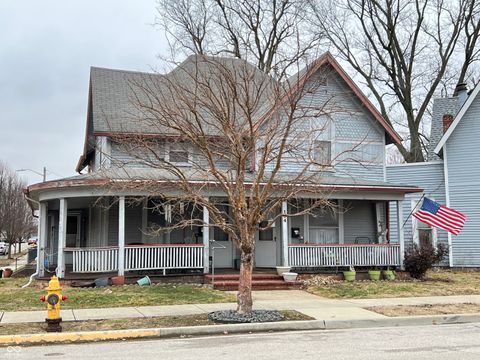
Active
$330,000
2
bds
|
2
ba
|
2,026
sqft
|
built
1967
5850 Paradise Ln, Martinsville, IN 46151
$-215
Cash flow
-3.4%
Cash-on-Cash Return
5.4%
Cap rate
0.7%
Rent to Value Ratio
Active
$230,000
3
bds
|
0
ba
|
0
sqft
|
built
1910
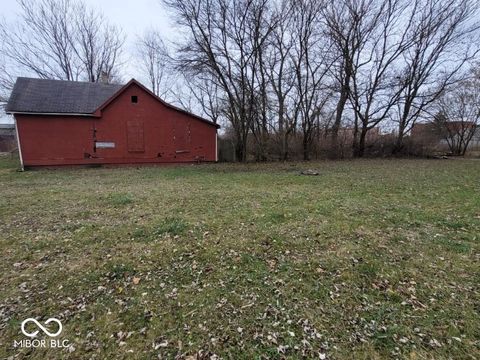
3502 N Kenwood Ave, Indianapolis, IN 46208
$-419
Cash flow
-9.5%
Cash-on-Cash Return
4.0%
Cap rate
0.5%
Rent to Value Ratio
Active
$269,900
4
bds
|
2
ba
|
1,836
sqft
|
built
1941
155 N Franklin Rd, Indianapolis, IN 46219
$-141
Cash flow
-2.7%
Cash-on-Cash Return
5.5%
Cap rate
0.7%
Rent to Value Ratio
Active
$319,000
3
bds
|
2
ba
|
2,025
sqft
|
built
1974
603 Aiken St, Hope, IN 47246
$-47
Cash flow
-0.8%
Cash-on-Cash Return
6.0%
Cap rate
0.7%
Rent to Value Ratio
Active
$199,900
3
bds
|
1
ba
|
960
sqft
|
built
1962
219 N 9th Ave, Beech Grove, IN 46107
$80
Cash flow
2.1%
Cash-on-Cash Return
6.6%
Cap rate
0.8%
Rent to Value Ratio
Active
$390,000
3
bds
|
2
ba
|
1,955
sqft
|
built
2022
17877 Haralson Row, Westfield, IN 46074
$-406
Cash flow
-5.4%
Cash-on-Cash Return
4.9%
Cap rate
0.6%
Rent to Value Ratio
Active
$399,000
4
bds
|
3
ba
|
2,425
sqft
|
built
1973
260 17th St, Columbus, IN 47201
$-43
Cash flow
-0.6%
Cash-on-Cash Return
6.0%
Cap rate
0.7%
Rent to Value Ratio
Active
$165,000
3
bds
|
0
ba
|
0
sqft
|
built
1920
1129 N Pershing Ave, Indianapolis, IN 46222
$-155
Cash flow
-4.9%
Cash-on-Cash Return
5.0%
Cap rate
0.6%
Rent to Value Ratio
Active
$464,000
5
bds
|
4
ba
|
4,046
sqft
|
built
2006
11134 Westoves Dr, Noblesville, IN 46060
$-492
Cash flow
-5.5%
Cash-on-Cash Return
4.9%
Cap rate
0.6%
Rent to Value Ratio

Active
$294,900
5
bds
|
3
ba
|
1,826
sqft
|
built
1988
8075 Cardinal Cv E, Indianapolis, IN 46256
$-62
Cash flow
-1.1%
Cash-on-Cash Return
5.9%
Cap rate
0.7%
Rent to Value Ratio
Active
$85,000
2
bds
|
1
ba
|
960
sqft
|
built
1955
1724 Sheldon St, Indianapolis, IN 46218
$393
Cash flow
24.1%
Cash-on-Cash Return
11.7%
Cap rate
1.4%
Rent to Value Ratio
Active
$275,000
3
bds
|
2
ba
|
1,770
sqft
|
built
2003
6816 Minnow Dr, Indianapolis, IN 46237
$-56
Cash flow
-1.1%
Cash-on-Cash Return
5.9%
Cap rate
0.7%
Rent to Value Ratio
Active
$624,000
4
bds
|
4
ba
|
5,056
sqft
|
built
1900
9579 N Fortville Pike, Fortville, IN 46040
$-1,816
Cash flow
-15.2%
Cash-on-Cash Return
2.7%
Cap rate
0.3%
Rent to Value Ratio
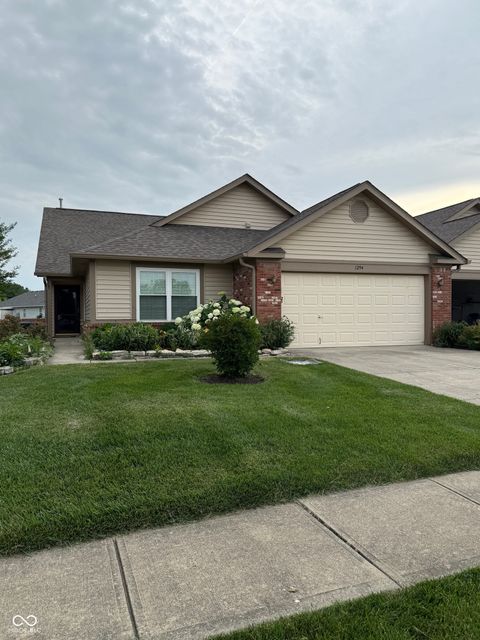
Active
$242,900
3
bds
|
2
ba
|
1,712
sqft
|
built
2002
1294 Lexington Trl, Greenfield, IN 46140
$-31
Cash flow
-0.7%
Cash-on-Cash Return
6.0%
Cap rate
0.8%
Rent to Value Ratio
Active
$275,000
2
bds
|
2
ba
|
1,316
sqft
|
built
2017
5069 Lilium Dr, Plainfield, IN 46168
$-260
Cash flow
-4.9%
Cash-on-Cash Return
5.0%
Cap rate
0.7%
Rent to Value Ratio
Active
$375,000
3
bds
|
3
ba
|
2,017
sqft
|
built
2021
17399 Dovehouse Ln, Westfield, IN 46074
$-89
Cash flow
-1.2%
Cash-on-Cash Return
5.9%
Cap rate
0.7%
Rent to Value Ratio
Active
$209,900
4
bds
|
0
ba
|
0
sqft
|
built
1966
1309 E 47th St, Anderson, IN 46013
$29
Cash flow
0.7%
Cash-on-Cash Return
6.3%
Cap rate
0.8%
Rent to Value Ratio

Active
$144,900
2
bds
|
1
ba
|
616
sqft
|
built
1938
4715 Normal Ave, Indianapolis, IN 46226
$17
Cash flow
0.6%
Cash-on-Cash Return
6.3%
Cap rate
0.8%
Rent to Value Ratio
Active
$369,500
4
bds
|
3
ba
|
1,772
sqft
|
built
1997
2410 Silver Ct, Carmel, IN 46033
$-330
Cash flow
-4.7%
Cash-on-Cash Return
5.1%
Cap rate
0.6%
Rent to Value Ratio
Active
$485,000
4
bds
|
3
ba
|
2,380
sqft
|
built
1969
11324 Green St, Carmel, IN 46033
$-552
Cash flow
-5.9%
Cash-on-Cash Return
4.8%
Cap rate
0.6%
Rent to Value Ratio

Active
$625,000
4
bds
|
3
ba
|
3,781
sqft
|
built
1989
1236 Beacon Ct, Carmel, IN 46032
$-1,285
Cash flow
-10.7%
Cash-on-Cash Return
3.7%
Cap rate
0.4%
Rent to Value Ratio

Active
$765,000
4
bds
|
4
ba
|
4,164
sqft
|
built
2013
12750 Moonseed Dr, Carmel, IN 46032
$-1,343
Cash flow
-9.2%
Cash-on-Cash Return
4.0%
Cap rate
0.5%
Rent to Value Ratio
Active
$549,900
4
bds
|
4
ba
|
3,422
sqft
|
built
1975
12705 Brookshire Pkwy, Carmel, IN 46033
$-341
Cash flow
-3.2%
Cash-on-Cash Return
5.4%
Cap rate
0.7%
Rent to Value Ratio
Active
$449,900
4
bds
|
3
ba
|
2,030
sqft
|
built
1988
516 Kent Ln, Carmel, IN 46032
$-373
Cash flow
-4.3%
Cash-on-Cash Return
5.2%
Cap rate
0.6%
Rent to Value Ratio