Indiana Investment Properties for Sale
Browse homes for sale and investment properties in Indiana. Refine your search by price, property type, or more.
Best cash flowing properties in Indiana
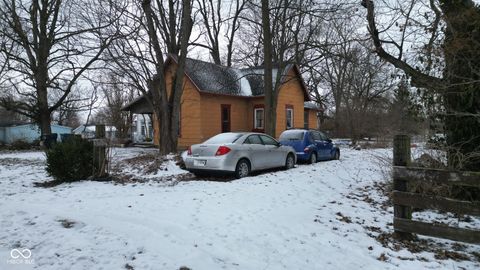
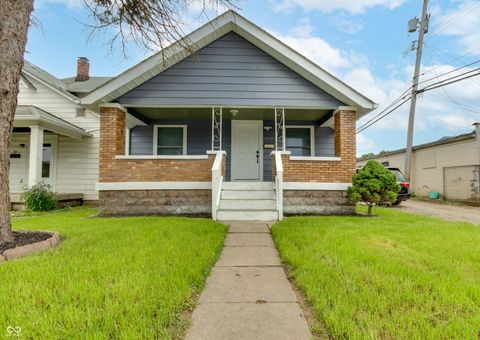
Active
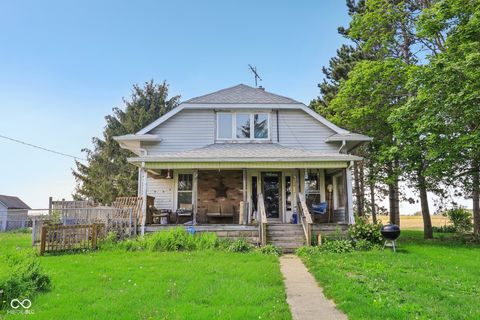
$72,000
2
bds
|
1
ba
|
1,205
sqft
|
built
1985
1621 Indiana Ave, Anderson, IN 46012
$828
Cash flow
13.4%
Cash-on-Cash Return
13.8%
Cap rate
1.7%
Rent to Value Ratio

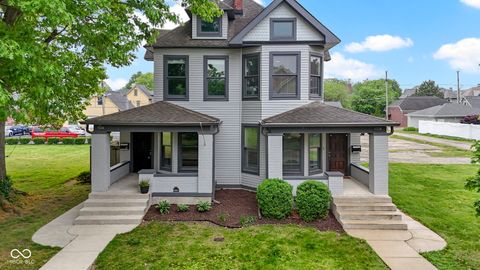
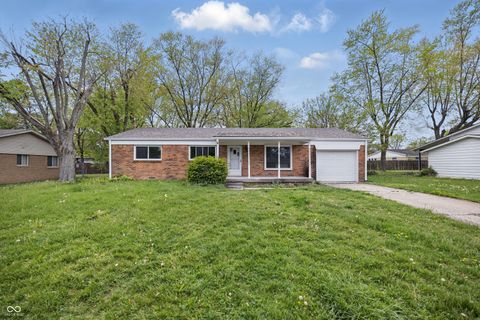
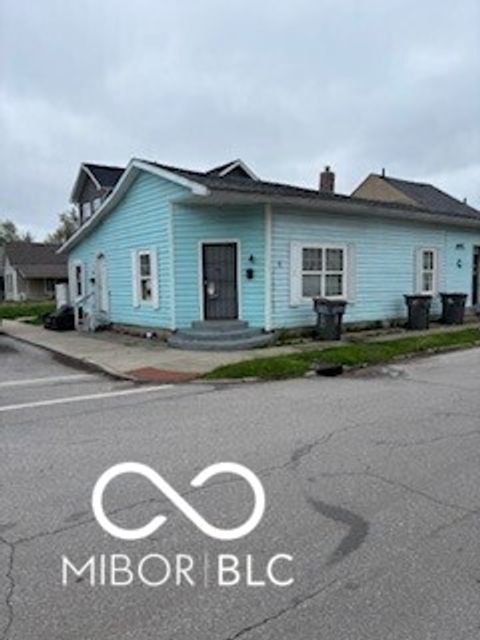
Active
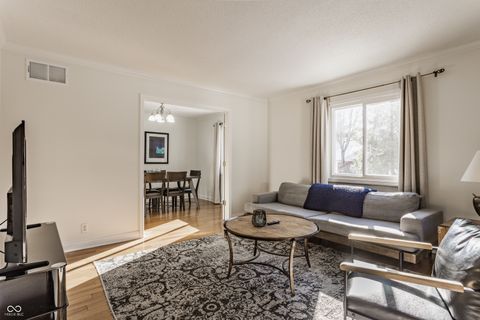
$112,000
2
bds
|
1
ba
|
888
sqft
|
built
1955
4106 N Pasadena Ave, Indianapolis, IN 46226
$392
Cash flow
18.3%
Cash-on-Cash Return
10.4%
Cap rate
1.3%
Rent to Value Ratio
3,634 out of 4,491 properties for sale in Indiana
Limited Results Shown
Create a free account, or log in to reveal all property listings and enjoy the complete experience.

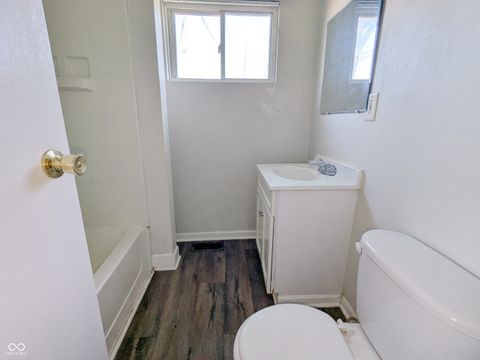
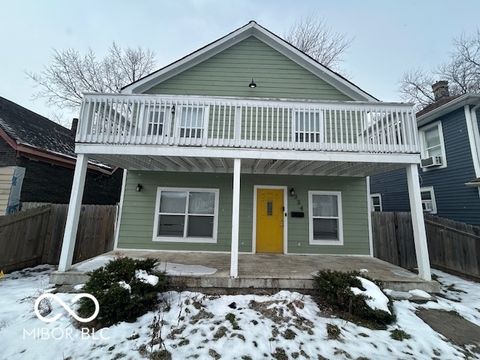
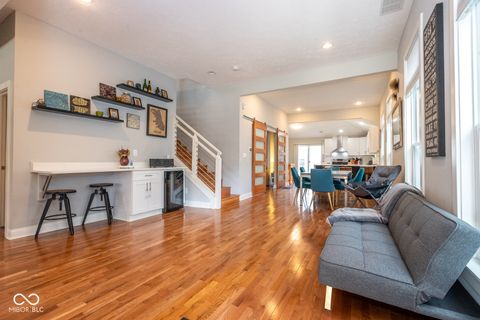
Active
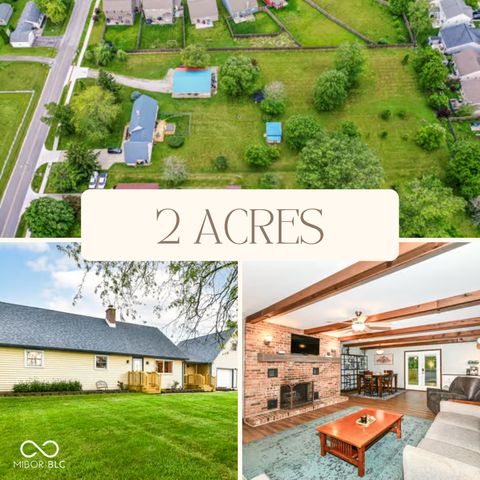
$291,000
3
bds
|
2
ba
|
1,926
sqft
|
built
2017
10112 James Run Dr, Indianapolis, IN 46239
$-136
Cash flow
-2.4%
Cash-on-Cash Return
5.6%
Cap rate
0.7%
Rent to Value Ratio
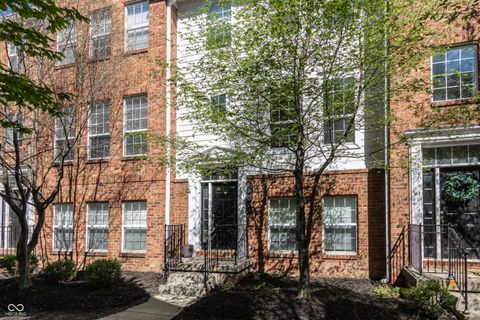
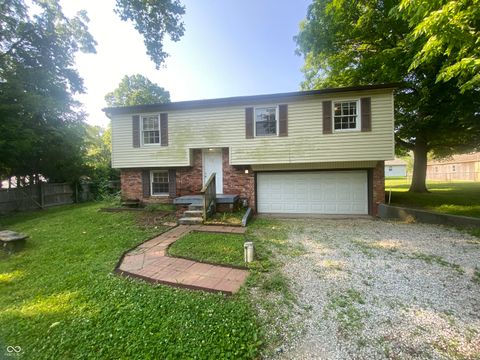
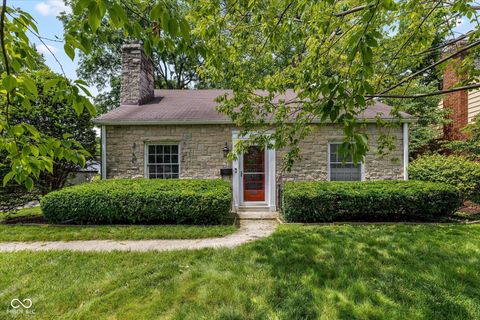
Active
$489,000
3
bds
|
4
ba
|
2,928
sqft
|
built
1902
1526 Carrollton Ave, Indianapolis, IN 46202
$-90
Cash flow
-1.0%
Cash-on-Cash Return
5.9%
Cap rate
0.7%
Rent to Value Ratio
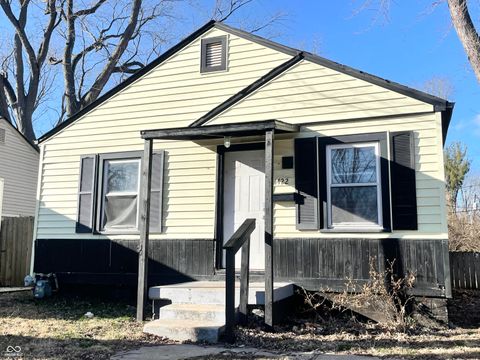
Active
$229,900
2
bds
|
0
ba
|
0
sqft
|
built
1920
408 E Beecher St, Indianapolis, IN 46225
$-281
Cash flow
-6.4%
Cash-on-Cash Return
4.7%
Cap rate
0.6%
Rent to Value Ratio

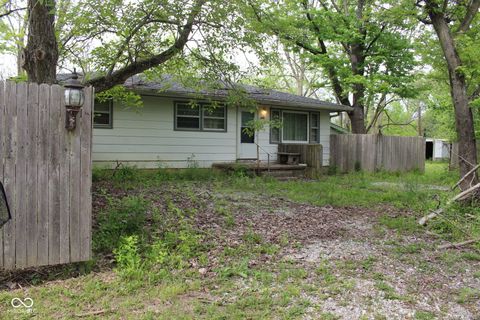
Active
$236,900
3
bds
|
3
ba
|
1,568
sqft
|
built
1924
1425 N Grant Ave, Indianapolis, IN 46201
$-455
Cash flow
-10.0%
Cash-on-Cash Return
3.8%
Cap rate
0.5%
Rent to Value Ratio

Active
$289,900
3
bds
|
3
ba
|
1,610
sqft
|
built
2002
12639 Justice Xing, Fishers, IN 46037
$-138
Cash flow
-2.5%
Cash-on-Cash Return
5.6%
Cap rate
0.7%
Rent to Value Ratio
Active
$335,000
2
bds
|
3
ba
|
1,160
sqft
|
built
2003
420 Beverly Ct, Carmel, IN 46032
$-333
Cash flow
-5.2%
Cash-on-Cash Return
5.0%
Cap rate
0.7%
Rent to Value Ratio
Active
$184,900
3
bds
|
3
ba
|
2,100
sqft
|
built
2017
334 S Hamilton Ave, Indianapolis, IN 46201
$157
Cash flow
4.4%
Cash-on-Cash Return
7.2%
Cap rate
0.9%
Rent to Value Ratio
Active
$206,000
3
bds
|
2
ba
|
1,980
sqft
|
built
1965
667 E Edgewood Ave, Indianapolis, IN 46227
$49
Cash flow
1.2%
Cash-on-Cash Return
6.4%
Cap rate
0.8%
Rent to Value Ratio
Active
$168,900
2
bds
|
1
ba
|
672
sqft
|
built
1947
1422 E 49th St, Indianapolis, IN 46205
$-37
Cash flow
-1.1%
Cash-on-Cash Return
5.9%
Cap rate
0.7%
Rent to Value Ratio
Active
$950,000
3
bds
|
1
ba
|
1,920
sqft
|
built
1960
338 E Park St, Westfield, IN 46074
$-3,762
Cash flow
-20.7%
Cash-on-Cash Return
1.4%
Cap rate
0.2%
Rent to Value Ratio
Active
$550,000
3
bds
|
2
ba
|
1,862
sqft
|
built
1950
5758 N 1200 E, Sheridan, IN 46069
$-1,299
Cash flow
-12.3%
Cash-on-Cash Return
3.3%
Cap rate
0.4%
Rent to Value Ratio
Active
$2,300,000
3
bds
|
1
ba
|
1,514
sqft
|
built
1890
3559 N US Highway 41, Bloomingdale, IN 47832
$-10,678
Cash flow
-24.2%
Cash-on-Cash Return
0.6%
Cap rate
0.1%
Rent to Value Ratio
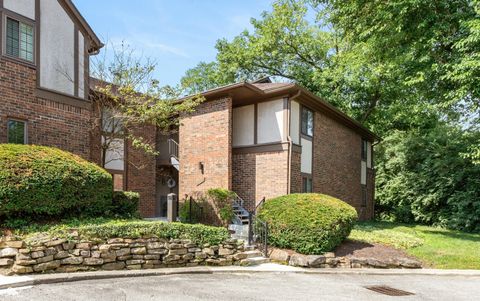
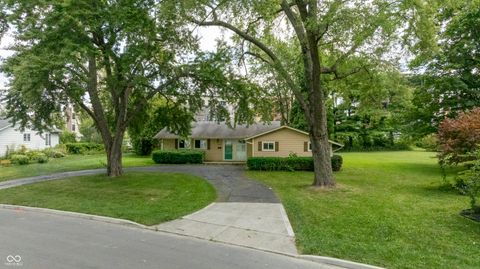
Active
$444,900
3
bds
|
3
ba
|
2,540
sqft
|
built
1978
30 Village Ct, Zionsville, IN 46077
$-71
Cash flow
-0.8%
Cash-on-Cash Return
6.0%
Cap rate
0.7%
Rent to Value Ratio

Active
$265,000
3
bds
|
2
ba
|
1,578
sqft
|
built
2006
5832 Cabot Dr, Indianapolis, IN 46221
$-138
Cash flow
-2.7%
Cash-on-Cash Return
5.5%
Cap rate
0.7%
Rent to Value Ratio
Active
$529,000
3
bds
|
2
ba
|
2,273
sqft
|
built
1979
1624 Riley Rd, Lebanon, IN 46052
$-1,123
Cash flow
-11.1%
Cash-on-Cash Return
3.6%
Cap rate
0.4%
Rent to Value Ratio
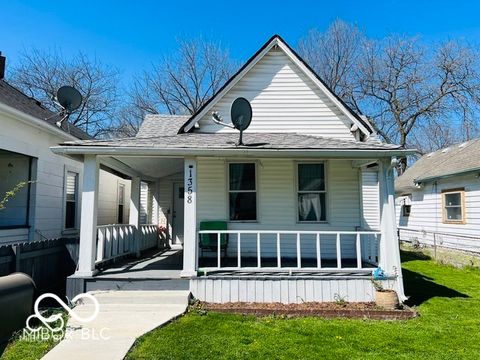
Active
$114,900
1
bds
|
1
ba
|
692
sqft
|
built
1955
1358 Hiatt St, Indianapolis, IN 46221
$101
Cash flow
4.6%
Cash-on-Cash Return
7.2%
Cap rate
0.9%
Rent to Value Ratio
Active
$675,000
4
bds
|
4
ba
|
2,405
sqft
|
built
2022
811 E Minnesota St, Indianapolis, IN 46203
$-353
Cash flow
-2.7%
Cash-on-Cash Return
5.5%
Cap rate
0.7%
Rent to Value Ratio
Active
$980,000
5
bds
|
6
ba
|
4,265
sqft
|
built
1955
543 Fletcher Ave, Indianapolis, IN 46203
$-3,019
Cash flow
-16.1%
Cash-on-Cash Return
2.5%
Cap rate
0.3%
Rent to Value Ratio
Active
$229,900
0
bds
|
0
ba
|
0
sqft
|
built
1920
2918 Ruckle St, Indianapolis, IN 46205
$-212
Cash flow
-4.8%
Cash-on-Cash Return
5.0%
Cap rate
0.6%
Rent to Value Ratio

Active
$415,000
4
bds
|
3
ba
|
3,496
sqft
|
built
1991
10398 Ethel St, Carmel, IN 46280
$-401
Cash flow
-5.0%
Cash-on-Cash Return
5.0%
Cap rate
0.6%
Rent to Value Ratio
Active
$459,000
3
bds
|
3
ba
|
2,089
sqft
|
built
2000
1334 E Market St, Indianapolis, IN 46202
$-626
Cash flow
-7.1%
Cash-on-Cash Return
4.5%
Cap rate
0.5%
Rent to Value Ratio
Active
$235,000
3
bds
|
2
ba
|
1,260
sqft
|
built
1962
1116 Heatherwood Dr, Indianapolis, IN 46241
$-100
Cash flow
-2.2%
Cash-on-Cash Return
5.6%
Cap rate
0.7%
Rent to Value Ratio
Active
$175,000
4
bds
|
2
ba
|
1,698
sqft
|
built
1921
517 N Alton Ave, Indianapolis, IN 46222
$-68
Cash flow
-2.0%
Cash-on-Cash Return
5.7%
Cap rate
0.7%
Rent to Value Ratio
Active
$399,900
3
bds
|
2
ba
|
2,089
sqft
|
built
1930
6030 Evanston Ave, Indianapolis, IN 46220
$-254
Cash flow
-3.3%
Cash-on-Cash Return
5.4%
Cap rate
0.7%
Rent to Value Ratio
Active
$225,000
3
bds
|
2
ba
|
1,200
sqft
|
built
1966
405 W Jacob St, Greencastle, IN 46135
$-49
Cash flow
-1.1%
Cash-on-Cash Return
5.9%
Cap rate
0.7%
Rent to Value Ratio
Active
$312,500
4
bds
|
3
ba
|
2,053
sqft
|
built
2021
851 Sonoma Ln, Greenfield, IN 46140
$97
Cash flow
1.6%
Cash-on-Cash Return
6.5%
Cap rate
0.8%
Rent to Value Ratio
Active
$374,900
4
bds
|
3
ba
|
2,801
sqft
|
built
2020
2261 Shadow Trace Way, Greenwood, IN 46143
$-224
Cash flow
-3.1%
Cash-on-Cash Return
5.4%
Cap rate
0.7%
Rent to Value Ratio

Active
$999,900
3
bds
|
4
ba
|
4,232
sqft
|
built
1982
22 Point Ln, Arcadia, IN 46030
$-2,362
Cash flow
-12.3%
Cash-on-Cash Return
3.3%
Cap rate
0.4%
Rent to Value Ratio
Active
$300,000
4
bds
|
0
ba
|
0
sqft
|
built
1920
1845 Barth Ave, Indianapolis, IN 46203
$-709
Cash flow
-12.3%
Cash-on-Cash Return
3.3%
Cap rate
0.4%
Rent to Value Ratio
Active
$149,900
3
bds
|
0
ba
|
0
sqft
|
built
1920
1602 E Minnesota St, Indianapolis, IN 46203
$-9
Cash flow
-0.3%
Cash-on-Cash Return
6.1%
Cap rate
0.7%
Rent to Value Ratio
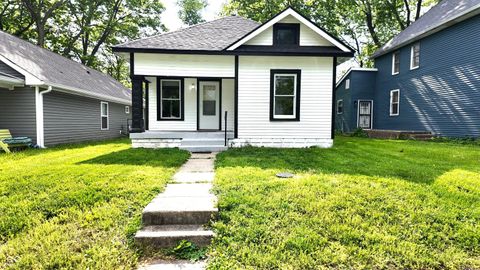
Active
$115,000
2
bds
|
1
ba
|
986
sqft
|
built
1936
1148 N Pershing Ave, Indianapolis, IN 46222
$377
Cash flow
17.1%
Cash-on-Cash Return
10.1%
Cap rate
1.2%
Rent to Value Ratio
Active
$145,000
2
bds
|
2
ba
|
1,362
sqft
|
built
1971
2267 Rome Dr, Indianapolis, IN 46228
$11
Cash flow
0.4%
Cash-on-Cash Return
6.2%
Cap rate
1.1%
Rent to Value Ratio
Active
$599,999
3
bds
|
2
ba
|
1,044
sqft
|
built
1959
449 Emerson Rd, Carmel, IN 46032
$-1,555
Cash flow
-13.5%
Cash-on-Cash Return
3.0%
Cap rate
0.4%
Rent to Value Ratio

Active
$119,000
4
bds
|
1
ba
|
1,714
sqft
|
built
1914
621 E 31st St, Anderson, IN 46016
$287
Cash flow
12.6%
Cash-on-Cash Return
9.0%
Cap rate
1.1%
Rent to Value Ratio

Active
$488,900
5
bds
|
3
ba
|
4,042
sqft
|
built
2007
12997 Bartlett Dr, Fishers, IN 46037
$-347
Cash flow
-3.7%
Cash-on-Cash Return
5.3%
Cap rate
0.7%
Rent to Value Ratio

Active
$159,900
3
bds
|
1
ba
|
892
sqft
|
built
1926
1606 Asbury St, Indianapolis, IN 46203
$9
Cash flow
0.3%
Cash-on-Cash Return
6.2%
Cap rate
0.8%
Rent to Value Ratio
Active
$120,000
2
bds
|
1
ba
|
720
sqft
|
built
1946
2966 N Olney St, Indianapolis, IN 46218
$75
Cash flow
3.3%
Cash-on-Cash Return
6.9%
Cap rate
0.8%
Rent to Value Ratio

Active
$775,000
5
bds
|
5
ba
|
5,758
sqft
|
built
2010
10555 Serra Vista Pt, Fishers, IN 46040
$-499
Cash flow
-3.4%
Cash-on-Cash Return
5.4%
Cap rate
0.7%
Rent to Value Ratio