Indian Rocks Beach, FL Investment Properties for Sale
Browse homes for sale and investment properties in Indian Rocks Beach, FL. Refine your search by price, property type, or more.
Best cash flowing properties in Indian Rocks Beach, FL
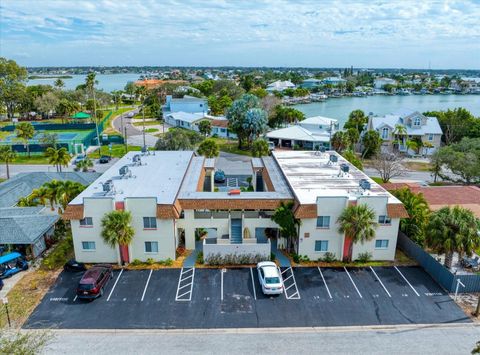
Active
$369,000
2
bds
|
1
ba
|
955
sqft
|
built
1976
1 Windrush Blvd, Indian Rocks Beach, FL 33785
$-622
Cash flow
-8.8%
Cash-on-Cash Return
4.1%
Cap rate
0.7%
Rent to Value Ratio
Active
$330,000
1
bds
|
1
ba
|
598
sqft
|
built
1972
2704 2nd St, Indian Rocks Beach, FL 33785
$-667
Cash flow
-10.5%
Cash-on-Cash Return
3.7%
Cap rate
0.5%
Rent to Value Ratio
65 out of 76 properties for sale in Indian Rocks Beach, FL
Limited Results Shown
Create a free account, or log in to reveal all property listings and enjoy the complete experience.
Active
$1,699,900
3
bds
|
3
ba
|
2,320
sqft
|
built
1983
2300 Beach Trl, Indian Rocks Beach, FL 33785
$-6,681
Cash flow
-20.5%
Cash-on-Cash Return
1.4%
Cap rate
0.3%
Rent to Value Ratio

Active
$499,900
2
bds
|
1
ba
|
920
sqft
|
built
1980
2109 Gulf Blvd, Indian Rocks Beach, FL 33785
$-792
Cash flow
-8.3%
Cash-on-Cash Return
4.2%
Cap rate
0.6%
Rent to Value Ratio
Active
$640,000
2
bds
|
2
ba
|
1,200
sqft
|
built
1982
2112 Gulf Blvd, Indian Rocks Beach, FL 33785
$-1,813
Cash flow
-14.8%
Cash-on-Cash Return
2.7%
Cap rate
0.5%
Rent to Value Ratio
Active
$1,200,000
2
bds
|
3
ba
|
1,795
sqft
|
built
1973
60 Gulf Blvd, Indian Rocks Beach, FL 33785
$-3,502
Cash flow
-15.2%
Cash-on-Cash Return
2.6%
Cap rate
0.5%
Rent to Value Ratio

Active
$695,000
2
bds
|
2
ba
|
1,200
sqft
|
built
1982
2112 Gulf Blvd, Indian Rocks Beach, FL 33785
$-2,558
Cash flow
-19.2%
Cash-on-Cash Return
1.7%
Cap rate
0.5%
Rent to Value Ratio

Active
$2,495,000
4
bds
|
12
ba
|
3,918
sqft
|
built
1970
2211 Bay Blvd, Indian Rocks Beach, FL 33785
$-12,478
Cash flow
-26.1%
Cash-on-Cash Return
0.1%
Cap rate
0.1%
Rent to Value Ratio

Active
$1,899,000
3
bds
|
3
ba
|
2,160
sqft
|
built
2009
604 Gulf Blvd, Indian Rocks Beach, FL 33785
$-8,279
Cash flow
-22.7%
Cash-on-Cash Return
0.9%
Cap rate
0.3%
Rent to Value Ratio
Active
$4,500,000
5
bds
|
0
ba
|
3,090
sqft
|
built
1932
516 Gulf Blvd, Indian Rocks Beach, FL 33785
$-22,666
Cash flow
-26.3%
Cash-on-Cash Return
0.1%
Cap rate
0.1%
Rent to Value Ratio
Active
$2,650,000
5
bds
|
5
ba
|
3,355
sqft
|
built
2004
357 12th Ave, Indian Rocks Beach, FL 33785
$-9,723
Cash flow
-19.1%
Cash-on-Cash Return
1.7%
Cap rate
0.4%
Rent to Value Ratio
Active
$4,485,000
14
bds
|
21
ba
|
8,575
sqft
|
built
1985
812 E Gulf Blvd, Indian Rocks Beach, FL 33785
$-24,471
Cash flow
-28.5%
Cash-on-Cash Return
-0.4%
Cap rate
0.1%
Rent to Value Ratio

Active
$850,000
3
bds
|
3
ba
|
1,546
sqft
|
built
1953
202 18th Ave, Indian Rocks Beach, FL 33785
$-2,878
Cash flow
-17.7%
Cash-on-Cash Return
2.1%
Cap rate
0.4%
Rent to Value Ratio
Active
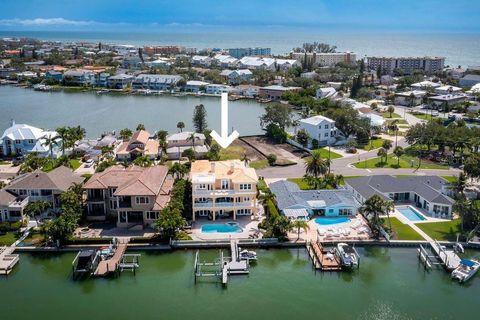
$3,900,000
5
bds
|
4
ba
|
4,571
sqft
|
built
2004
306 Harbor Dr, Indian Rocks Beach, FL 33785
$-17,123
Cash flow
-22.9%
Cash-on-Cash Return
0.9%
Cap rate
0.2%
Rent to Value Ratio
Active
$560,000
2
bds
|
2
ba
|
1,434
sqft
|
built
1977
123 11th Ave, Indian Rocks Beach, FL 33785
$-840
Cash flow
-7.8%
Cash-on-Cash Return
4.3%
Cap rate
0.7%
Rent to Value Ratio
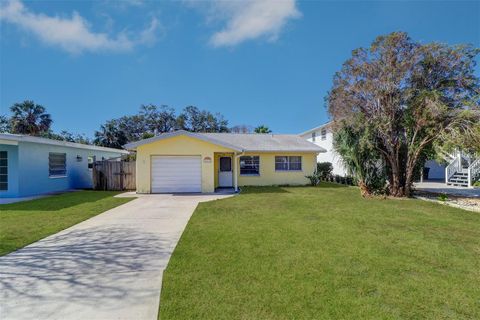
Active
$350,000
1
bds
|
1
ba
|
598
sqft
|
built
1972
2704 2nd St, Indian Rocks Beach, FL 33785
$-776
Cash flow
-11.6%
Cash-on-Cash Return
3.5%
Cap rate
0.5%
Rent to Value Ratio
Active
$530,000
3
bds
|
2
ba
|
1,292
sqft
|
built
1957
508 2nd St, Indian Rocks Beach, FL 33785
$-841
Cash flow
-8.3%
Cash-on-Cash Return
4.2%
Cap rate
0.7%
Rent to Value Ratio
Active
$437,000
3
bds
|
3
ba
|
1,390
sqft
|
built
1980
318 Windrush Blvd, Indian Rocks Beach, FL 33785
$-1,104
Cash flow
-13.2%
Cash-on-Cash Return
3.1%
Cap rate
0.8%
Rent to Value Ratio

Active
$875,000
3
bds
|
3
ba
|
1,935
sqft
|
built
2015
208 Haven Beach Ct, Indian Rocks Beach, FL 33785
$-2,848
Cash flow
-17.0%
Cash-on-Cash Return
2.2%
Cap rate
0.6%
Rent to Value Ratio

Active
$899,900
2
bds
|
2
ba
|
1,380
sqft
|
built
1993
24 Gulf Blvd, Indian Rocks Beach, FL 33785
$-2,947
Cash flow
-17.1%
Cash-on-Cash Return
2.2%
Cap rate
0.4%
Rent to Value Ratio
Active
$1,834,900
5
bds
|
4
ba
|
2,910
sqft
|
built
1985
328 6th Ave, Indian Rocks Beach, FL 33785
$-5,677
Cash flow
-16.1%
Cash-on-Cash Return
2.4%
Cap rate
0.4%
Rent to Value Ratio

Active
$1,260,000
2
bds
|
2
ba
|
1,551
sqft
|
built
1960
500 20th Ave, Indian Rocks Beach, FL 33785
$-4,127
Cash flow
-17.1%
Cash-on-Cash Return
2.2%
Cap rate
0.5%
Rent to Value Ratio
Active
$995,000
4
bds
|
3
ba
|
3,136
sqft
|
built
1979
1210 Bay Pine Blvd, Indian Rocks Beach, FL 33785
$-1,990
Cash flow
-10.4%
Cash-on-Cash Return
3.7%
Cap rate
0.6%
Rent to Value Ratio

Active
$559,900
3
bds
|
2
ba
|
1,320
sqft
|
built
1957
301 14th Ave, Indian Rocks Beach, FL 33785
$-1,014
Cash flow
-9.4%
Cash-on-Cash Return
4.0%
Cap rate
0.6%
Rent to Value Ratio

Active
$725,000
2
bds
|
1
ba
|
1,064
sqft
|
built
1970
819 Gulf Blvd, Indian Rocks Beach, FL 33785
$-1,084
Cash flow
-7.8%
Cash-on-Cash Return
4.4%
Cap rate
0.6%
Rent to Value Ratio
Active
$625,000
3
bds
|
2
ba
|
1,566
sqft
|
built
1993
659 Garland Cir, Indian Rocks Beach, FL 33785
$-1,638
Cash flow
-13.7%
Cash-on-Cash Return
3.0%
Cap rate
0.6%
Rent to Value Ratio

Active
$699,000
3
bds
|
3
ba
|
1,530
sqft
|
built
2006
512 1st St, Indian Rocks Beach, FL 33785
$-1,738
Cash flow
-13.0%
Cash-on-Cash Return
3.2%
Cap rate
0.7%
Rent to Value Ratio

Active
$1,595,000
4
bds
|
4
ba
|
1,250
sqft
|
built
1925
722 Gulf Blvd, Indian Rocks Beach, FL 33785
$-5,950
Cash flow
-19.5%
Cash-on-Cash Return
1.7%
Cap rate
0.3%
Rent to Value Ratio
Active
$485,000
2
bds
|
2
ba
|
1,465
sqft
|
built
1994
616 Garland Cir, Indian Rocks Beach, FL 33785
$-1,483
Cash flow
-16.0%
Cash-on-Cash Return
2.5%
Cap rate
0.7%
Rent to Value Ratio
Active
$1,199,999
2
bds
|
3
ba
|
2,367
sqft
|
built
2006
215 18th Ave, Indian Rocks Beach, FL 33785
$-3,816
Cash flow
-16.6%
Cash-on-Cash Return
2.3%
Cap rate
0.4%
Rent to Value Ratio

Active
$495,000
2
bds
|
2
ba
|
1,200
sqft
|
built
1973
829 E Gulf Blvd, Indian Rocks Beach, FL 33785
$-1,705
Cash flow
-18.0%
Cash-on-Cash Return
2.0%
Cap rate
0.6%
Rent to Value Ratio

Active
$469,000
2
bds
|
2
ba
|
702
sqft
|
built
1959
306 12th Ave, Indian Rocks Beach, FL 33785
$-991
Cash flow
-11.0%
Cash-on-Cash Return
3.6%
Cap rate
0.5%
Rent to Value Ratio

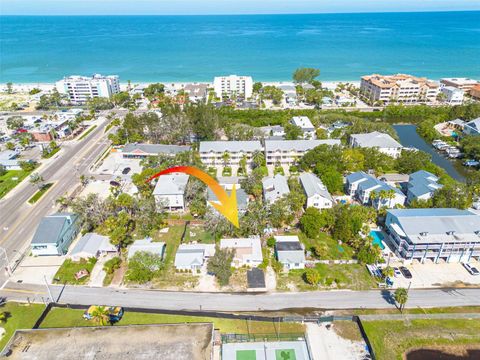
Active
$689,000
3
bds
|
2
ba
|
1,242
sqft
|
built
1951
366 12th Ave, Indian Rocks Beach, FL 33785
$-1,741
Cash flow
-13.2%
Cash-on-Cash Return
3.1%
Cap rate
0.4%
Rent to Value Ratio
Active
$3,250,000
4
bds
|
5
ba
|
3,400
sqft
|
built
2021
371 12th Ave, Indian Rocks Beach, FL 33785
$-12,135
Cash flow
-19.5%
Cash-on-Cash Return
1.7%
Cap rate
0.3%
Rent to Value Ratio

Active
$975,000
2
bds
|
2
ba
|
1,506
sqft
|
built
1957
365 La Hacienda Dr, Indian Rocks Beach, FL 33785
$-2,237
Cash flow
-12.0%
Cash-on-Cash Return
3.4%
Cap rate
0.5%
Rent to Value Ratio

Active
$924,900
3
bds
|
2
ba
|
1,530
sqft
|
built
1981
2504 Gulf Blvd, Indian Rocks Beach, FL 33785
$-2,160
Cash flow
-12.2%
Cash-on-Cash Return
3.3%
Cap rate
0.4%
Rent to Value Ratio
Active
$1,075,000
3
bds
|
3
ba
|
1,812
sqft
|
built
2017
100 Windrush Blvd, Indian Rocks Beach, FL 33785
$-3,189
Cash flow
-15.5%
Cash-on-Cash Return
2.6%
Cap rate
0.5%
Rent to Value Ratio

Active
$1,650,000
3
bds
|
2
ba
|
1,434
sqft
|
built
1940
300 10th Ave, Indian Rocks Beach, FL 33785
$-4,207
Cash flow
-13.3%
Cash-on-Cash Return
3.1%
Cap rate
0.5%
Rent to Value Ratio
Active
$1,299,500
3
bds
|
3
ba
|
1,950
sqft
|
built
1948
425 12th Ave, Indian Rocks Beach, FL 33785
$-4,374
Cash flow
-17.6%
Cash-on-Cash Return
2.1%
Cap rate
0.4%
Rent to Value Ratio

Active
$575,000
2
bds
|
2
ba
|
1,210
sqft
|
built
1982
619 2nd St, Indian Rocks Beach, FL 33785
$-1,137
Cash flow
-10.3%
Cash-on-Cash Return
3.8%
Cap rate
0.6%
Rent to Value Ratio