Indian Shores, FL Investment Properties for Sale
Browse homes for sale and investment properties in Indian Shores, FL. Refine your search by price, property type, or more.
Best cash flowing properties in Indian Shores, FL
Active
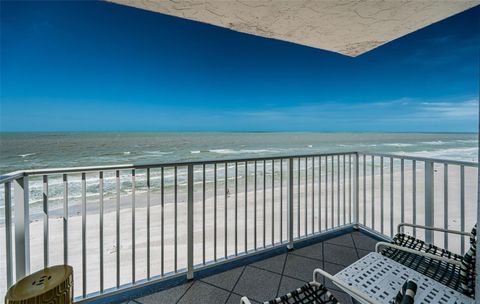
$465,000
2
bds
|
2
ba
|
1,320
sqft
|
built
1982
19531 Gulf Blvd, Indian Shores, FL 33785
$-13
Cash flow
-0.1%
Cash-on-Cash Return
6.1%
Cap rate
0.9%
Rent to Value Ratio

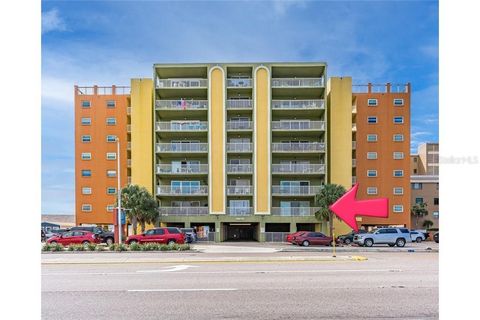
Active
$549,900
2
bds
|
2
ba
|
1,225
sqft
|
built
1976
19451 Gulf Blvd, Indian Shores, FL 33785
$-1,029
Cash flow
-9.8%
Cash-on-Cash Return
3.9%
Cap rate
0.6%
Rent to Value Ratio
32 out of 35 properties for sale in Indian Shores, FL
Limited Results Shown
Create a free account, or log in to reveal all property listings and enjoy the complete experience.
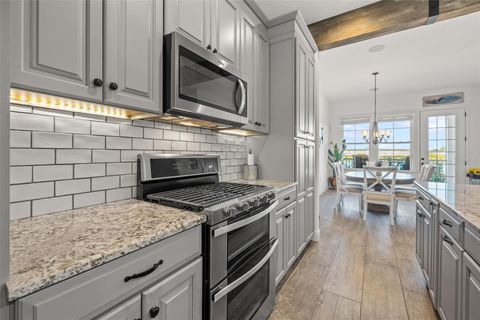
Active
$640,000
2
bds
|
2
ba
|
1,100
sqft
|
built
1973
19610 Gulf Blvd, Indian Shores, FL 33785
$-1,456
Cash flow
-11.9%
Cash-on-Cash Return
3.4%
Cap rate
0.6%
Rent to Value Ratio
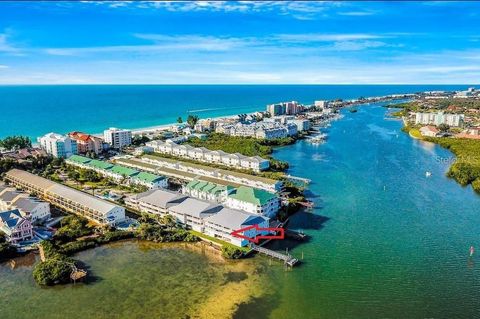
Active
$525,000
2
bds
|
2
ba
|
1,145
sqft
|
built
1979
19725 Gulf Blvd, Indian Shores, FL 33785
$-1,721
Cash flow
-17.1%
Cash-on-Cash Return
2.2%
Cap rate
0.7%
Rent to Value Ratio
Active
$1,490,000
3
bds
|
3
ba
|
1,740
sqft
|
built
1982
19700 Gulf Blvd, Indian Shores, FL 33785
$-4,120
Cash flow
-14.4%
Cash-on-Cash Return
2.8%
Cap rate
0.4%
Rent to Value Ratio
Active
$4,350,000
4
bds
|
4
ba
|
3,620
sqft
|
built
2018
19816 Gulf Blvd, Indian Shores, FL 33785
$-20,417
Cash flow
-24.5%
Cash-on-Cash Return
0.5%
Cap rate
0.2%
Rent to Value Ratio
Active
$995,000
2
bds
|
2
ba
|
1,380
sqft
|
built
1983
18400 Gulf Blvd, Indian Shores, FL 33785
$-2,595
Cash flow
-13.6%
Cash-on-Cash Return
3.0%
Cap rate
0.5%
Rent to Value Ratio

Active
$715,000
3
bds
|
3
ba
|
1,500
sqft
|
built
1992
19201 Vista Ln, Indian Shores, FL 33785
$-1,040
Cash flow
-7.6%
Cash-on-Cash Return
4.4%
Cap rate
0.7%
Rent to Value Ratio
Active
$1,595,000
3
bds
|
3
ba
|
1,960
sqft
|
built
1979
19812 Gulf Blvd, Indian Shores, FL 33785
$-6,787
Cash flow
-22.2%
Cash-on-Cash Return
1.0%
Cap rate
0.3%
Rent to Value Ratio
Active
$800,000
2
bds
|
2
ba
|
1,400
sqft
|
built
1982
18400 Gulf Blvd, Indian Shores, FL 33785
$-2,547
Cash flow
-16.6%
Cash-on-Cash Return
2.3%
Cap rate
0.4%
Rent to Value Ratio

Active
$1,200,000
3
bds
|
2
ba
|
1,425
sqft
|
built
1980
19418 Gulf Blvd, Indian Shores, FL 33785
$-4,156
Cash flow
-18.1%
Cash-on-Cash Return
2.0%
Cap rate
0.4%
Rent to Value Ratio
Active
$789,000
2
bds
|
2
ba
|
1,400
sqft
|
built
1982
18400 Gulf Blvd, Indian Shores, FL 33785
$-1,961
Cash flow
-13.0%
Cash-on-Cash Return
3.2%
Cap rate
0.5%
Rent to Value Ratio
Active
$699,000
2
bds
|
2
ba
|
1,100
sqft
|
built
1981
19931 Gulf Blvd, Indian Shores, FL 33785
$-1,865
Cash flow
-13.9%
Cash-on-Cash Return
2.9%
Cap rate
0.5%
Rent to Value Ratio
Active
$634,900
2
bds
|
2
ba
|
1,100
sqft
|
built
1973
19610 Gulf Blvd, Indian Shores, FL 33785
$-1,372
Cash flow
-11.3%
Cash-on-Cash Return
3.6%
Cap rate
0.6%
Rent to Value Ratio

Active
$6,190,000
4
bds
|
5
ba
|
3,207
sqft
|
built
1987
20060 Gulf Blvd, Indian Shores, FL 33785
$-31,262
Cash flow
-26.3%
Cash-on-Cash Return
0.1%
Cap rate
0.1%
Rent to Value Ratio

Active
$569,000
2
bds
|
2
ba
|
1,073
sqft
|
built
1995
19717 Gulf Blvd, Indian Shores, FL 33785
$-1,449
Cash flow
-13.3%
Cash-on-Cash Return
3.1%
Cap rate
0.6%
Rent to Value Ratio
Active
$8,800,000
4
bds
|
5
ba
|
4,987
sqft
|
built
2017
2 Gulf Blvd, Indian Shores, FL 33785
$-43,991
Cash flow
-26.1%
Cash-on-Cash Return
0.1%
Cap rate
0.1%
Rent to Value Ratio

Active
$949,000
3
bds
|
2
ba
|
1,435
sqft
|
built
1982
18400 Gulf Blvd, Indian Shores, FL 33785
$-3,420
Cash flow
-18.8%
Cash-on-Cash Return
1.8%
Cap rate
0.4%
Rent to Value Ratio

Active
$725,000
2
bds
|
2
ba
|
1,535
sqft
|
built
2004
19817 Gulf Blvd, Indian Shores, FL 33785
$-1,469
Cash flow
-10.6%
Cash-on-Cash Return
3.7%
Cap rate
0.6%
Rent to Value Ratio
Active
$725,000
2
bds
|
2
ba
|
1,140
sqft
|
built
1974
18650 Gulf Blvd, Indian Shores, FL 33785
$-2,075
Cash flow
-14.9%
Cash-on-Cash Return
2.7%
Cap rate
0.4%
Rent to Value Ratio

Active
$579,000
2
bds
|
2
ba
|
1,050
sqft
|
built
1976
19451 Gulf Blvd, Indian Shores, FL 33785
$-1,322
Cash flow
-11.9%
Cash-on-Cash Return
3.4%
Cap rate
0.6%
Rent to Value Ratio

Active
$557,500
2
bds
|
2
ba
|
1,320
sqft
|
built
1982
19531 Gulf Blvd, Indian Shores, FL 33785
$-1,752
Cash flow
-16.4%
Cash-on-Cash Return
2.4%
Cap rate
0.6%
Rent to Value Ratio

Active
$535,000
2
bds
|
3
ba
|
1,225
sqft
|
built
1980
19823 Gulf Blvd, Indian Shores, FL 33785
$-1,678
Cash flow
-16.4%
Cash-on-Cash Return
2.4%
Cap rate
0.7%
Rent to Value Ratio

Active
$7,750,000
4
bds
|
6
ba
|
4,490
sqft
|
built
2016
20256 Gulf Blvd, Indian Shores, FL 33785
$-39,995
Cash flow
-26.9%
Cash-on-Cash Return
0.0%
Cap rate
0.1%
Rent to Value Ratio

Active
$1,450,000
3
bds
|
4
ba
|
2,400
sqft
|
built
1985
19941 Gulf Blvd, Indian Shores, FL 33785
$-5,327
Cash flow
-19.2%
Cash-on-Cash Return
1.7%
Cap rate
0.4%
Rent to Value Ratio

Active
$1,299,999
3
bds
|
4
ba
|
2,298
sqft
|
built
2016
19915 Gulf Blvd, Indian Shores, FL 33785
$-5,139
Cash flow
-20.6%
Cash-on-Cash Return
1.4%
Cap rate
0.4%
Rent to Value Ratio
Active
$650,000
2
bds
|
2
ba
|
1,130
sqft
|
built
1974
18610 Gulf Blvd, Indian Shores, FL 33785
$-1,607
Cash flow
-12.9%
Cash-on-Cash Return
3.2%
Cap rate
0.5%
Rent to Value Ratio
Active
$1,335,000
4
bds
|
4
ba
|
2,236
sqft
|
built
2018
19915 Gulf Blvd, Indian Shores, FL 33785
$-3,618
Cash flow
-14.1%
Cash-on-Cash Return
2.9%
Cap rate
0.6%
Rent to Value Ratio
Active
$629,999
2
bds
|
2
ba
|
1,140
sqft
|
built
2002
19811 Gulf Blvd, Indian Shores, FL 33785
$-1,406
Cash flow
-11.6%
Cash-on-Cash Return
3.5%
Cap rate
0.6%
Rent to Value Ratio

Active
$6,700,000
6
bds
|
6
ba
|
4,602
sqft
|
built
1987
20052 Gulf Blvd, Indian Shores, FL 33785
$-34,779
Cash flow
-27.1%
Cash-on-Cash Return
-0.1%
Cap rate
0.1%
Rent to Value Ratio

Active
$6,700,000
6
bds
|
6
ba
|
4,602
sqft
|
built
1985
20051 Gulf Blvd, Indian Shores, FL 33785
$-34,779
Cash flow
-27.1%
Cash-on-Cash Return
-0.1%
Cap rate
0.1%
Rent to Value Ratio

Active
$640,000
2
bds
|
2
ba
|
1,100
sqft
|
built
1973
19610 Gulf Blvd, Indian Shores, FL 33785
$-1,386
Cash flow
-11.3%
Cash-on-Cash Return
3.5%
Cap rate
0.5%
Rent to Value Ratio