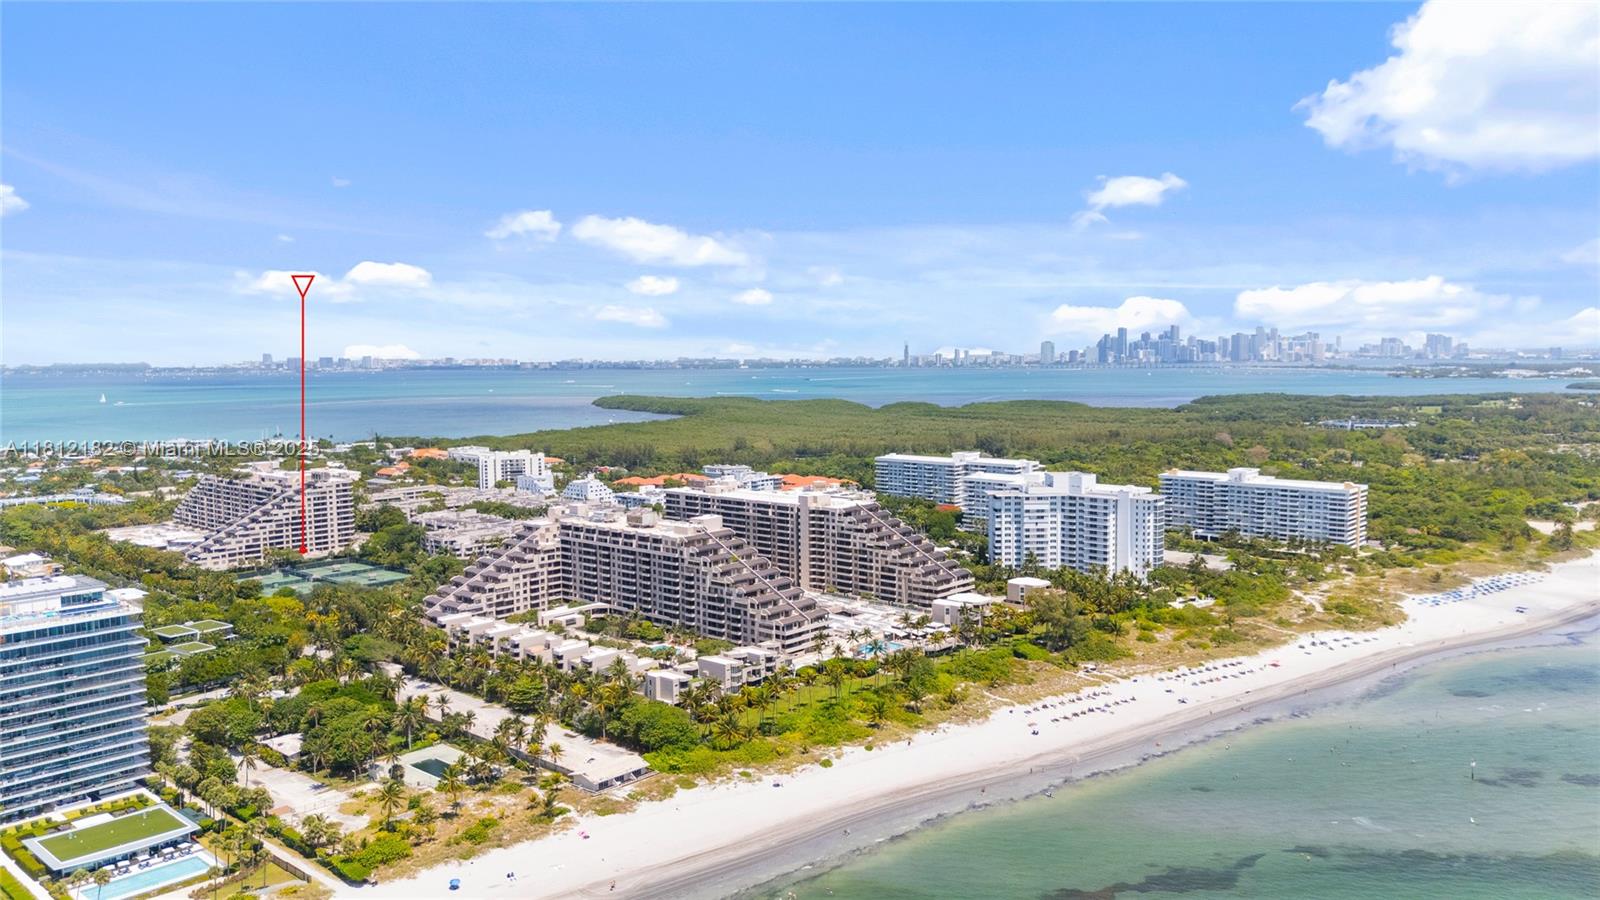
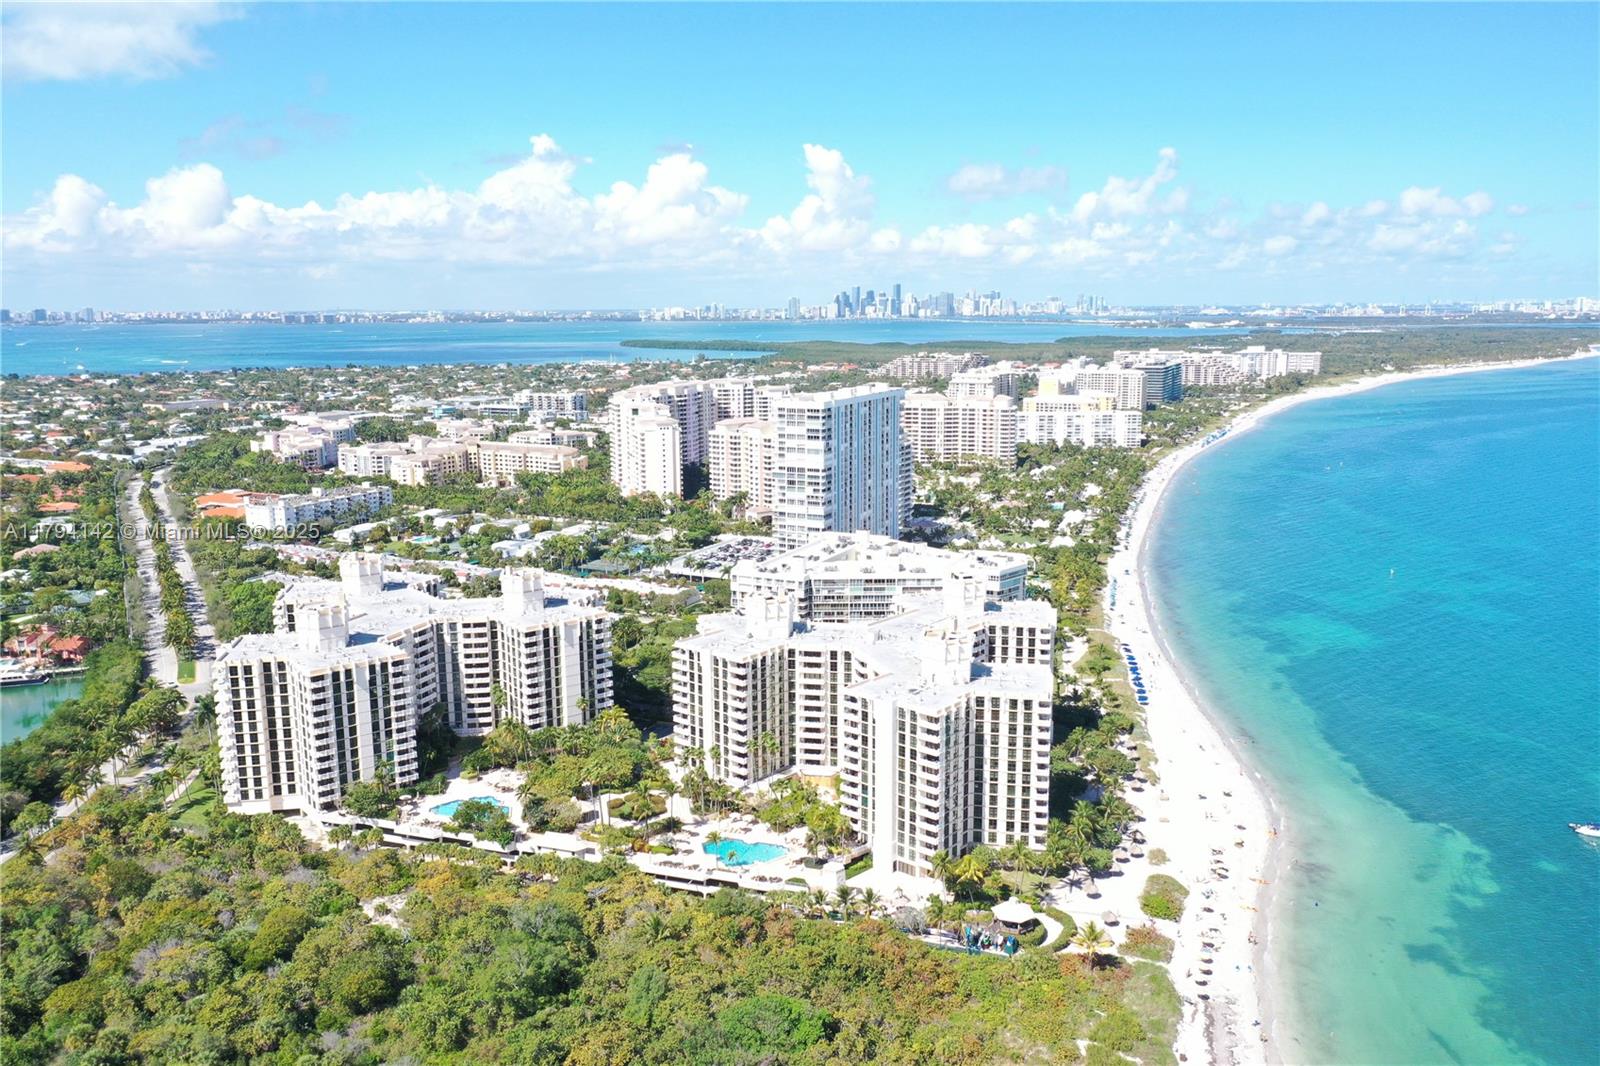
Key Biscayne, FL Investment Properties for Sale
Browse homes for sale and investment properties in Key Biscayne, FL. Refine your search by price, property type, or more.
Best cash flowing properties in Key Biscayne, FL

Active
$499,000
1
bds
|
1
ba
|
690
sqft
|
built
1969
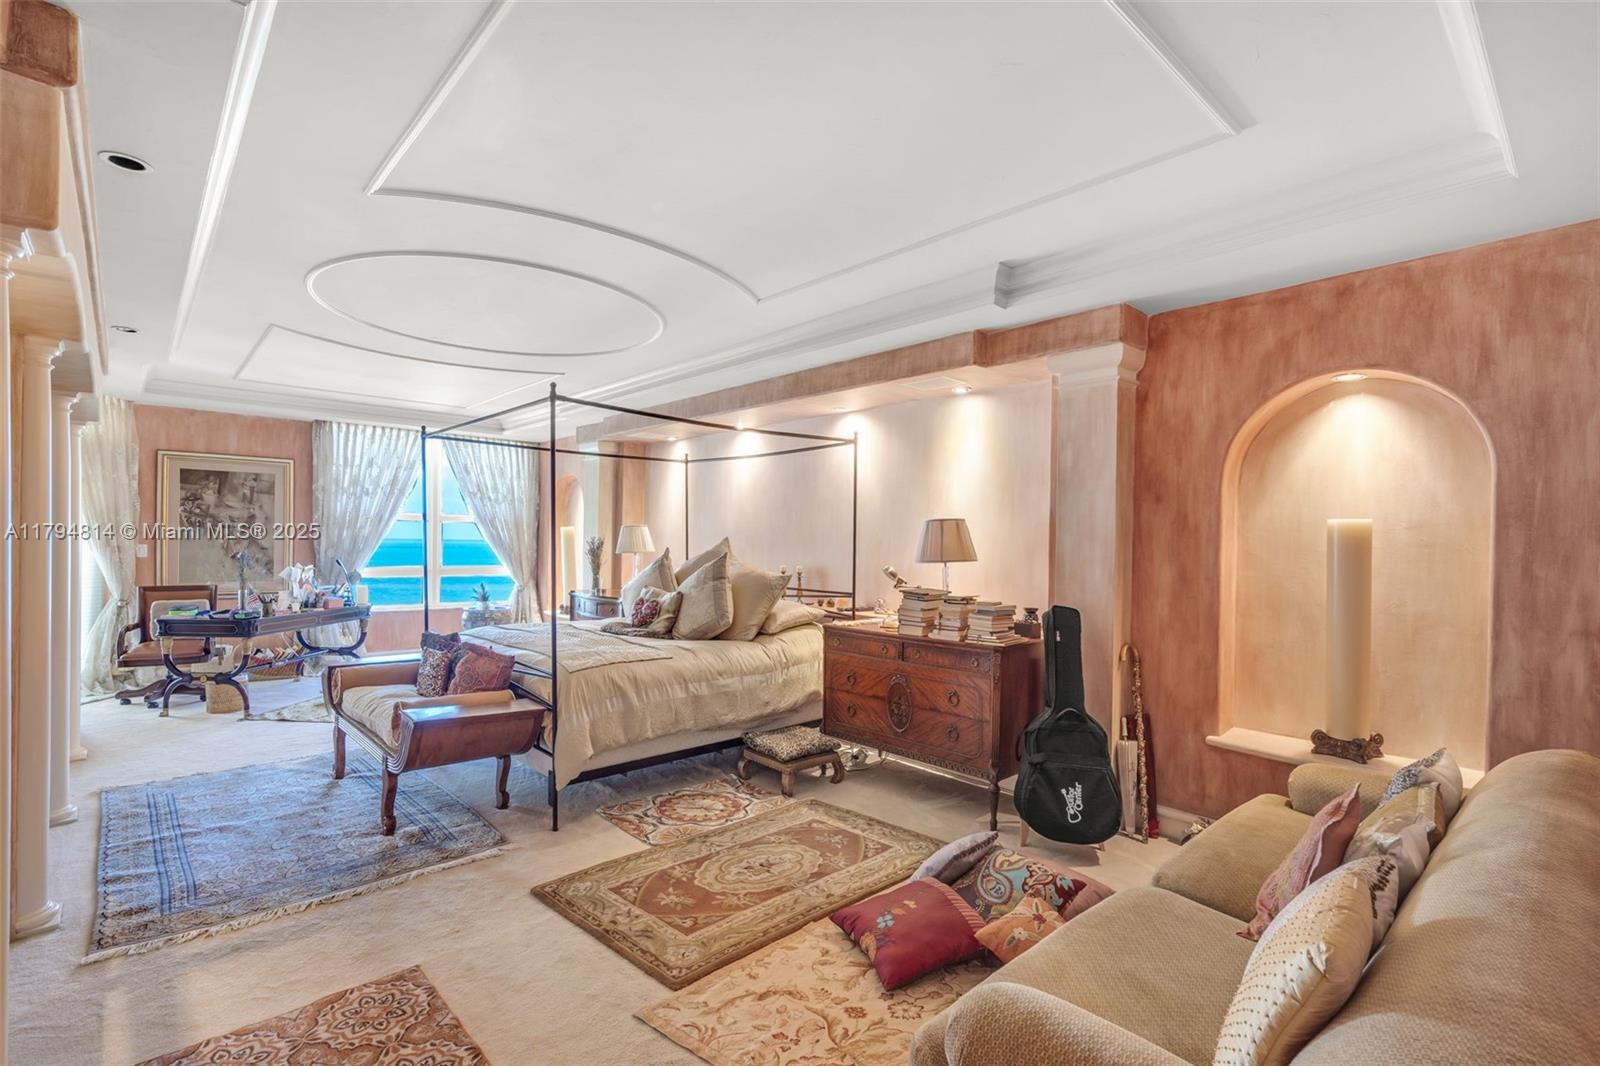
200 Galen Dr, Key Biscayne, FL 33149
$-997
Cash flow
-10.4%
Cash-on-Cash Return
3.7%
Cap rate
0.7%
Rent to Value Ratio

Active
$799,500
2
bds
|
2
ba
|
1,242
sqft
|
built
1973
100 Ocean Lane Dr, Key Biscayne, FL 33149
$-1,907
Cash flow
-12.4%
Cash-on-Cash Return
3.3%
Cap rate
0.6%
Rent to Value Ratio
165 out of 171 properties for sale in Key Biscayne, FL
Limited Results Shown
Create a free account, or log in to reveal all property listings and enjoy the complete experience.
Active
$1,420,000
2
bds
|
2
ba
|
1,506
sqft
|
built
1980
151 Crandon Blvd, Key Biscayne, FL 33149
$-5,371
Cash flow
-19.7%
Cash-on-Cash Return
1.6%
Cap rate
0.5%
Rent to Value Ratio
Active
$1,450,000
2
bds
|
2
ba
|
1,409
sqft
|
built
1972
1111 Crandon Blvd, Key Biscayne, FL 33149
$-4,818
Cash flow
-17.3%
Cash-on-Cash Return
2.2%
Cap rate
0.4%
Rent to Value Ratio
Active
$3,900,000
4
bds
|
3
ba
|
3,004
sqft
|
built
1951
345 Harbor Ln, Key Biscayne, FL 33149
$-16,468
Cash flow
-22.0%
Cash-on-Cash Return
1.1%
Cap rate
0.2%
Rent to Value Ratio
Active
$3,150,000
2
bds
|
3
ba
|
2,100
sqft
|
built
1999
781 Crandon Blvd, Key Biscayne, FL 33149
$-13,972
Cash flow
-23.1%
Cash-on-Cash Return
0.8%
Cap rate
0.3%
Rent to Value Ratio
Active
$1,425,000
3
bds
|
2
ba
|
1,600
sqft
|
built
1981
181 Crandon Blvd, Key Biscayne, FL 33149
$-5,012
Cash flow
-18.4%
Cash-on-Cash Return
1.9%
Cap rate
0.5%
Rent to Value Ratio
Active
$25,000,000
4
bds
|
5
ba
|
3,241
sqft
|
built
1965
699 N Mashta Dr, Key Biscayne, FL 33149
$-130,255
Cash flow
-27.2%
Cash-on-Cash Return
-0.1%
Cap rate
0.0%
Rent to Value Ratio
Active
$2,399,000
4
bds
|
4
ba
|
1,750
sqft
|
built
2024
200 Sunrise Dr, Key Biscayne, FL 33149
$-10,143
Cash flow
-22.1%
Cash-on-Cash Return
1.1%
Cap rate
0.2%
Rent to Value Ratio
Active
$2,600,000
2
bds
|
2
ba
|
1,450
sqft
|
built
1997
713 Crandon Blvd, Key Biscayne, FL 33149
$-10,265
Cash flow
-20.6%
Cash-on-Cash Return
1.4%
Cap rate
0.3%
Rent to Value Ratio
Active
$1,300,000
2
bds
|
2
ba
|
1,547
sqft
|
built
1980
151 Crandon Blvd, Key Biscayne, FL 33149
$-5,238
Cash flow
-21.0%
Cash-on-Cash Return
1.3%
Cap rate
0.5%
Rent to Value Ratio
Active
$14,000,000
6
bds
|
8
ba
|
6,405
sqft
|
built
2017
420 Island Dr, Key Biscayne, FL 33149
$-72,832
Cash flow
-27.1%
Cash-on-Cash Return
-0.1%
Cap rate
0.1%
Rent to Value Ratio

Active
$1,495,000
2
bds
|
2
ba
|
1,541
sqft
|
built
1978
201 Crandon Blvd, Key Biscayne, FL 33149
$-5,888
Cash flow
-20.5%
Cash-on-Cash Return
1.4%
Cap rate
0.5%
Rent to Value Ratio
Active
$915,000
2
bds
|
2
ba
|
1,311
sqft
|
built
1975
575 Crandon Blvd, Key Biscayne, FL 33149
$-4,952
Cash flow
-28.2%
Cash-on-Cash Return
-0.3%
Cap rate
0.5%
Rent to Value Ratio
Active
$4,750,000
6
bds
|
6
ba
|
4,132
sqft
|
built
2003
400 Woodcrest Rd, Key Biscayne, FL 33149
$-22,148
Cash flow
-24.3%
Cash-on-Cash Return
0.6%
Cap rate
0.1%
Rent to Value Ratio
Active
$1,099,000
3
bds
|
2
ba
|
1,720
sqft
|
built
1981
121 Crandon Blvd, Key Biscayne, FL 33149
$-3,850
Cash flow
-18.3%
Cash-on-Cash Return
1.9%
Cap rate
0.7%
Rent to Value Ratio

Active
$1,650,000
2
bds
|
2
ba
|
1,531
sqft
|
built
1978
201 Crandon Blvd, Key Biscayne, FL 33149
$-4,317
Cash flow
-13.7%
Cash-on-Cash Return
3.0%
Cap rate
0.5%
Rent to Value Ratio
Active
$1,250,000
2
bds
|
2
ba
|
1,532
sqft
|
built
1979
251 Crandon Blvd, Key Biscayne, FL 33149
$-3,963
Cash flow
-16.5%
Cash-on-Cash Return
2.3%
Cap rate
0.6%
Rent to Value Ratio
Active
$1,180,000
3
bds
|
2
ba
|
1,715
sqft
|
built
1981
161 Crandon Blvd, Key Biscayne, FL 33149
$-3,925
Cash flow
-17.4%
Cash-on-Cash Return
2.2%
Cap rate
0.6%
Rent to Value Ratio
Active
$2,990,000
3
bds
|
2
ba
|
1,391
sqft
|
built
1953
250 Fernwood Rd, Key Biscayne, FL 33149
$-13,365
Cash flow
-23.3%
Cash-on-Cash Return
0.8%
Cap rate
0.2%
Rent to Value Ratio
Active
$5,500,000
5
bds
|
5
ba
|
3,595
sqft
|
built
2000
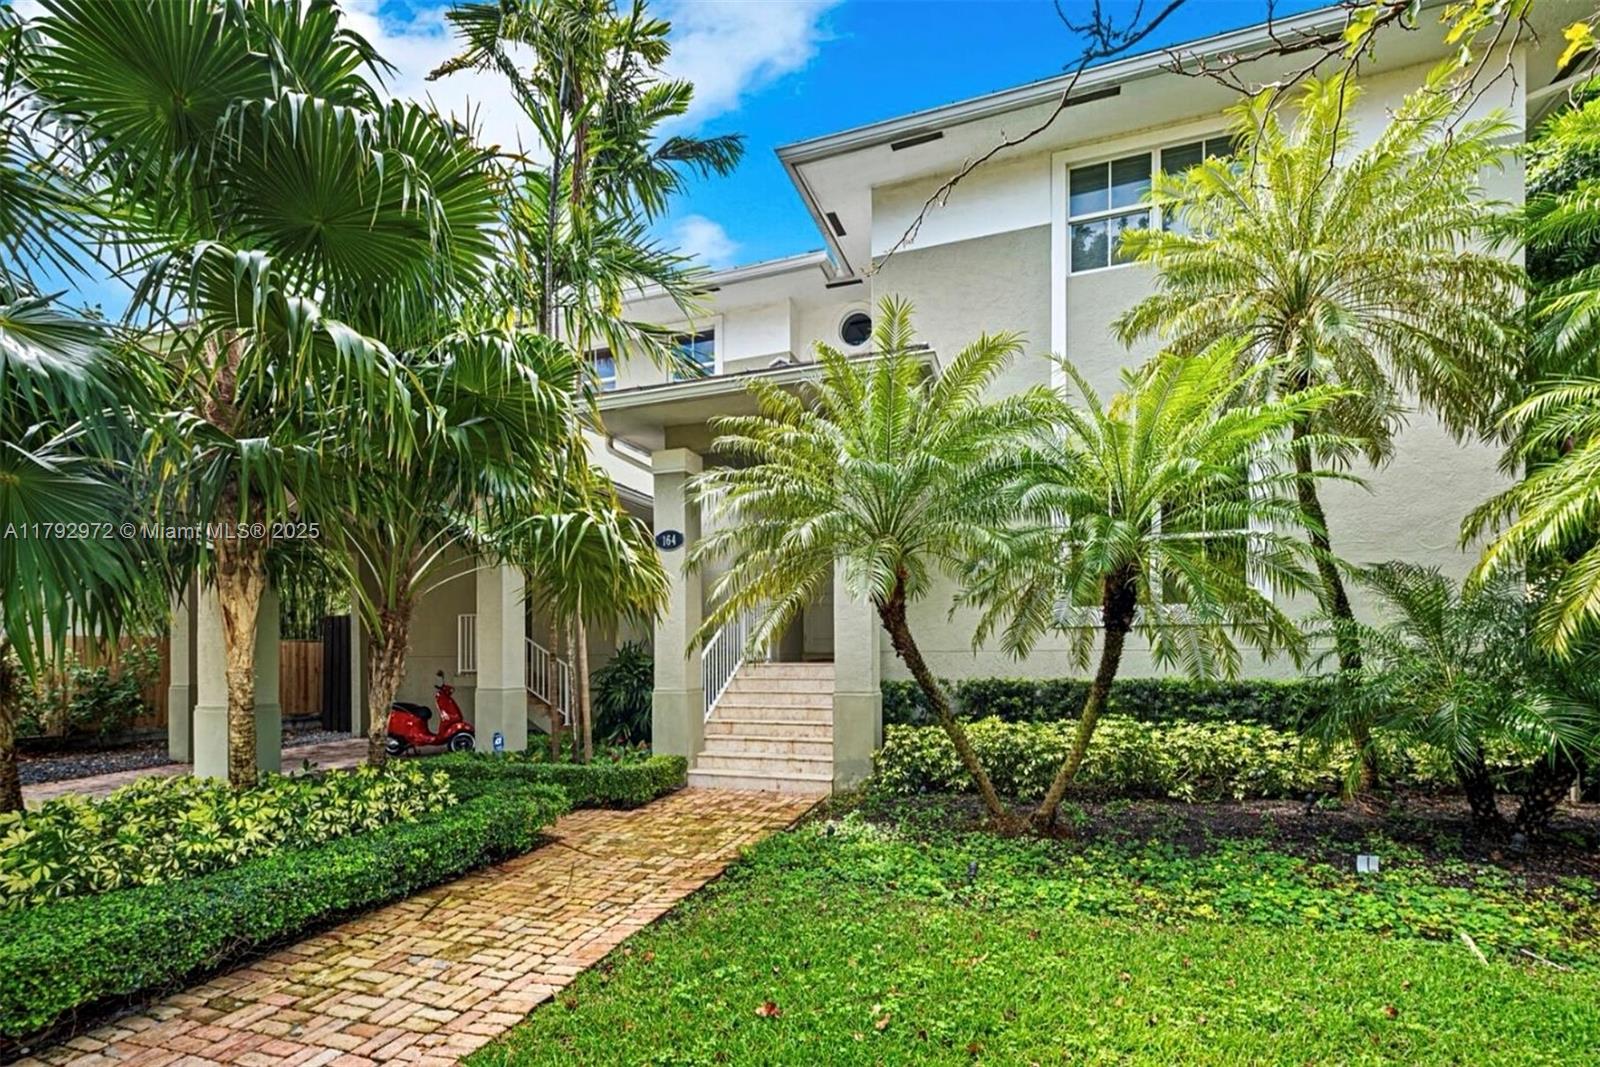
164 W Mashta Dr, Key Biscayne, FL 33149
$-24,896
Cash flow
-23.6%
Cash-on-Cash Return
0.7%
Cap rate
0.2%
Rent to Value Ratio

Active
$1,295,000
2
bds
|
2
ba
|
1,532
sqft
|
built
1980
151 Crandon Blvd, Key Biscayne, FL 33149
$-5,447
Cash flow
-21.9%
Cash-on-Cash Return
1.1%
Cap rate
0.5%
Rent to Value Ratio
Active
$1,850,000
3
bds
|
3
ba
|
1,550
sqft
|
built
2024
204 Sunrise Dr, Key Biscayne, FL 33149
$-4,843
Cash flow
-13.7%
Cash-on-Cash Return
3.0%
Cap rate
0.5%
Rent to Value Ratio
Active
$1,825,000
2
bds
|
3
ba
|
1,800
sqft
|
built
1970
288 Sea View Dr, Key Biscayne, FL 33149
$-7,823
Cash flow
-22.4%
Cash-on-Cash Return
1.0%
Cap rate
0.4%
Rent to Value Ratio

Active
$2,985,000
4
bds
|
3
ba
|
1,817
sqft
|
built
1951
310 Woodcrest Rd, Key Biscayne, FL 33149
$-9,596
Cash flow
-16.8%
Cash-on-Cash Return
2.3%
Cap rate
0.3%
Rent to Value Ratio

Active
$2,150,000
3
bds
|
3
ba
|
1,830
sqft
|
built
1998
701 Crandon Blvd, Key Biscayne, FL 33149
$-7,978
Cash flow
-19.4%
Cash-on-Cash Return
1.7%
Cap rate
0.5%
Rent to Value Ratio
Active
$499,000
1
bds
|
1
ba
|
690
sqft
|
built
1969
200 Galen Dr, Key Biscayne, FL 33149
$-997
Cash flow
-10.4%
Cash-on-Cash Return
3.7%
Cap rate
0.7%
Rent to Value Ratio
Active
$749,000
3
bds
|
2
ba
|
1,100
sqft
|
built
1967
240 Galen Dr, Key Biscayne, FL 33149
$-2,733
Cash flow
-19.0%
Cash-on-Cash Return
1.8%
Cap rate
0.5%
Rent to Value Ratio

Active
$1,100,000
3
bds
|
2
ba
|
1,273
sqft
|
built
1964
290 Sunrise Dr, Key Biscayne, FL 33149
$-4,231
Cash flow
-20.1%
Cash-on-Cash Return
1.5%
Cap rate
0.4%
Rent to Value Ratio

Active
$4,995,000
6
bds
|
7
ba
|
3,646
sqft
|
built
2013
689 Glenridge Rd, Key Biscayne, FL 33149
$-21,850
Cash flow
-22.8%
Cash-on-Cash Return
0.9%
Cap rate
0.2%
Rent to Value Ratio
Active
$1,765,000
2
bds
|
2
ba
|
1,782
sqft
|
built
1971
1121 Crandon Blvd, Key Biscayne, FL 33149
$-7,396
Cash flow
-21.9%
Cash-on-Cash Return
1.1%
Cap rate
0.4%
Rent to Value Ratio
Active
$6,345,000
6
bds
|
6
ba
|
3,854
sqft
|
built
2020
310 Redwood Ln, Key Biscayne, FL 33149
$-29,531
Cash flow
-24.3%
Cash-on-Cash Return
0.6%
Cap rate
0.2%
Rent to Value Ratio
Active
$4,500,000
3
bds
|
3
ba
|
2,927
sqft
|
built
1964
141 Island Dr, Key Biscayne, FL 33149
$-18,036
Cash flow
-20.9%
Cash-on-Cash Return
1.3%
Cap rate
0.2%
Rent to Value Ratio
Active
$2,870,000
3
bds
|
3
ba
|
2,667
sqft
|
built
2002
727 Crandon Blvd, Key Biscayne, FL 33149
$-10,640
Cash flow
-19.3%
Cash-on-Cash Return
1.7%
Cap rate
0.4%
Rent to Value Ratio
Active
$10,500,000
5
bds
|
6
ba
|
4,810
sqft
|
built
1996
445 Grand Bay Dr, Key Biscayne, FL 33149
$-63,196
Cash flow
-31.4%
Cash-on-Cash Return
-1.1%
Cap rate
0.1%
Rent to Value Ratio
Active
$799,500
2
bds
|
2
ba
|
1,242
sqft
|
built
1973
100 Ocean Lane Dr, Key Biscayne, FL 33149
$-1,907
Cash flow
-12.4%
Cash-on-Cash Return
3.3%
Cap rate
0.6%
Rent to Value Ratio

Active
$1,450,000
3
bds
|
2
ba
|
1,541
sqft
|
built
1978
201 Crandon Blvd, Key Biscayne, FL 33149
$-4,465
Cash flow
-16.1%
Cash-on-Cash Return
2.5%
Cap rate
0.5%
Rent to Value Ratio

Active
$3,650,000
4
bds
|
3
ba
|
2,177
sqft
|
built
1953
255 Ridgewood Rd, Key Biscayne, FL 33149
$-13,096
Cash flow
-18.7%
Cash-on-Cash Return
1.8%
Cap rate
0.3%
Rent to Value Ratio
Active
$5,390,000
7
bds
|
6
ba
|
3,888
sqft
|
built
1951
635 Curtiswood Dr, Key Biscayne, FL 33149
$-23,129
Cash flow
-22.4%
Cash-on-Cash Return
1.0%
Cap rate
0.2%
Rent to Value Ratio
Active
$899,000
2
bds
|
2
ba
|
1,260
sqft
|
built
1973
155 Ocean Lane Dr, Key Biscayne, FL 33149
$-2,902
Cash flow
-16.8%
Cash-on-Cash Return
2.3%
Cap rate
0.7%
Rent to Value Ratio
Active
$890,000
2
bds
|
2
ba
|
1,311
sqft
|
built
1975
575 Crandon Blvd, Key Biscayne, FL 33149
$-2,438
Cash flow
-14.3%
Cash-on-Cash Return
2.9%
Cap rate
0.6%
Rent to Value Ratio
Active
$1,600,000
2
bds
|
2
ba
|
1,670
sqft
|
built
1974
600 Grapetree Dr, Key Biscayne, FL 33149
$-6,322
Cash flow
-20.6%
Cash-on-Cash Return
1.4%
Cap rate
0.4%
Rent to Value Ratio