Key Biscayne, FL Investment Properties for Sale
Browse homes for sale and investment properties in Key Biscayne, FL. Refine your search by price, property type, or more.
Best cash flowing properties in Key Biscayne, FL

Active
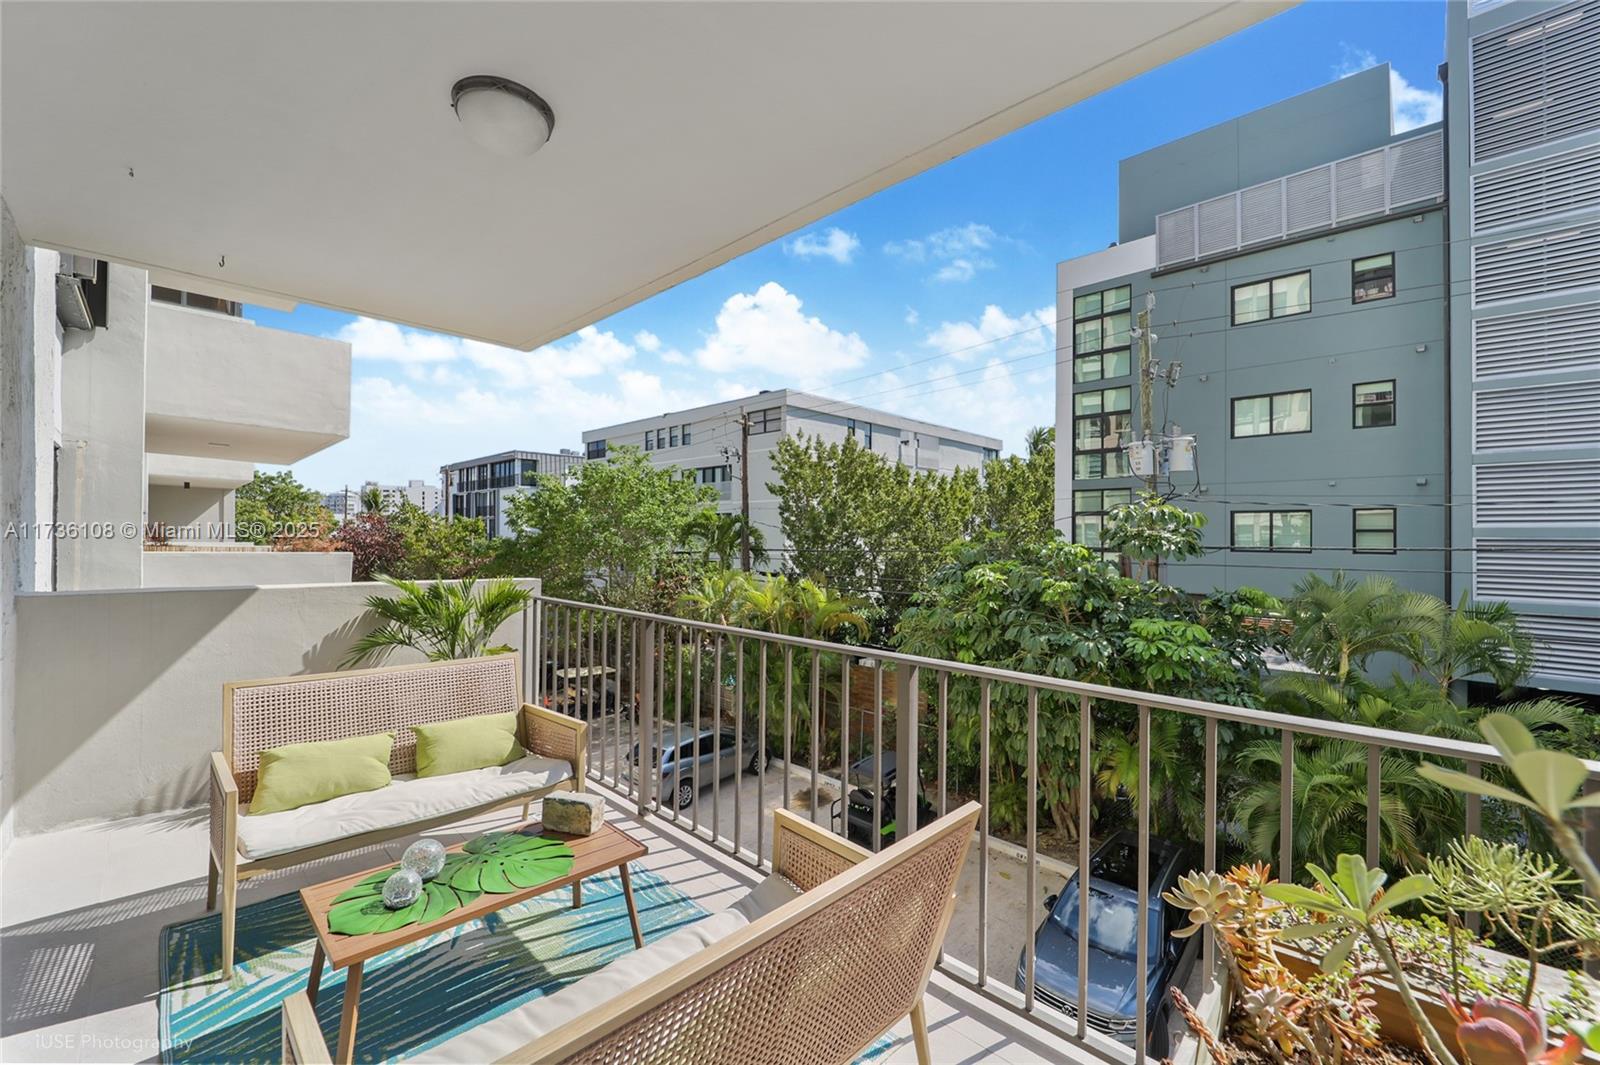
$579,000
1
bds
|
2
ba
|
972
sqft
|
built
1982
55 Ocean Lane Dr, Key Biscayne, FL 33149
$-826
Cash flow
-7.4%
Cash-on-Cash Return
4.6%
Cap rate
0.7%
Rent to Value Ratio
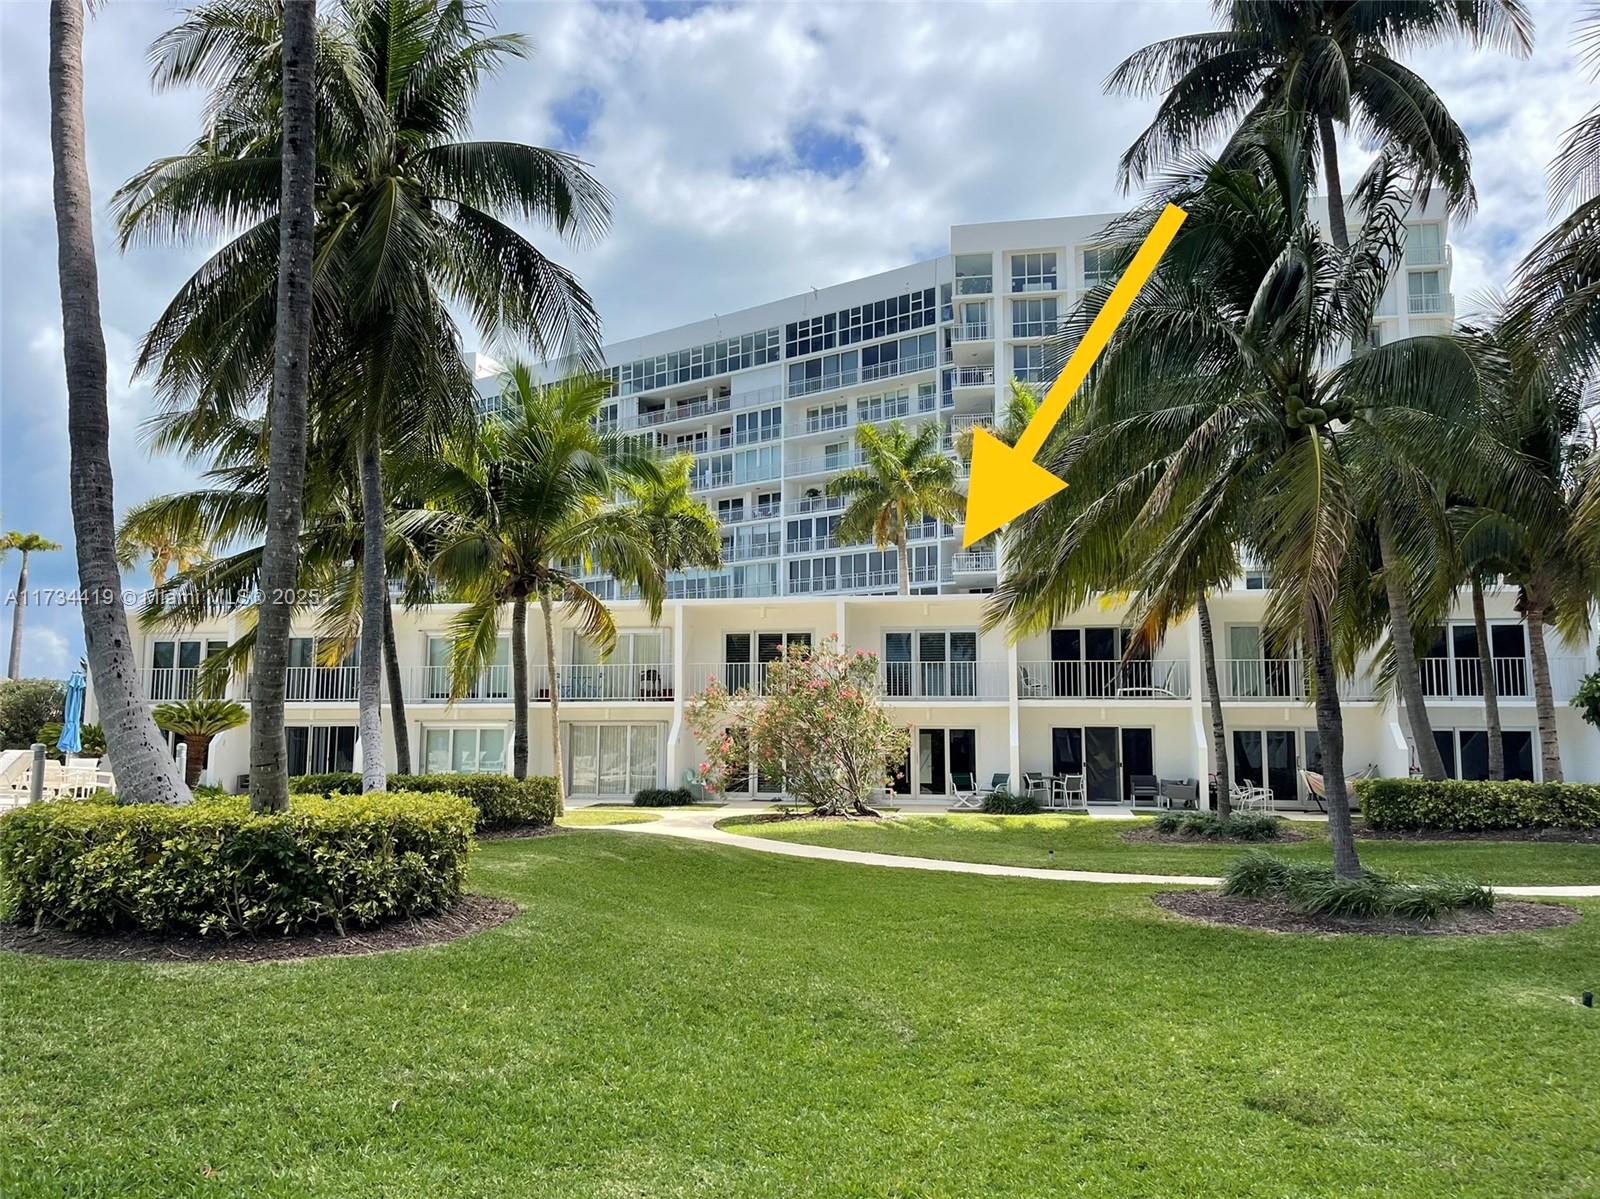
Active
$545,000
2
bds
|
2
ba
|
1,109
sqft
|
built
1968
201 Galen Dr, Key Biscayne, FL 33149
$-1,565
Cash flow
-15.0%
Cash-on-Cash Return
2.8%
Cap rate
0.6%
Rent to Value Ratio
156 out of 163 properties for sale in Key Biscayne, FL
Limited Results Shown
Create a free account, or log in to reveal all property listings and enjoy the complete experience.
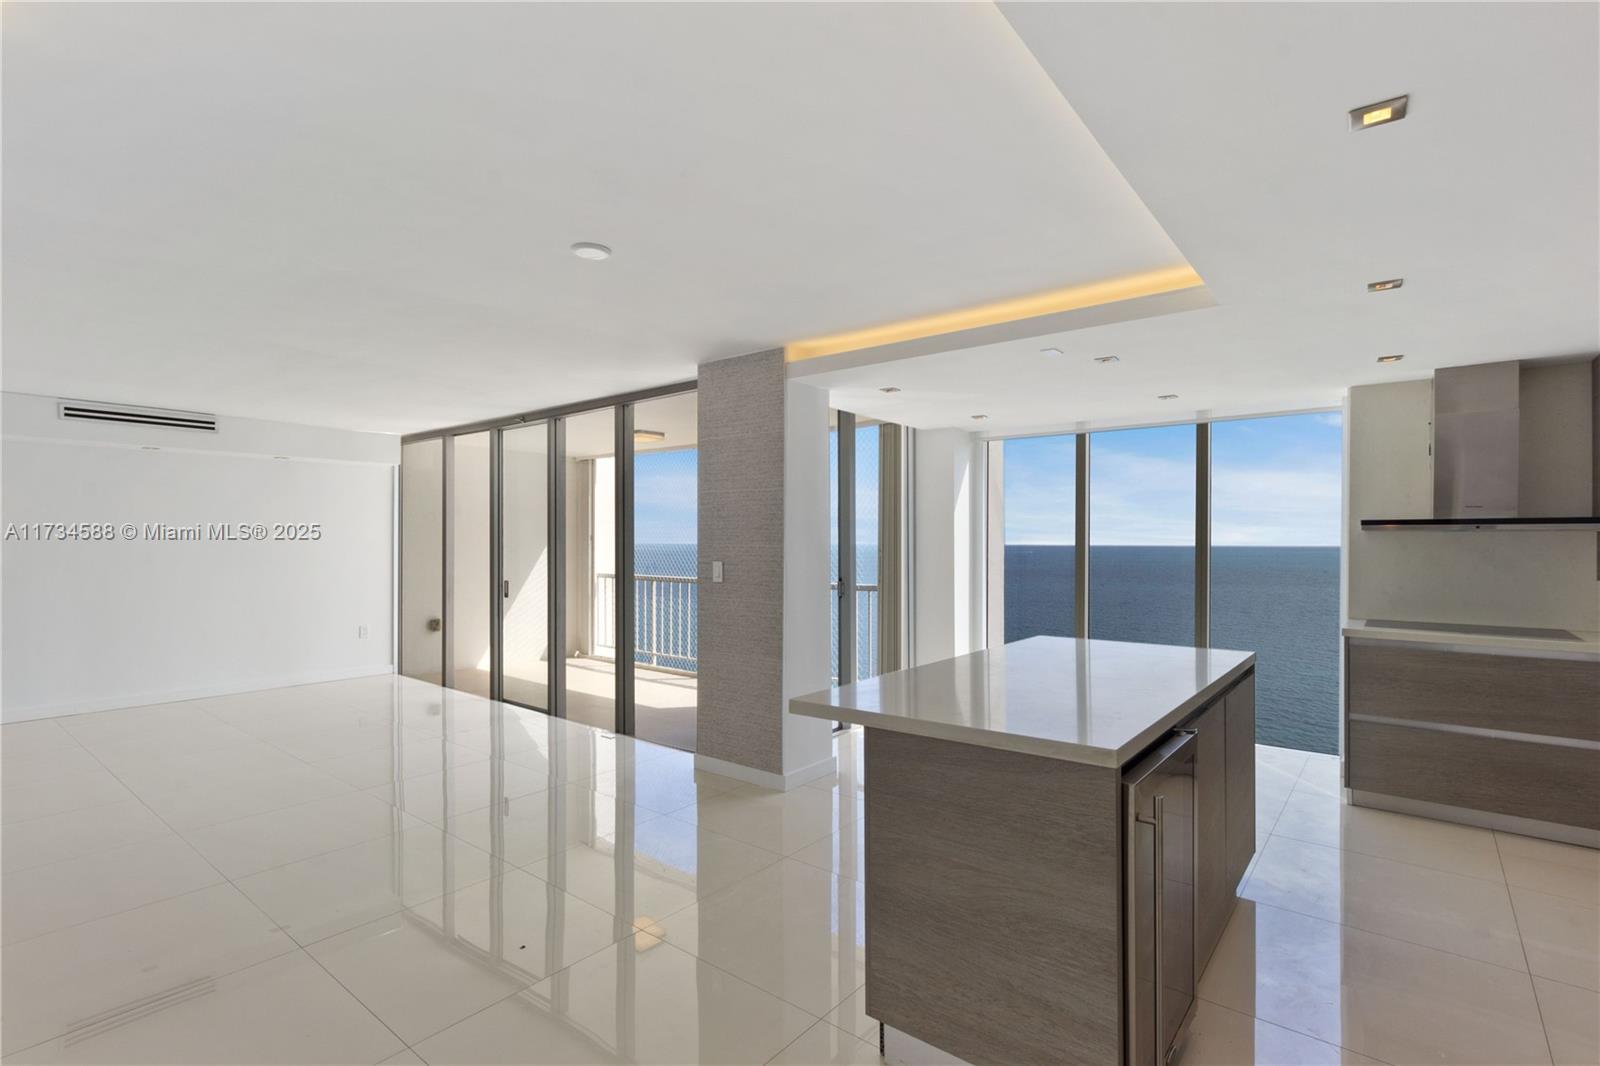
Active
$4,699,000
5
bds
|
7
ba
|
4,007
sqft
|
built
1998
6 Coconut Ln, Key Biscayne, FL 33149
$-21,935
Cash flow
-24.4%
Cash-on-Cash Return
0.7%
Cap rate
0.2%
Rent to Value Ratio
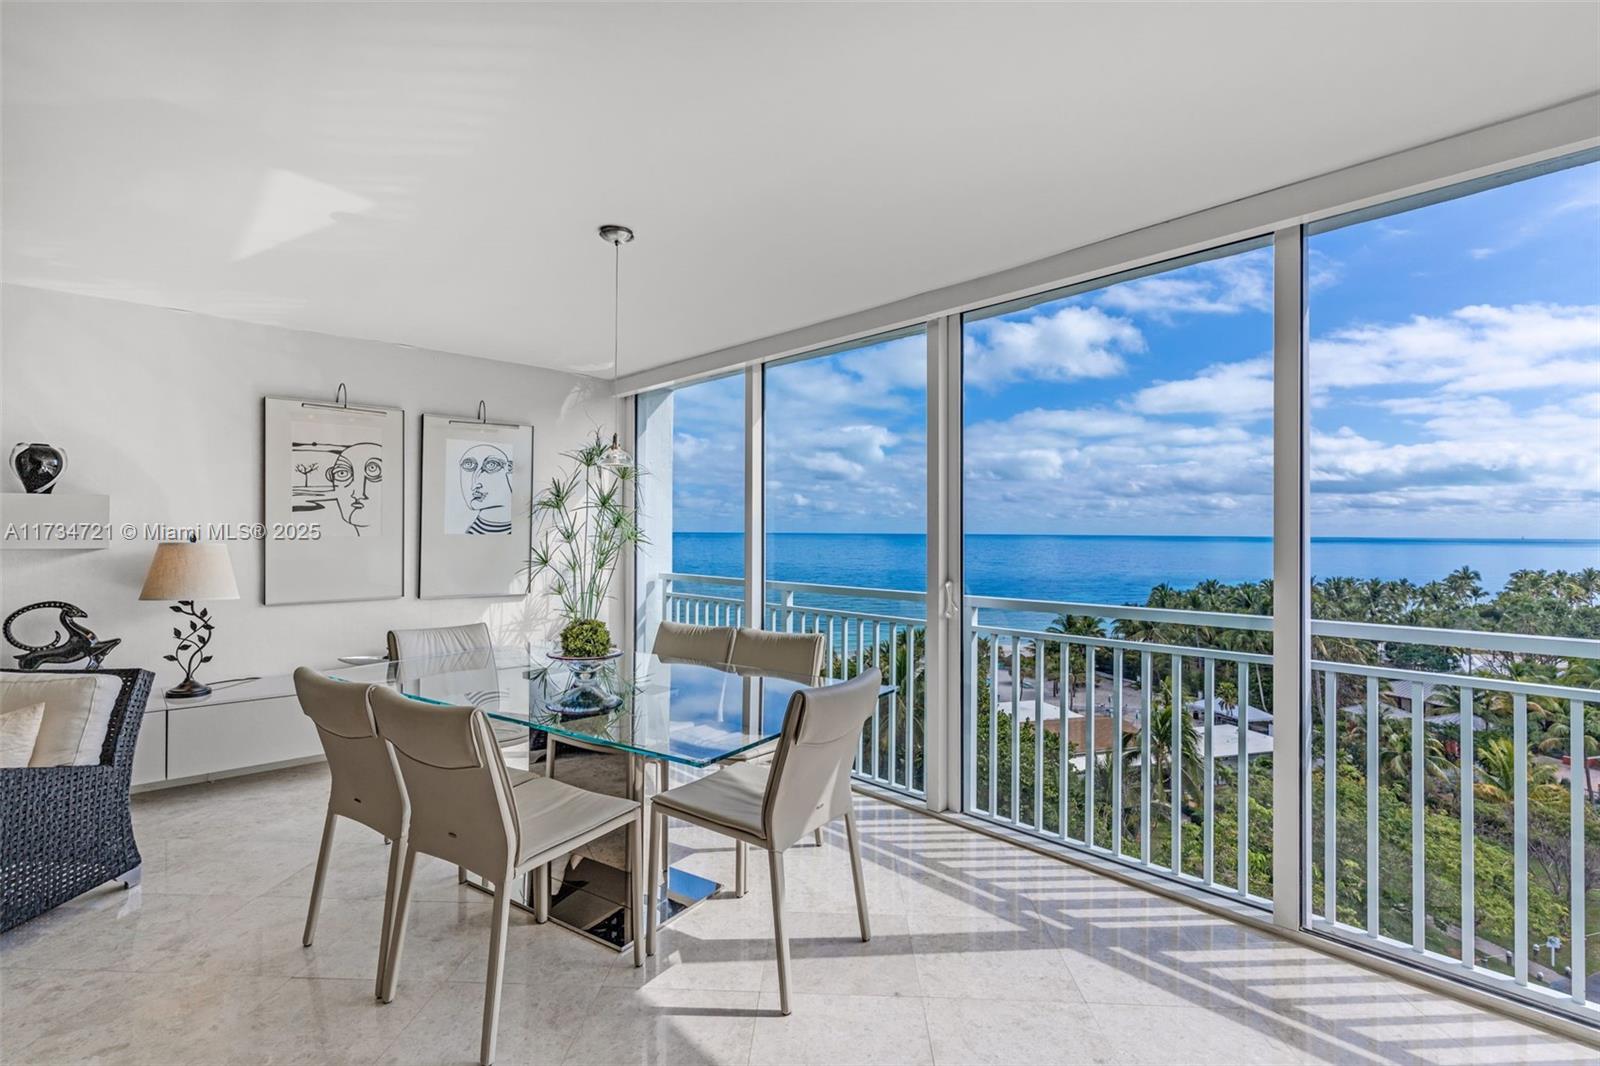
Active
$620,000
1
bds
|
2
ba
|
972
sqft
|
built
1982
101 Ocean Lane Dr, Key Biscayne, FL 33149
$-2,397
Cash flow
-20.2%
Cash-on-Cash Return
1.6%
Cap rate
0.6%
Rent to Value Ratio
Active
$1,585,000
2
bds
|
2
ba
|
1,532
sqft
|
built
1979
251 Crandon Blvd, Key Biscayne, FL 33149
$-5,797
Cash flow
-19.1%
Cash-on-Cash Return
1.9%
Cap rate
0.5%
Rent to Value Ratio
Active
$6,500,000
6
bds
|
7
ba
|
3,670
sqft
|
built
2022
285 W Mashta Dr, Key Biscayne, FL 33149
$-31,860
Cash flow
-25.6%
Cash-on-Cash Return
0.4%
Cap rate
0.2%
Rent to Value Ratio

Active
$2,400,000
3
bds
|
2
ba
|
2,159
sqft
|
built
1952
725 Fernwood Rd, Key Biscayne, FL 33149
$-9,370
Cash flow
-20.4%
Cash-on-Cash Return
1.6%
Cap rate
0.3%
Rent to Value Ratio
Active
$579,000
1
bds
|
2
ba
|
972
sqft
|
built
1982
55 Ocean Lane Dr, Key Biscayne, FL 33149
$-826
Cash flow
-7.4%
Cash-on-Cash Return
4.6%
Cap rate
0.7%
Rent to Value Ratio
Active
$3,895,000
4
bds
|
4
ba
|
3,403
sqft
|
built
1951
691 Ridgewood Rd, Key Biscayne, FL 33149
$-14,256
Cash flow
-19.1%
Cash-on-Cash Return
1.9%
Cap rate
0.2%
Rent to Value Ratio

Active
$71,000,000
1
bds
|
2
ba
|
4,679
sqft
|
built
1996
280 Harbor Dr, Key Biscayne, FL 33149
$-370,657
Cash flow
-27.2%
Cash-on-Cash Return
0.0%
Cap rate
0.0%
Rent to Value Ratio
Active
$3,199,000
3
bds
|
5
ba
|
3,112
sqft
|
built
2002
765 Crandon Blvd, Key Biscayne, FL 33149
$-13,556
Cash flow
-22.1%
Cash-on-Cash Return
1.2%
Cap rate
0.3%
Rent to Value Ratio
Active
$1,200,000
3
bds
|
2
ba
|
1,734
sqft
|
built
1982
101 Ocean Lane Dr, Key Biscayne, FL 33149
$-3,318
Cash flow
-14.4%
Cash-on-Cash Return
3.0%
Cap rate
0.7%
Rent to Value Ratio
Active
$23,500,000
4
bds
|
5
ba
|
2,255
sqft
|
built
1958
631 N Mashta Dr, Key Biscayne, FL 33149
$-125,250
Cash flow
-27.8%
Cash-on-Cash Return
-0.1%
Cap rate
0.0%
Rent to Value Ratio
Active
$1,375,000
2
bds
|
2
ba
|
1,409
sqft
|
built
1971
1121 Crandon Blvd, Key Biscayne, FL 33149
$-4,382
Cash flow
-16.6%
Cash-on-Cash Return
2.5%
Cap rate
0.6%
Rent to Value Ratio
Active
$3,625,000
4
bds
|
3
ba
|
2,063
sqft
|
built
1956
385 Harbor Ct, Key Biscayne, FL 33149
$-11,048
Cash flow
-15.9%
Cash-on-Cash Return
2.6%
Cap rate
0.3%
Rent to Value Ratio
Active
$3,170,000
3
bds
|
4
ba
|
3,091
sqft
|
built
2002
765 Crandon Blvd, Key Biscayne, FL 33149
$-15,524
Cash flow
-25.6%
Cash-on-Cash Return
0.4%
Cap rate
0.3%
Rent to Value Ratio
Active
$780,000
2
bds
|
2
ba
|
1,311
sqft
|
built
1975
575 Crandon Blvd, Key Biscayne, FL 33149
$-1,608
Cash flow
-10.8%
Cash-on-Cash Return
3.8%
Cap rate
0.7%
Rent to Value Ratio

Active
$5,975,000
4
bds
|
6
ba
|
3,950
sqft
|
built
1999
430 Grand Bay Dr, Key Biscayne, FL 33149
$-29,346
Cash flow
-25.6%
Cash-on-Cash Return
0.4%
Cap rate
0.1%
Rent to Value Ratio
Active
$1,100,000
2
bds
|
2
ba
|
1,042
sqft
|
built
1971
881 Ocean Dr, Key Biscayne, FL 33149
$-4,003
Cash flow
-19.0%
Cash-on-Cash Return
1.9%
Cap rate
0.5%
Rent to Value Ratio
Active
$2,250,000
2
bds
|
2
ba
|
1,875
sqft
|
built
1971
881 Ocean Dr, Key Biscayne, FL 33149
$-8,916
Cash flow
-20.7%
Cash-on-Cash Return
1.5%
Cap rate
0.4%
Rent to Value Ratio
Active
$1,890,000
2
bds
|
2
ba
|
1,611
sqft
|
built
1969
607 Ocean Dr, Key Biscayne, FL 33149
$-7,504
Cash flow
-20.7%
Cash-on-Cash Return
1.5%
Cap rate
0.5%
Rent to Value Ratio
Active
$1,125,000
2
bds
|
2
ba
|
1,409
sqft
|
built
1971
1121 Crandon Blvd, Key Biscayne, FL 33149
$-2,856
Cash flow
-13.2%
Cash-on-Cash Return
3.2%
Cap rate
0.6%
Rent to Value Ratio
Active
$3,950,000
4
bds
|
6
ba
|
3,030
sqft
|
built
1999
781 Crandon Blvd, Key Biscayne, FL 33149
$-19,113
Cash flow
-25.2%
Cash-on-Cash Return
0.5%
Cap rate
0.3%
Rent to Value Ratio
Active
$2,699,000
3
bds
|
4
ba
|
2,477
sqft
|
built
2002
765 Crandon Blvd, Key Biscayne, FL 33149
$-14,184
Cash flow
-27.4%
Cash-on-Cash Return
0.0%
Cap rate
0.4%
Rent to Value Ratio

Pending
$749,000
1
bds
|
2
ba
|
1,114
sqft
|
built
1972
1111 Crandon Blvd, Key Biscayne, FL 33149
$-2,741
Cash flow
-19.1%
Cash-on-Cash Return
1.9%
Cap rate
0.6%
Rent to Value Ratio
Active
$1,999,990
3
bds
|
3
ba
|
2,001
sqft
|
built
1980
151 Crandon Blvd, Key Biscayne, FL 33149
$-7,647
Cash flow
-19.9%
Cash-on-Cash Return
1.7%
Cap rate
0.5%
Rent to Value Ratio
Active
$1,150,000
2
bds
|
2
ba
|
1,488
sqft
|
built
1980
151 Crandon Blvd, Key Biscayne, FL 33149
$-4,574
Cash flow
-20.8%
Cash-on-Cash Return
1.5%
Cap rate
0.5%
Rent to Value Ratio

Pending
$1,125,000
2
bds
|
2
ba
|
1,435
sqft
|
built
1981
170 Ocean Lane Dr, Key Biscayne, FL 33149
$-3,006
Cash flow
-13.9%
Cash-on-Cash Return
3.1%
Cap rate
0.6%
Rent to Value Ratio
Pending
$3,900,000
3
bds
|
4
ba
|
3,382
sqft
|
built
1960
669 S Mashta Dr, Key Biscayne, FL 33149
$-16,218
Cash flow
-21.7%
Cash-on-Cash Return
1.3%
Cap rate
0.2%
Rent to Value Ratio
Active
$545,000
2
bds
|
2
ba
|
1,109
sqft
|
built
1968
201 Galen Dr, Key Biscayne, FL 33149
$-1,565
Cash flow
-15.0%
Cash-on-Cash Return
2.8%
Cap rate
0.6%
Rent to Value Ratio

Active
$2,989,999
3
bds
|
3
ba
|
2,602
sqft
|
built
2002
765 Crandon Blvd, Key Biscayne, FL 33149
$-13,874
Cash flow
-24.2%
Cash-on-Cash Return
0.7%
Cap rate
0.3%
Rent to Value Ratio
Active
$1,425,000
3
bds
|
2
ba
|
1,584
sqft
|
built
1980
151 Crandon Blvd, Key Biscayne, FL 33149
$-5,016
Cash flow
-18.4%
Cash-on-Cash Return
2.1%
Cap rate
0.6%
Rent to Value Ratio
Active
$1,685,000
2
bds
|
2
ba
|
1,450
sqft
|
built
1998
703 Crandon Blvd, Key Biscayne, FL 33149
$-5,742
Cash flow
-17.8%
Cash-on-Cash Return
2.2%
Cap rate
0.5%
Rent to Value Ratio

Active
$2,500,000
4
bds
|
4
ba
|
1,750
sqft
|
built
2024
202 Sunrise Dr, Key Biscayne, FL 33149
$-7,151
Cash flow
-14.9%
Cash-on-Cash Return
2.9%
Cap rate
0.4%
Rent to Value Ratio

Active
$3,150,000
2
bds
|
3
ba
|
1,542
sqft
|
built
2014
350 Ocean Dr, Key Biscayne, FL 33149
$-15,748
Cash flow
-26.1%
Cash-on-Cash Return
0.3%
Cap rate
0.3%
Rent to Value Ratio

Active
$1,135,000
2
bds
|
2
ba
|
1,260
sqft
|
built
1971
177 Ocean Lane Dr, Key Biscayne, FL 33149
$-4,732
Cash flow
-21.8%
Cash-on-Cash Return
1.3%
Cap rate
0.5%
Rent to Value Ratio
Active
$1,150,000
2
bds
|
2
ba
|
1,409
sqft
|
built
1971
1121 Crandon Blvd, Key Biscayne, FL 33149
$-3,237
Cash flow
-14.7%
Cash-on-Cash Return
2.9%
Cap rate
0.6%
Rent to Value Ratio

Active
$1,550,000
2
bds
|
2
ba
|
1,409
sqft
|
built
1972
1111 Crandon Blvd, Key Biscayne, FL 33149
$-5,578
Cash flow
-18.8%
Cash-on-Cash Return
2.0%
Cap rate
0.5%
Rent to Value Ratio
Active
$695,000
1
bds
|
2
ba
|
895
sqft
|
built
1973
155 Ocean Lane Dr, Key Biscayne, FL 33149
$-1,994
Cash flow
-15.0%
Cash-on-Cash Return
2.8%
Cap rate
0.6%
Rent to Value Ratio

Active
$1,845,000
2
bds
|
2
ba
|
1,782
sqft
|
built
1971
1121 Crandon Blvd, Key Biscayne, FL 33149
$-7,930
Cash flow
-22.4%
Cash-on-Cash Return
1.1%
Cap rate
0.4%
Rent to Value Ratio
Active
$1,150,000
2
bds
|
2
ba
|
1,260
sqft
|
built
1973
155 Ocean Lane Dr, Key Biscayne, FL 33149
$-4,154
Cash flow
-18.8%
Cash-on-Cash Return
1.9%
Cap rate
0.6%
Rent to Value Ratio

Active
$835,000
2
bds
|
2
ba
|
1,330
sqft
|
built
1972
210 Sea View Dr, Key Biscayne, FL 33149
$-2,784
Cash flow
-17.4%
Cash-on-Cash Return
2.3%
Cap rate
0.5%
Rent to Value Ratio