Killeen, TX Investment Properties for Sale
Browse homes for sale and investment properties in Killeen, TX. Refine your search by price, property type, or more.
Best cash flowing properties in Killeen, TX
Active
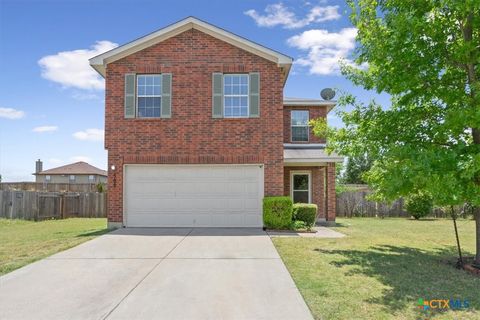
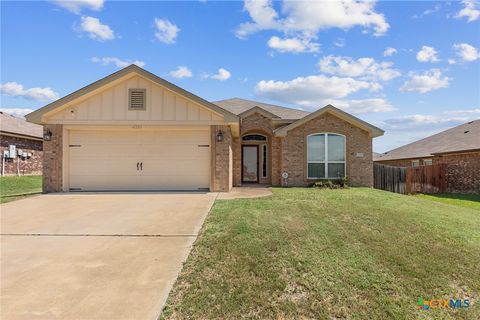
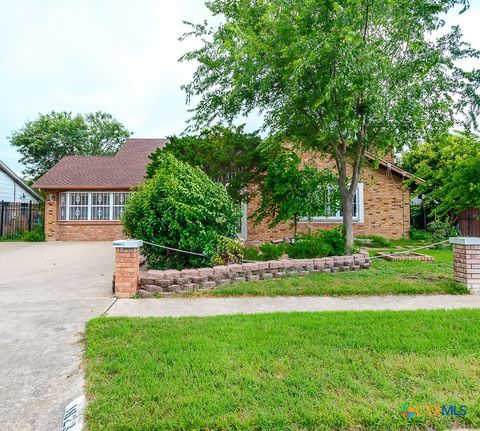
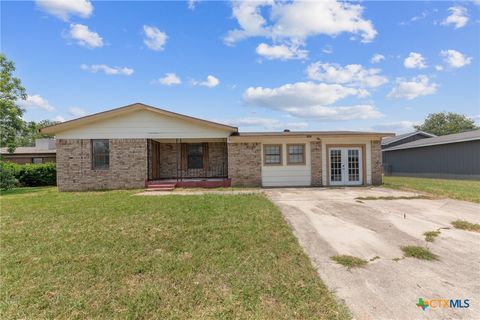
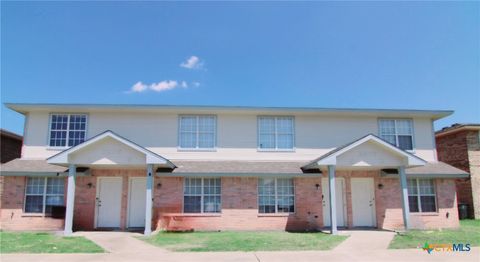
$175,000
3
bds
|
3
ba
|
1,682
sqft
|
built
2008
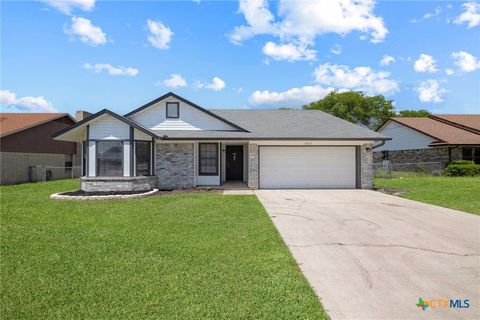
508 Perseus, Killeen, TX 76542
$-42
Cash flow
-1.3%
Cash-on-Cash Return
6.0%
Cap rate
1.0%
Rent to Value Ratio
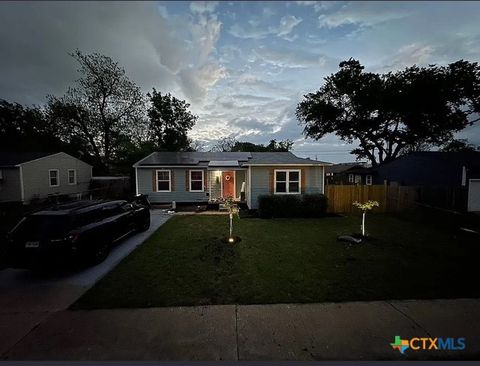
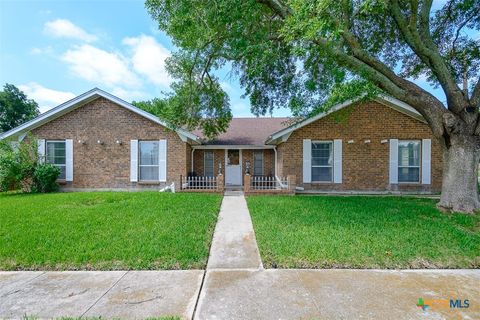
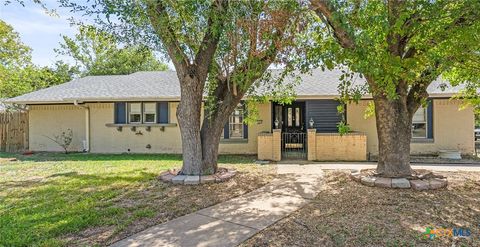
Active
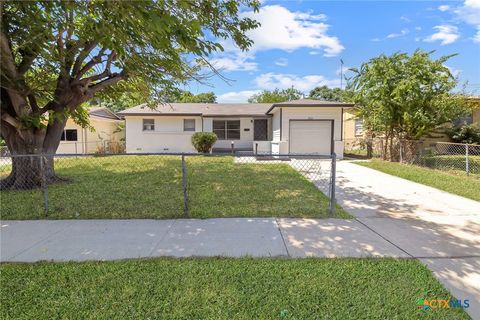
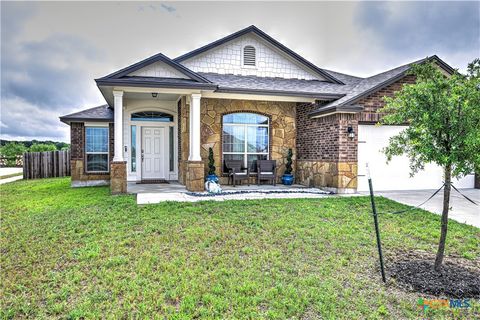
$175,000
4
bds
|
1
ba
|
1,255
sqft
|
built
1964
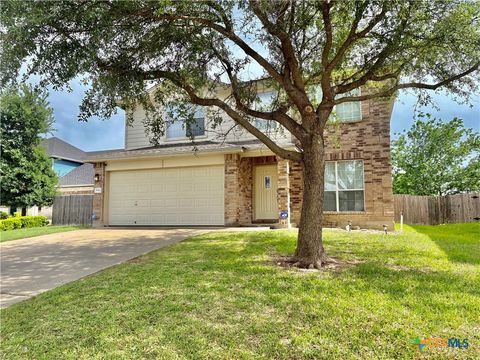
3102 Taft St, Killeen, TX 76543
$-186
Cash flow
-5.5%
Cash-on-Cash Return
5.0%
Cap rate
0.7%
Rent to Value Ratio
622 out of 771 properties for sale in Killeen, TX
Limited Results Shown
Create a free account, or log in to reveal all property listings and enjoy the complete experience.
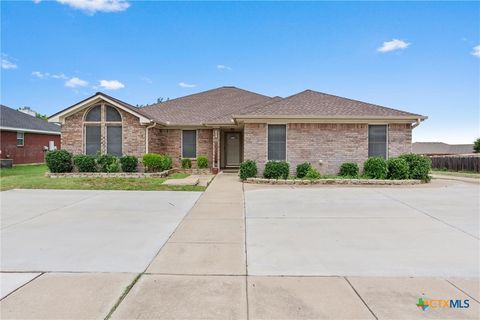
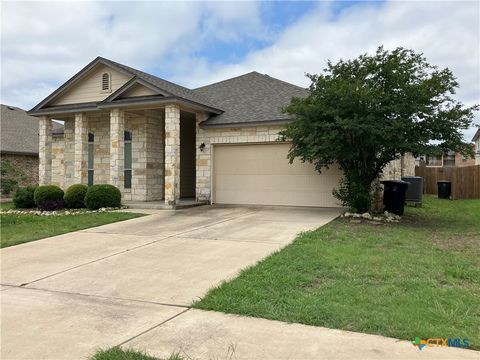
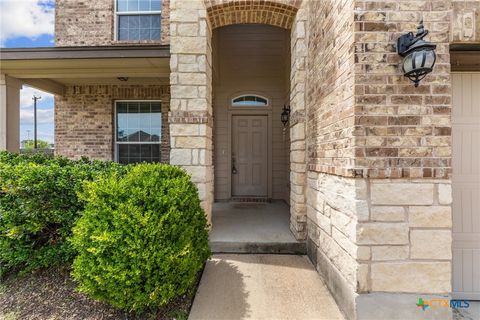
Active
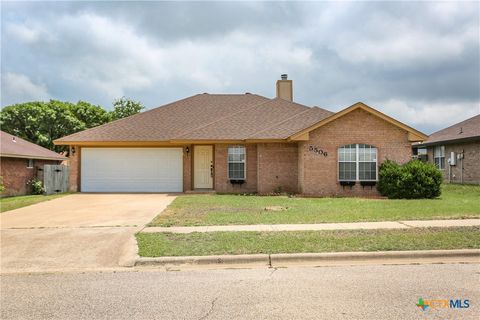
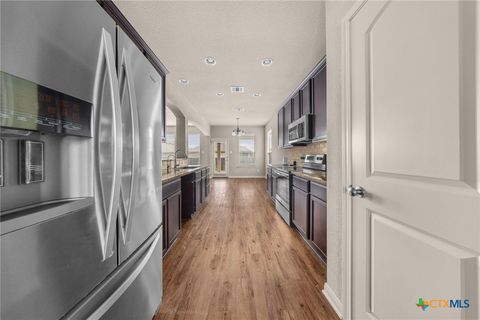
$229,900
4
bds
|
2
ba
|
1,551
sqft
|
built
2000
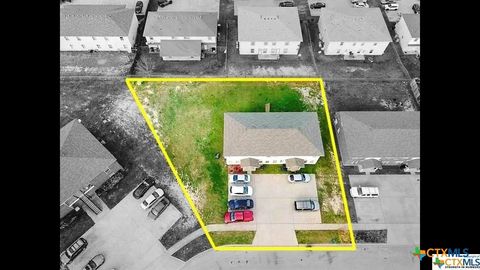
5506 Golden Dr, Killeen, TX 76542
$-454
Cash flow
-10.3%
Cash-on-Cash Return
3.9%
Cap rate
0.7%
Rent to Value Ratio
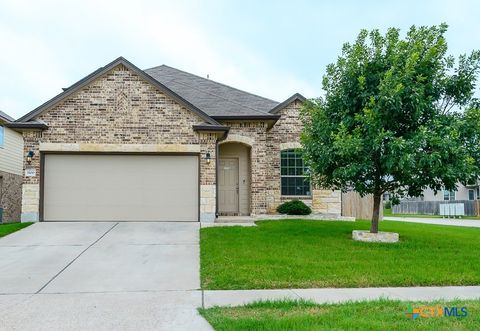
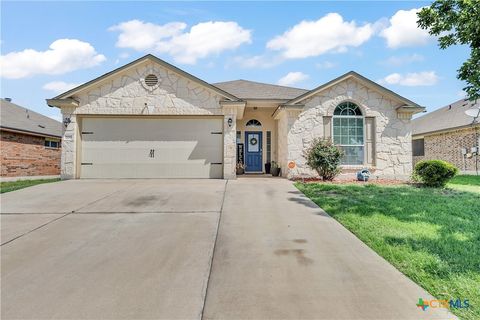
Active
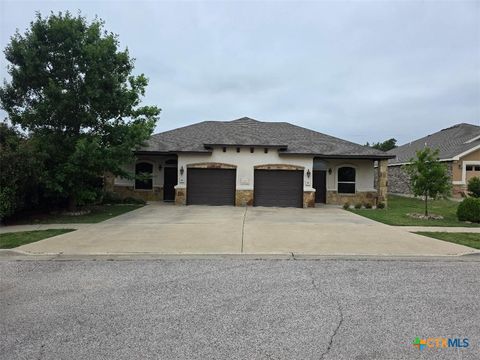
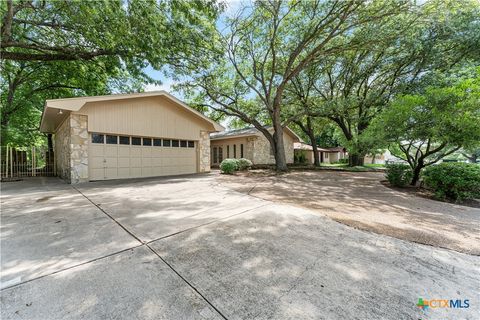
$410,000
bds
|
0
ba
|
2,680
sqft
|
built
2015
409 Study Hall Loop, Killeen, TX 76549
$-1,382
Cash flow
-17.6%
Cash-on-Cash Return
2.2%
Cap rate
0.3%
Rent to Value Ratio
Active
$409,900
5
bds
|
3
ba
|
3,227
sqft
|
built
2020
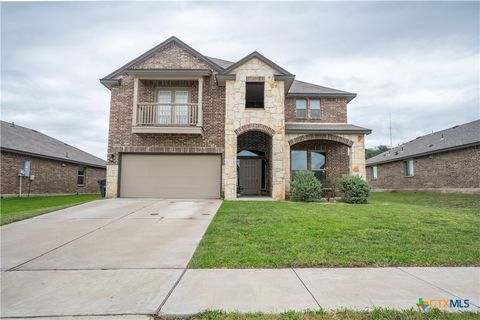
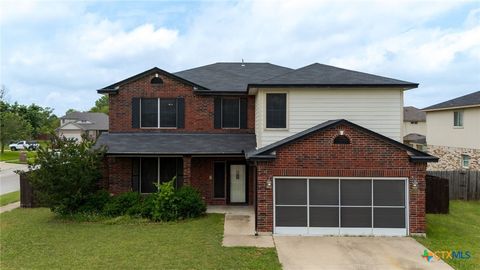
311 Danielle Dr, Killeen, TX 76542
$-1,257
Cash flow
-16.0%
Cash-on-Cash Return
2.6%
Cap rate
0.5%
Rent to Value Ratio
Active
$274,900
5
bds
|
3
ba
|
2,027
sqft
|
built
2017
6711 Catherine Dr, Killeen, TX 76542
$-513
Cash flow
-9.7%
Cash-on-Cash Return
4.0%
Cap rate
0.7%
Rent to Value Ratio
Active
$245,000
4
bds
|
2
ba
|
1,979
sqft
|
built
2003
5300 Two Step Pl, Killeen, TX 76542
$-433
Cash flow
-9.2%
Cash-on-Cash Return
4.1%
Cap rate
0.7%
Rent to Value Ratio
Active
$265,000
3
bds
|
2
ba
|
1,914
sqft
|
built
2011
3300 Cricklewood Dr, Killeen, TX 76542
$-576
Cash flow
-11.3%
Cash-on-Cash Return
3.7%
Cap rate
0.7%
Rent to Value Ratio
Active
$245,000
3
bds
|
2
ba
|
1,575
sqft
|
built
2017
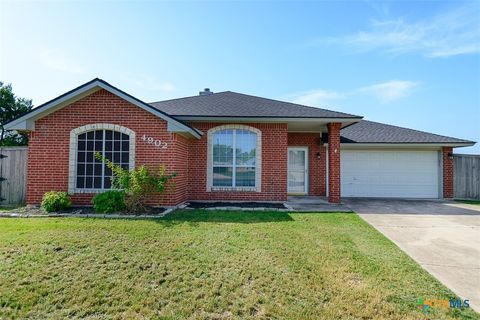
4201 Colonel Dr, Killeen, TX 76549
$-578
Cash flow
-12.3%
Cash-on-Cash Return
3.4%
Cap rate
0.7%
Rent to Value Ratio
Active
$310,000
4
bds
|
2
ba
|
2,024
sqft
|
built
2020
9300 Vaquero Way, Killeen, TX 76542
$-804
Cash flow
-13.5%
Cash-on-Cash Return
3.2%
Cap rate
0.6%
Rent to Value Ratio
Active
$330,000
4
bds
|
3
ba
|
2,516
sqft
|
built
2016
4703 Prewitt Ranch Rd, Killeen, TX 76549
$-864
Cash flow
-13.7%
Cash-on-Cash Return
3.1%
Cap rate
0.6%
Rent to Value Ratio
Active
$279,900
4
bds
|
3
ba
|
2,887
sqft
|
built
1966
906 Illinois Ave, Killeen, TX 76541
$-492
Cash flow
-9.2%
Cash-on-Cash Return
4.2%
Cap rate
0.7%
Rent to Value Ratio
Active
$230,000
3
bds
|
2
ba
|
1,926
sqft
|
built
1984
1823 Cedarview Dr, Killeen, TX 76543
$-358
Cash flow
-8.1%
Cash-on-Cash Return
4.4%
Cap rate
0.7%
Rent to Value Ratio
Active
$175,000
3
bds
|
2
ba
|
1,266
sqft
|
built
1962
508 Crockett Dr, Killeen, TX 76541
$-199
Cash flow
-5.9%
Cash-on-Cash Return
4.9%
Cap rate
0.8%
Rent to Value Ratio
Active
$264,700
4
bds
|
2
ba
|
2,129
sqft
|
built
2002
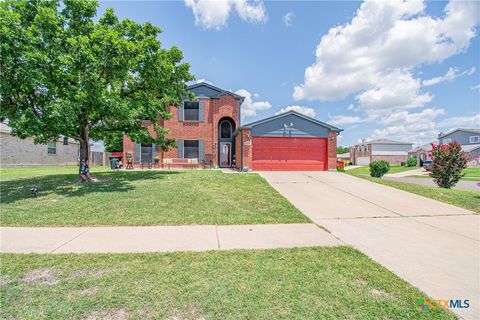
4401 Maggie Dr, Killeen, TX 76549
$-558
Cash flow
-11.0%
Cash-on-Cash Return
3.7%
Cap rate
0.7%
Rent to Value Ratio
Active
$305,000
4
bds
|
3
ba
|
2,444
sqft
|
built
2017
3500 Aubree Katherine Dr, Killeen, TX 76542
$-624
Cash flow
-10.7%
Cash-on-Cash Return
3.8%
Cap rate
0.7%
Rent to Value Ratio

Active
$147,500
3
bds
|
1
ba
|
1,000
sqft
|
built
1963
4802 Renick Ranch Rd, Killeen, TX 76549
$-204
Cash flow
-7.2%
Cash-on-Cash Return
4.6%
Cap rate
0.7%
Rent to Value Ratio
Active
$437,000
3
bds
|
3
ba
|
1,902
sqft
|
built
1982
735 Slawson Ln, Killeen, TX 76542
$-1,162
Cash flow
-13.9%
Cash-on-Cash Return
3.1%
Cap rate
0.5%
Rent to Value Ratio
Active
$189,900
4
bds
|
2
ba
|
1,446
sqft
|
built
2006
3204 Neel Ct, Killeen, TX 76543
$-356
Cash flow
-9.8%
Cash-on-Cash Return
4.0%
Cap rate
0.7%
Rent to Value Ratio
Active
$180,000
bds
|
0
ba
|
1,600
sqft
|
built
1968
1018 N 12th St, Killeen, TX 76541
$-719
Cash flow
-20.8%
Cash-on-Cash Return
1.5%
Cap rate
0.3%
Rent to Value Ratio
Active
$379,900
4
bds
|
3
ba
|
3,152
sqft
|
built
2007
4904 Sodalite Ct, Killeen, TX 76542
$-396
Cash flow
-5.4%
Cash-on-Cash Return
5.0%
Cap rate
0.6%
Rent to Value Ratio
Active
$210,000
3
bds
|
2
ba
|
1,980
sqft
|
built
1985
3105 Julie Ln, Killeen, TX 76549
$-225
Cash flow
-5.6%
Cash-on-Cash Return
5.0%
Cap rate
0.9%
Rent to Value Ratio
Active
$240,000
3
bds
|
2
ba
|
1,972
sqft
|
built
1974
602 Estes Dr, Killeen, TX 76541
$-466
Cash flow
-10.1%
Cash-on-Cash Return
3.9%
Cap rate
0.7%
Rent to Value Ratio
Active
$289,000
4
bds
|
3
ba
|
2,221
sqft
|
built
2013
6403 Creek Land Rd, Killeen, TX 76549
$-613
Cash flow
-11.1%
Cash-on-Cash Return
3.7%
Cap rate
0.7%
Rent to Value Ratio
Active
$275,000
4
bds
|
2
ba
|
1,820
sqft
|
built
2015
709 Rowdy Dr, Killeen, TX 76542
$-460
Cash flow
-8.7%
Cash-on-Cash Return
3.7%
Cap rate
0.7%
Rent to Value Ratio
Active
$335,000
5
bds
|
3
ba
|
2,660
sqft
|
built
2018
3612 Aubree Katherine Dr, Killeen, TX 76542
$-640
Cash flow
-10.0%
Cash-on-Cash Return
4.0%
Cap rate
0.7%
Rent to Value Ratio
Active
$215,000
4
bds
|
2
ba
|
1,458
sqft
|
built
1986
3317 Westrim Dr, Killeen, TX 76549
$-484
Cash flow
-11.7%
Cash-on-Cash Return
3.6%
Cap rate
0.7%
Rent to Value Ratio
Active
$265,000
3
bds
|
3
ba
|
2,127
sqft
|
built
2006
5902 Chuckwagon Cir, Killeen, TX 76542
$-564
Cash flow
-11.1%
Cash-on-Cash Return
3.7%
Cap rate
0.7%
Rent to Value Ratio
Active
$405,000
2
bds
|
2
ba
|
3,717
sqft
|
built
2002
1601 Dugger Cir, Killeen, TX 76543
$-2,259
Cash flow
-29.1%
Cash-on-Cash Return
-0.4%
Cap rate
0.2%
Rent to Value Ratio
Active
$255,000
3
bds
|
3
ba
|
2,966
sqft
|
built
2005
1505 Line Dance Ct, Killeen, TX 76542
$-456
Cash flow
-9.3%
Cash-on-Cash Return
4.1%
Cap rate
0.8%
Rent to Value Ratio
Active
$335,000
4
bds
|
3
ba
|
2,329
sqft
|
built
2019
4505 Prewitt Ranch Rd, Killeen, TX 76549
$-682
Cash flow
-10.6%
Cash-on-Cash Return
3.8%
Cap rate
0.7%
Rent to Value Ratio
Active
$275,000
4
bds
|
2
ba
|
1,706
sqft
|
built
2007
4902 Slate Ct, Killeen, TX 76542
$-673
Cash flow
-12.8%
Cash-on-Cash Return
3.3%
Cap rate
0.6%
Rent to Value Ratio
Active
$285,000
4
bds
|
3
ba
|
2,553
sqft
|
built
2004
2409 Eppinette Dr, Killeen, TX 76542
$-521
Cash flow
-9.5%
Cash-on-Cash Return
4.1%
Cap rate
0.7%
Rent to Value Ratio
Active
$175,000
3
bds
|
3
ba
|
1,682
sqft
|
built
2008
508 Perseus, Killeen, TX 76542
$-42
Cash flow
-1.3%
Cash-on-Cash Return
6.0%
Cap rate
1.0%
Rent to Value Ratio
Active
$175,000
4
bds
|
1
ba
|
1,255
sqft
|
built
1964
3102 Taft St, Killeen, TX 76543
$-186
Cash flow
-5.5%
Cash-on-Cash Return
5.0%
Cap rate
0.7%
Rent to Value Ratio
Active
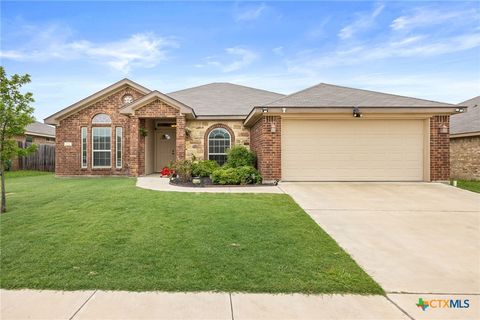
$287,000
3
bds
|
2
ba
|
1,954
sqft
|
built
2016
7002 Spirit Of The West Dr, Killeen, TX 76549
$-700
Cash flow
-12.7%
Cash-on-Cash Return
3.3%
Cap rate
0.6%
Rent to Value Ratio
Active
$303,821
4
bds
|
2
ba
|
1,881
sqft
|
built
2009
6902 Golden Oak Ln, Killeen, TX 76542
$-785
Cash flow
-13.5%
Cash-on-Cash Return
3.2%
Cap rate
0.6%
Rent to Value Ratio
Active
$339,000
4
bds
|
2
ba
|
1,866
sqft
|
built
2022
8302 Ridge Crest Dr, Killeen, TX 76542
$-1,103
Cash flow
-17.0%
Cash-on-Cash Return
2.4%
Cap rate
0.5%
Rent to Value Ratio
Active
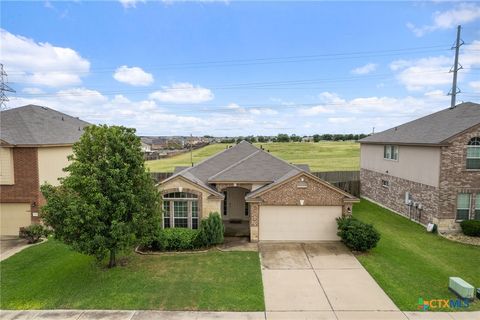
$294,000
3
bds
|
2
ba
|
2,529
sqft
|
built
2002
4504 Twin Oaks Cir, Killeen, TX 76542
$-610
Cash flow
-10.8%
Cash-on-Cash Return
3.8%
Cap rate
0.7%
Rent to Value Ratio
Active
$399,999
bds
|
0
ba
|
4,571
sqft
|
built
2001
3206 Hereford Ln, Killeen, TX 76542
$-2,361
Cash flow
-30.8%
Cash-on-Cash Return
-0.8%
Cap rate
0.2%
Rent to Value Ratio
Active
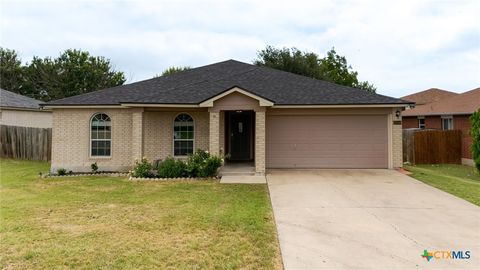
$249,900
4
bds
|
2
ba
|
2,030
sqft
|
built
1969
2004 Mockingbird Ln, Killeen, TX 76541
$-287
Cash flow
-6.0%
Cash-on-Cash Return
4.9%
Cap rate
0.8%
Rent to Value Ratio
Active
$329,900
4
bds
|
3
ba
|
2,757
sqft
|
built
2017
3303 Lorne Dr, Killeen, TX 76542
$-781
Cash flow
-12.4%
Cash-on-Cash Return
3.4%
Cap rate
0.7%
Rent to Value Ratio