Killeen, TX Investment Properties for Sale
Browse homes for sale and investment properties in Killeen, TX. Refine your search by price, property type, or more.
Best cash flowing properties in Killeen, TX

Active
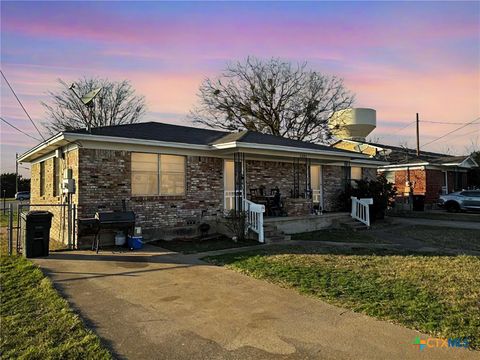
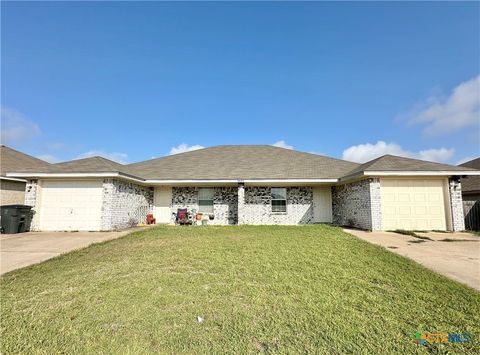
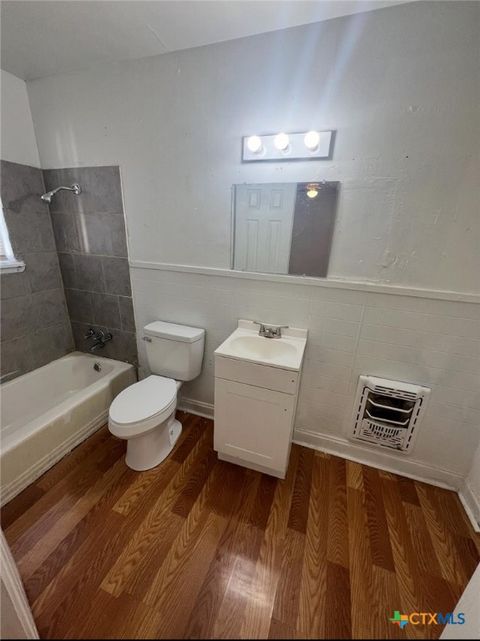
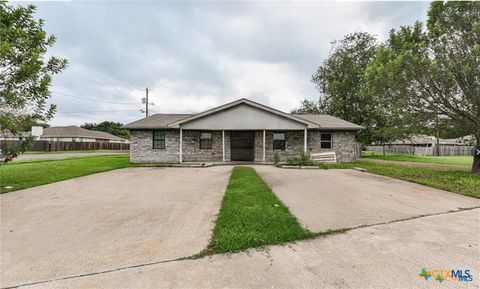
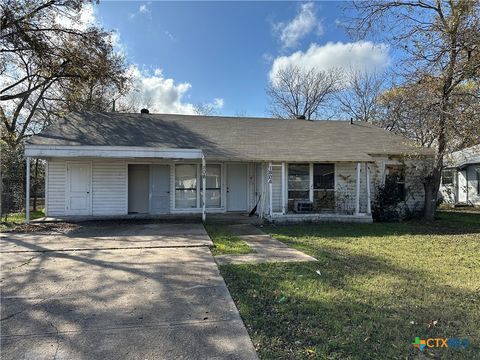
$160,000
bds
|
0
ba
|
1,703
sqft
|
built
1958
1802 Fairview Dr, Killeen, TX 76541
$6
Cash flow
0.2%
Cash-on-Cash Return
6.3%
Cap rate
1.0%
Rent to Value Ratio
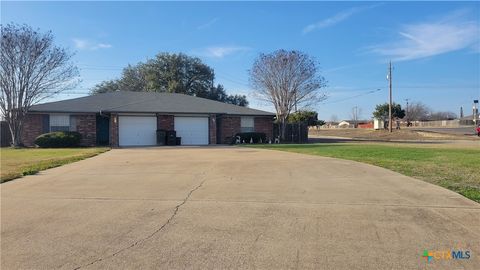
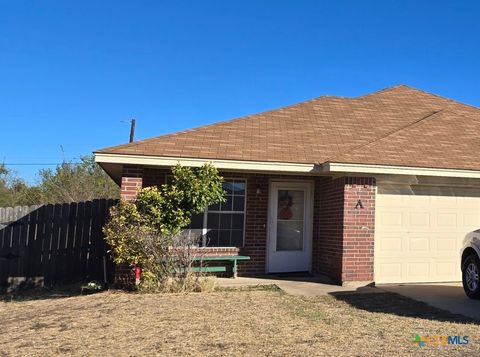
Active
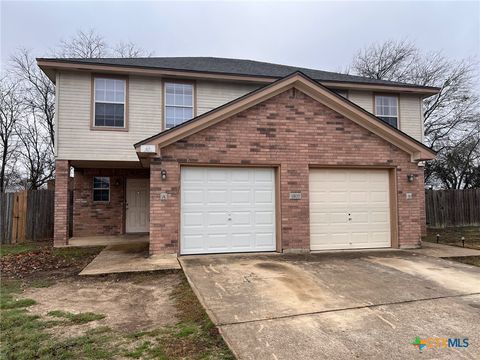
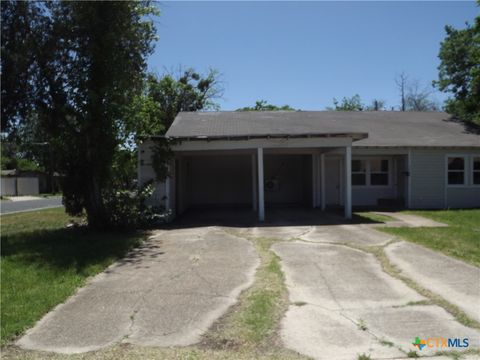
$114,900
bds
|
0
ba
|
1,100
sqft
|
built
1969
1501 Bundrant Dr, Killeen, TX 76543
$-186
Cash flow
-8.4%
Cash-on-Cash Return
4.3%
Cap rate
0.5%
Rent to Value Ratio
47 out of 74 properties for sale in Killeen, TX
Limited Results Shown
Create a free account, or log in to reveal all property listings and enjoy the complete experience.
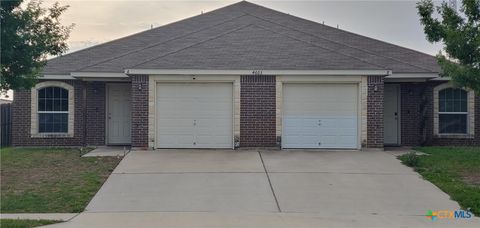
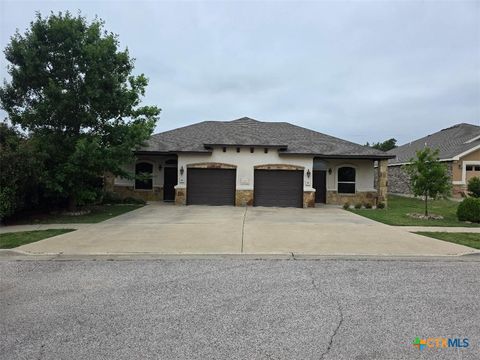
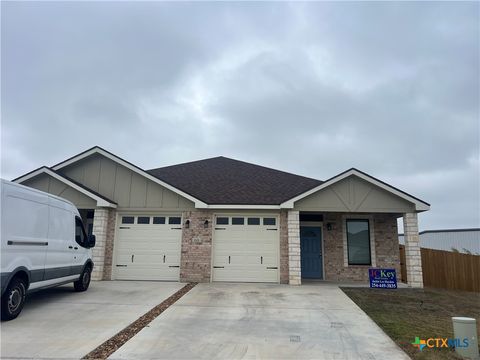
Active
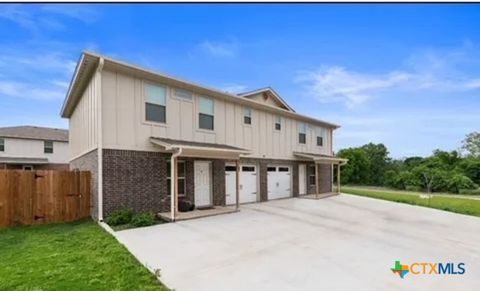
$329,000
bds
|
0
ba
|
2,471
sqft
|
built
2015
4603 Waterproof, Killeen, TX 76549
$-1,431
Cash flow
-22.7%
Cash-on-Cash Return
1.0%
Cap rate
0.4%
Rent to Value Ratio
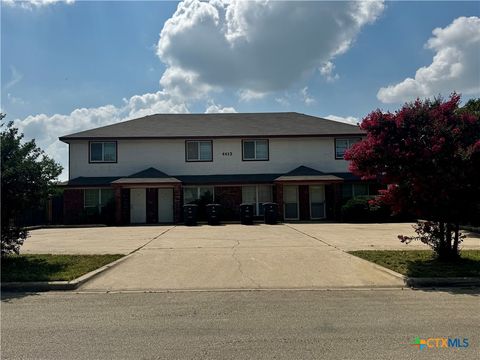
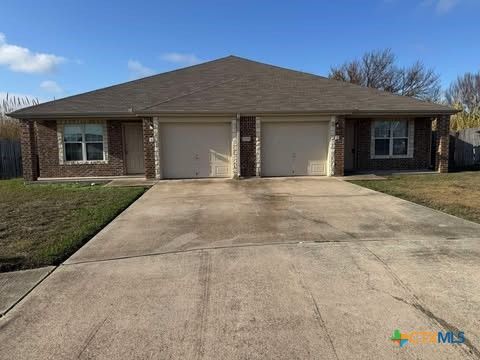
Active
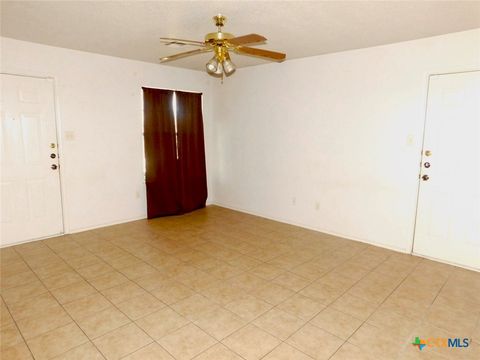
$425,000
bds
|
0
ba
|
4,258
sqft
|
built
2003
4413 Abigail Dr, Killeen, TX 76549
$-2,424
Cash flow
-29.8%
Cash-on-Cash Return
-0.6%
Cap rate
0.2%
Rent to Value Ratio
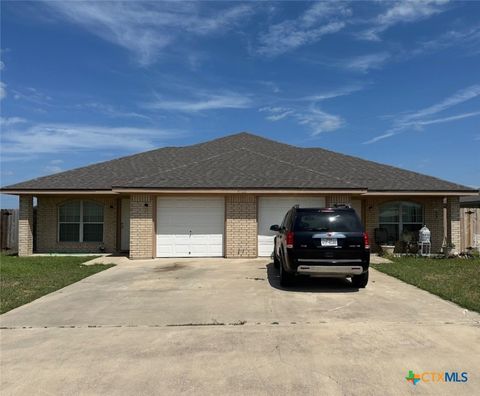
Active
$320,000
bds
|
0
ba
|
2,606
sqft
|
built
2004
4102 Jeff Scott Dr, Killeen, TX 76549
$-1,372
Cash flow
-22.4%
Cash-on-Cash Return
1.1%
Cap rate
0.3%
Rent to Value Ratio
Active
$410,000
bds
|
0
ba
|
2,680
sqft
|
built
2015
409 Study Hall Loop, Killeen, TX 76549
$-1,382
Cash flow
-17.6%
Cash-on-Cash Return
2.2%
Cap rate
0.3%
Rent to Value Ratio
Active
$180,000
bds
|
0
ba
|
1,600
sqft
|
built
1968
1018 N 12th St, Killeen, TX 76541
$-719
Cash flow
-20.8%
Cash-on-Cash Return
1.5%
Cap rate
0.3%
Rent to Value Ratio
Active
$399,000
bds
|
0
ba
|
3,870
sqft
|
built
1977
4504 Hunt Cir, Killeen, TX 76543
$-2,119
Cash flow
-27.7%
Cash-on-Cash Return
-0.1%
Cap rate
0.2%
Rent to Value Ratio

Active
$350,000
bds
|
0
ba
|
2,340
sqft
|
built
2022
1204 N 18th St, Killeen, TX 76541
$-1,471
Cash flow
-21.9%
Cash-on-Cash Return
1.2%
Cap rate
0.4%
Rent to Value Ratio
Active
$425,000
bds
|
0
ba
|
4,319
sqft
|
built
2002
4509 Mattie Dr, Killeen, TX 76549
$-2,475
Cash flow
-30.4%
Cash-on-Cash Return
-0.7%
Cap rate
0.1%
Rent to Value Ratio
Active
$295,000
bds
|
0
ba
|
2,470
sqft
|
built
2004
3805 Uvalde Dr, Killeen, TX 76549
$-1,224
Cash flow
-21.6%
Cash-on-Cash Return
1.3%
Cap rate
0.4%
Rent to Value Ratio

Active
$299,900
bds
|
0
ba
|
2,526
sqft
|
built
2001
2808 Lucille Dr, Killeen, TX 76549
$-1,292
Cash flow
-22.5%
Cash-on-Cash Return
1.1%
Cap rate
0.4%
Rent to Value Ratio
Active
$295,000
bds
|
0
ba
|
2,221
sqft
|
built
2007
1402 Chips, Killeen, TX 76549
$-1,280
Cash flow
-22.6%
Cash-on-Cash Return
1.1%
Cap rate
0.4%
Rent to Value Ratio

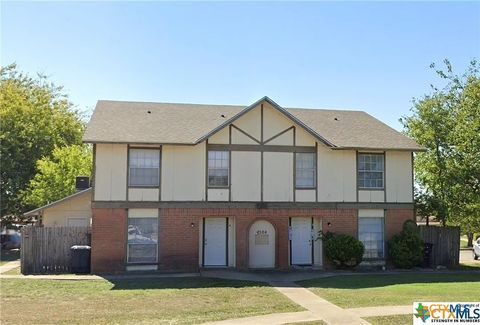
Active
$295,000
bds
|
0
ba
|
2,221
sqft
|
built
2007
1401 Chips, Killeen, TX 76549
$-1,280
Cash flow
-22.6%
Cash-on-Cash Return
1.1%
Cap rate
0.4%
Rent to Value Ratio
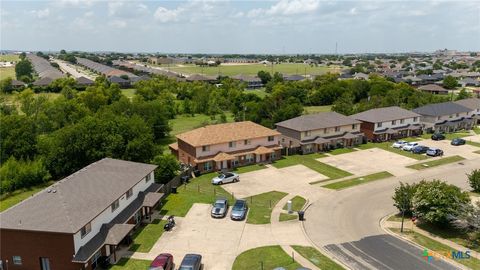
Active
$295,000
bds
|
0
ba
|
2,221
sqft
|
built
2007
1300 Chips, Killeen, TX 76549
$-1,280
Cash flow
-22.6%
Cash-on-Cash Return
1.1%
Cap rate
0.4%
Rent to Value Ratio
Active
$159,000
bds
|
0
ba
|
1,574
sqft
|
built
1959
602 Blake St, Killeen, TX 76541
$-497
Cash flow
-16.3%
Cash-on-Cash Return
2.5%
Cap rate
0.5%
Rent to Value Ratio
Active
$295,000
bds
|
0
ba
|
1,550
sqft
|
built
1985
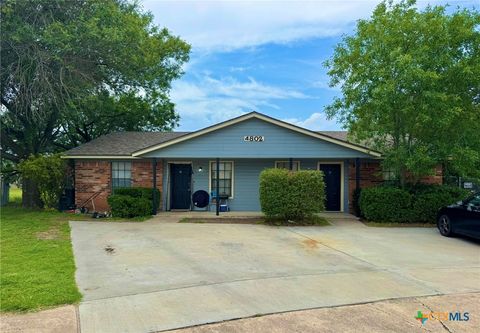
4802 Rainbow Cir, Killeen, TX 76543
$-1,404
Cash flow
-24.8%
Cash-on-Cash Return
0.6%
Cap rate
0.2%
Rent to Value Ratio
Active
$355,000
bds
|
0
ba
|
2,534
sqft
|
built
2019
5708 Lariat Ct, Killeen, TX 76543
$-956
Cash flow
-14.1%
Cash-on-Cash Return
3.0%
Cap rate
0.4%
Rent to Value Ratio
Active
$169,000
bds
|
0
ba
|
1,626
sqft
|
built
1940
112 W Harrison Ave, Killeen, TX 76541
$-684
Cash flow
-21.1%
Cash-on-Cash Return
1.4%
Cap rate
0.4%
Rent to Value Ratio
Active
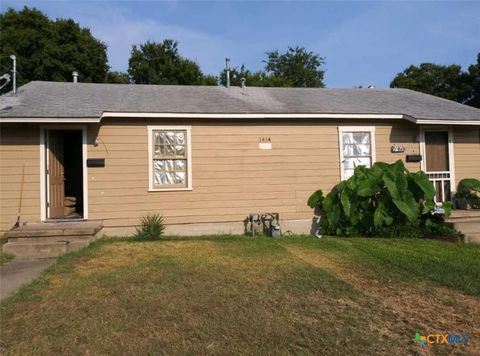
$117,500
2
bds
|
0
ba
|
960
sqft
|
built
1956
1414 Mulford St, Killeen, TX 76541
$-265
Cash flow
-11.8%
Cash-on-Cash Return
3.6%
Cap rate
0.6%
Rent to Value Ratio
Active
$235,000
bds
|
0
ba
|
1,944
sqft
|
built
1960
1105 Harbour Ave, Killeen, TX 76541
$-896
Cash flow
-19.9%
Cash-on-Cash Return
1.7%
Cap rate
0.3%
Rent to Value Ratio
Active
$178,000
bds
|
0
ba
|
1,713
sqft
|
built
1956
1714 Duncan Ave, Killeen, TX 76541
$-732
Cash flow
-21.5%
Cash-on-Cash Return
1.3%
Cap rate
0.3%
Rent to Value Ratio
Active
$349,000
bds
|
0
ba
|
2,754
sqft
|
built
2022
503 Stringer St, Killeen, TX 76541
$-1,428
Cash flow
-21.3%
Cash-on-Cash Return
1.4%
Cap rate
0.4%
Rent to Value Ratio
Active
$160,000
bds
|
0
ba
|
1,703
sqft
|
built
1958
1802 Fairview Dr, Killeen, TX 76541
$6
Cash flow
0.2%
Cash-on-Cash Return
6.3%
Cap rate
1.0%
Rent to Value Ratio
Active
$318,000
bds
|
0
ba
|
2,306
sqft
|
built
2002
2803 Alma Dr, Killeen, TX 76549
$-1,523
Cash flow
-25.0%
Cash-on-Cash Return
0.5%
Cap rate
0.3%
Rent to Value Ratio
Active
$450,000
bds
|
0
ba
|
4,230
sqft
|
built
2001
4203 July Dr, Killeen, TX 76549
$-2,037
Cash flow
-23.6%
Cash-on-Cash Return
0.8%
Cap rate
0.3%
Rent to Value Ratio
Active
$415,000
bds
|
0
ba
|
3,600
sqft
|
built
1999
1200 Industrial Blvd, Killeen, TX 76549
$-2,242
Cash flow
-28.2%
Cash-on-Cash Return
-0.2%
Cap rate
0.2%
Rent to Value Ratio
Active
$333,950
bds
|
0
ba
|
2,590
sqft
|
built
2005
3005 Dannen Ct, Killeen, TX 76549
$-1,288
Cash flow
-20.1%
Cash-on-Cash Return
1.6%
Cap rate
0.3%
Rent to Value Ratio
Active
$365,000
bds
|
0
ba
|
2,590
sqft
|
built
2001
4902 John David Dr, Killeen, TX 76549
$-1,735
Cash flow
-24.8%
Cash-on-Cash Return
0.6%
Cap rate
0.2%
Rent to Value Ratio
Active
$114,900
bds
|
0
ba
|
1,100
sqft
|
built
1969
1501 Bundrant Dr, Killeen, TX 76543
$-186
Cash flow
-8.4%
Cash-on-Cash Return
4.3%
Cap rate
0.5%
Rent to Value Ratio
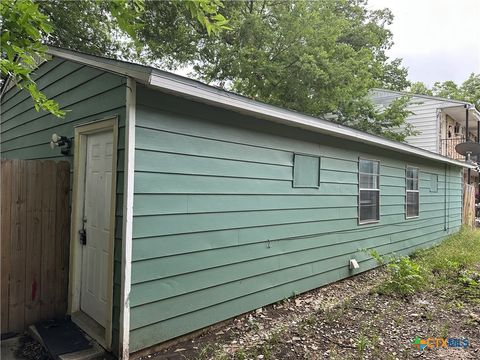
Active
$175,000
bds
|
0
ba
|
1,500
sqft
|
built
1985
1806 Cedarhill Dr, Killeen, TX 76543
$-783
Cash flow
-23.3%
Cash-on-Cash Return
0.9%
Cap rate
0.3%
Rent to Value Ratio
Active
$285,000
bds
|
0
ba
|
2,187
sqft
|
built
1999
2209 Wright Way, Killeen, TX 76543
$-1,298
Cash flow
-23.8%
Cash-on-Cash Return
0.8%
Cap rate
0.4%
Rent to Value Ratio

Active
$190,000
bds
|
0
ba
|
2,074
sqft
|
built
1976
2209 Cascade Dr, Killeen, TX 76549
$-801
Cash flow
-22.0%
Cash-on-Cash Return
1.2%
Cap rate
0.4%
Rent to Value Ratio
Active
$439,000
bds
|
0
ba
|
2,660
sqft
|
built
2023
1101 Carlsberg Dr, Killeen, TX 76549
$-1,899
Cash flow
-22.6%
Cash-on-Cash Return
1.1%
Cap rate
0.3%
Rent to Value Ratio

Active
$147,500
bds
|
0
ba
|
1,672
sqft
|
built
1999
905 Parmer Ave, Killeen, TX 76541
$-284
Cash flow
-10.0%
Cash-on-Cash Return
4.0%
Cap rate
0.7%
Rent to Value Ratio

Active
$182,000
bds
|
0
ba
|
1,695
sqft
|
built
1956
802 Evetts Rd, Killeen, TX 76541
$-692
Cash flow
-19.8%
Cash-on-Cash Return
1.7%
Cap rate
0.4%
Rent to Value Ratio

Active
$170,000
bds
|
0
ba
|
1,172
sqft
|
built
1915
613 Murphy St, Killeen, TX 76541
$-243
Cash flow
-7.5%
Cash-on-Cash Return
4.6%
Cap rate
0.6%
Rent to Value Ratio
Active
$315,900
bds
|
0
ba
|
2,412
sqft
|
built
2007
4208 Elms Run Cir, Killeen, TX 76542
$-1,334
Cash flow
-22.0%
Cash-on-Cash Return
1.2%
Cap rate
0.4%
Rent to Value Ratio
Active
$130,000
bds
|
0
ba
|
846
sqft
|
built
1955
1806 Alamo Ave, Killeen, TX 76541
$-459
Cash flow
-18.4%
Cash-on-Cash Return
2.0%
Cap rate
0.4%
Rent to Value Ratio

Active
$135,000
bds
|
0
ba
|
1,675
sqft
|
built
1955
1802 Alamo Ave, Killeen, TX 76541
$-523
Cash flow
-20.2%
Cash-on-Cash Return
1.6%
Cap rate
0.4%
Rent to Value Ratio

Active
$165,000
bds
|
0
ba
|
1,692
sqft
|
built
1956
1901 Alamo Ave, Killeen, TX 76541
$-658
Cash flow
-20.8%
Cash-on-Cash Return
1.5%
Cap rate
0.4%
Rent to Value Ratio
Active
$330,000
bds
|
0
ba
|
2,226
sqft
|
built
2001
3015 Cantabrian Dr, Killeen, TX 76542
$-1,507
Cash flow
-23.8%
Cash-on-Cash Return
0.8%
Cap rate
0.3%
Rent to Value Ratio