Killeen, TX Investment Properties for Sale
Browse homes for sale and investment properties in Killeen, TX. Refine your search by price, property type, or more.
Best cash flowing properties in Killeen, TX
Active
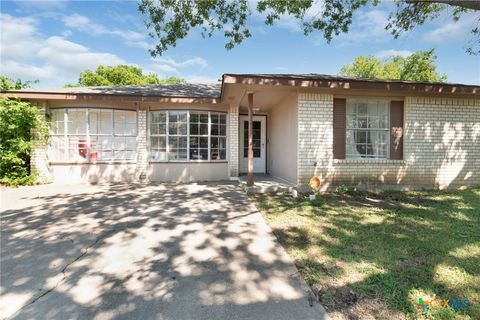
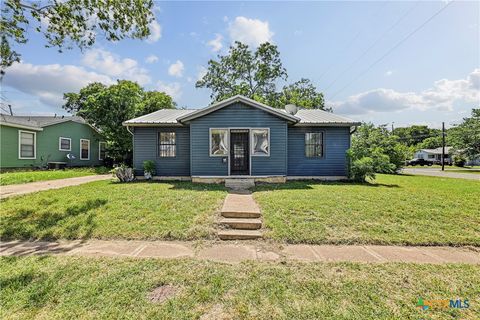
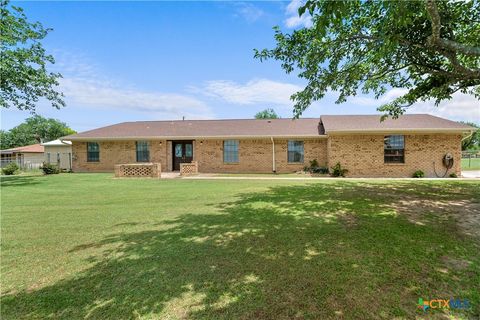
$160,000
4
bds
|
2
ba
|
1,788
sqft
|
built
1979
2110 Robert E Lee Dr, Killeen, TX 76543
$200
Cash flow
6.5%
Cash-on-Cash Return
7.8%
Cap rate
0.9%
Rent to Value Ratio
Active
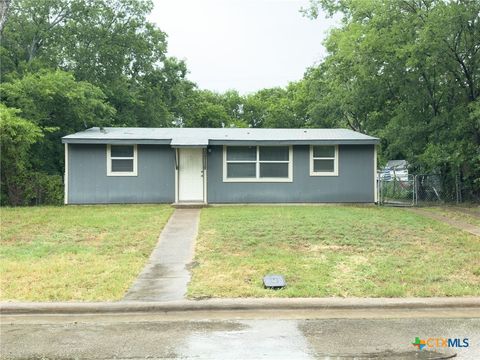
$100,000
2
bds
|
1
ba
|
925
sqft
|
built
1955
807 Evergreen Dr, Killeen, TX 76541
$159
Cash flow
8.3%
Cash-on-Cash Return
8.2%
Cap rate
1.2%
Rent to Value Ratio
622 out of 771 properties for sale in Killeen, TX
Limited Results Shown
Create a free account, or log in to reveal all property listings and enjoy the complete experience.
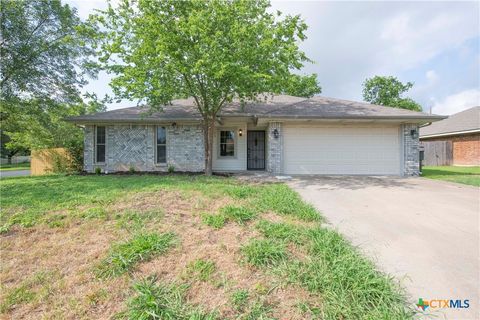
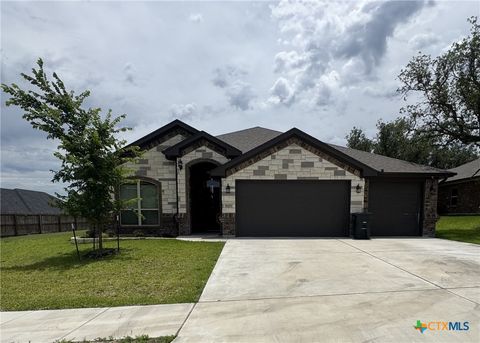
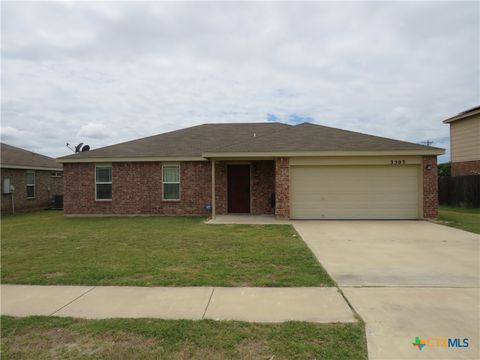
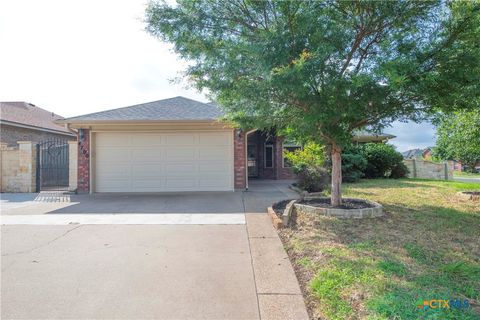
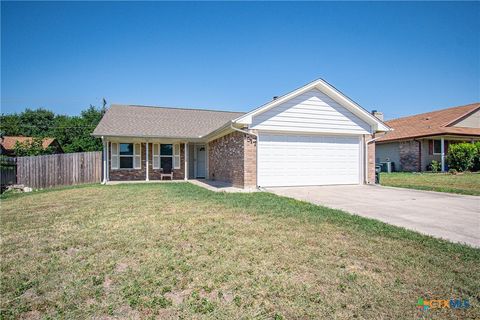
Active
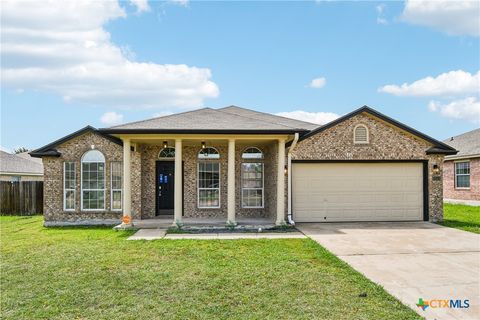
$209,900
3
bds
|
2
ba
|
1,416
sqft
|
built
1987
4812 Pepper Mill Holw, Killeen, TX 76542
$-432
Cash flow
-10.7%
Cash-on-Cash Return
3.8%
Cap rate
0.7%
Rent to Value Ratio
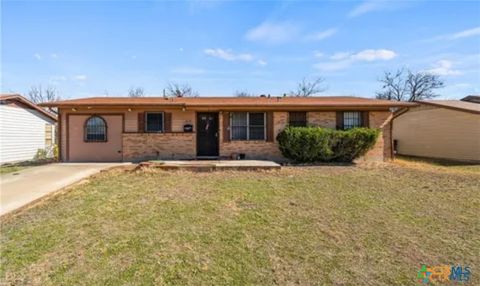
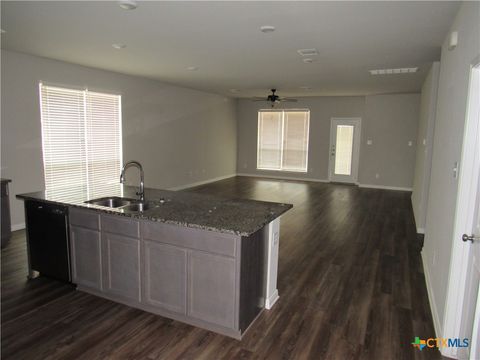
Active
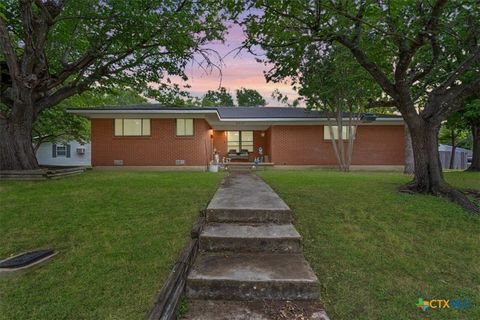
$155,000
4
bds
|
1
ba
|
1,300
sqft
|
built
1963
1214 Alta Vista Dr, Killeen, TX 76549
$-12
Cash flow
-0.4%
Cash-on-Cash Return
6.2%
Cap rate
0.9%
Rent to Value Ratio
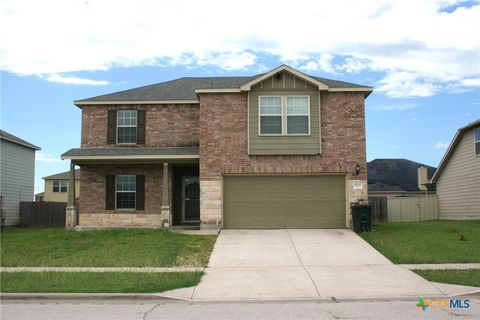
Active
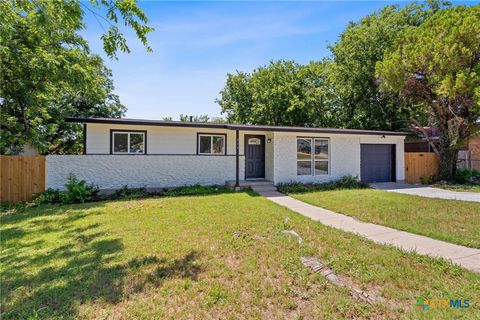
$315,000
4
bds
|
2
ba
|
1,861
sqft
|
built
2007
127 Ariana Ct, Killeen, TX 76542
$-570
Cash flow
-9.4%
Cash-on-Cash Return
4.1%
Cap rate
0.6%
Rent to Value Ratio
Active
$279,500
5
bds
|
3
ba
|
2,080
sqft
|
built
2014
6408 Castle Gap Dr, Killeen, TX 76549
$-602
Cash flow
-11.2%
Cash-on-Cash Return
3.7%
Cap rate
0.7%
Rent to Value Ratio
Active
$235,000
3
bds
|
2
ba
|
1,362
sqft
|
built
2012
2808 Camp Cooper Dr, Killeen, TX 76549
$-461
Cash flow
-10.2%
Cash-on-Cash Return
3.9%
Cap rate
0.7%
Rent to Value Ratio
Active
$235,000
3
bds
|
2
ba
|
1,517
sqft
|
built
2003
2606 Wesley Dr, Killeen, TX 76549
$-454
Cash flow
-10.1%
Cash-on-Cash Return
3.9%
Cap rate
0.7%
Rent to Value Ratio
Active
$159,900
3
bds
|
1
ba
|
1,150
sqft
|
built
1957
802 Cloud St, Killeen, TX 76541
$-428
Cash flow
-14.0%
Cash-on-Cash Return
3.1%
Cap rate
0.6%
Rent to Value Ratio
Active
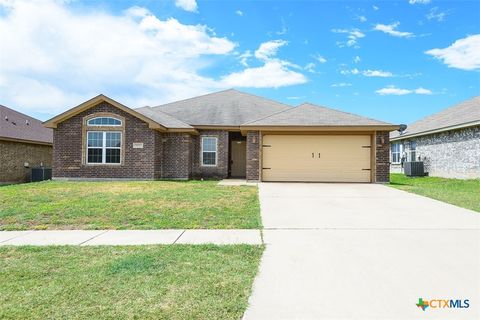
$160,000
4
bds
|
2
ba
|
1,788
sqft
|
built
1979
2110 Robert E Lee Dr, Killeen, TX 76543
$200
Cash flow
6.5%
Cash-on-Cash Return
7.8%
Cap rate
0.9%
Rent to Value Ratio
Active
$275,000
3
bds
|
2
ba
|
2,374
sqft
|
built
2004
2010 Schorn Dr, Killeen, TX 76542
$-666
Cash flow
-12.6%
Cash-on-Cash Return
3.4%
Cap rate
0.7%
Rent to Value Ratio
Active
$225,000
4
bds
|
2
ba
|
2,091
sqft
|
built
1963
3217 Lake Belton Ave, Killeen, TX 76543
$-415
Cash flow
-9.6%
Cash-on-Cash Return
4.1%
Cap rate
0.7%
Rent to Value Ratio
Active
$209,999
3
bds
|
2
ba
|
1,179
sqft
|
built
1970
711 Santa Rosa Dr, Killeen, TX 76541
$-423
Cash flow
-10.5%
Cash-on-Cash Return
3.8%
Cap rate
0.6%
Rent to Value Ratio
Active
$500,000
4
bds
|
3
ba
|
2,315
sqft
|
built
2022
8108 Gold Dr, Killeen, TX 76542
$-1,835
Cash flow
-19.1%
Cash-on-Cash Return
1.9%
Cap rate
0.4%
Rent to Value Ratio
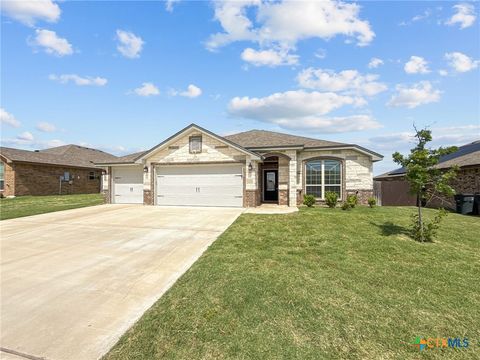
Active
$310,000
3
bds
|
2
ba
|
1,839
sqft
|
built
2022
10018 Kensley Rose Dr, Killeen, TX 76542
$-238
Cash flow
-4.0%
Cash-on-Cash Return
5.3%
Cap rate
0.6%
Rent to Value Ratio
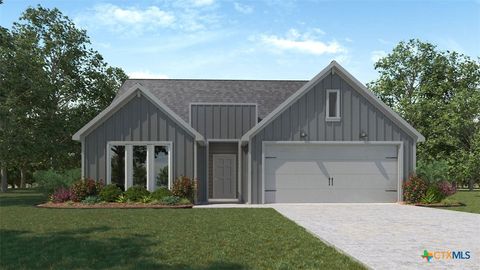
Active
$286,355
4
bds
|
2
ba
|
1,612
sqft
|
built
2025
2506 Tara Dr, Killeen, TX 76549
$-145
Cash flow
-2.6%
Cash-on-Cash Return
5.7%
Cap rate
0.7%
Rent to Value Ratio
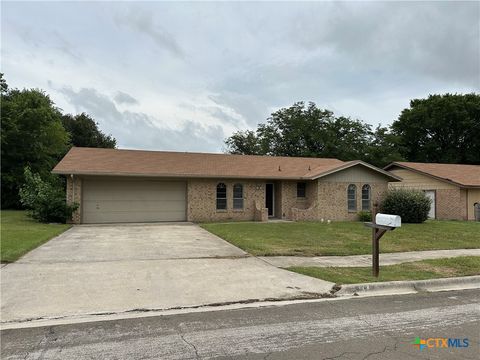
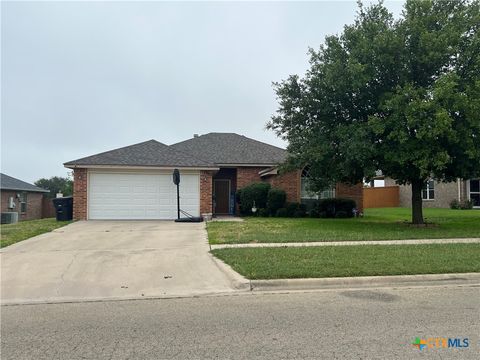
Active
$175,500
3
bds
|
2
ba
|
1,373
sqft
|
built
1975
1804 Hill St, Killeen, TX 76543
$-235
Cash flow
-7.0%
Cash-on-Cash Return
4.7%
Cap rate
0.8%
Rent to Value Ratio
Active
$275,000
4
bds
|
2
ba
|
1,935
sqft
|
built
2013
2102 Golden Eagle Dr, Killeen, TX 76549
$-613
Cash flow
-11.6%
Cash-on-Cash Return
3.6%
Cap rate
0.7%
Rent to Value Ratio
Active
$222,000
3
bds
|
3
ba
|
1,568
sqft
|
built
2009
5500 Lions Gate Ln, Killeen, TX 76549
$-412
Cash flow
-9.7%
Cash-on-Cash Return
4.0%
Cap rate
0.7%
Rent to Value Ratio
Active
$170,000
3
bds
|
1
ba
|
1,122
sqft
|
built
1967
1306 Violet Ave, Killeen, TX 76543
$-392
Cash flow
-12.0%
Cash-on-Cash Return
3.5%
Cap rate
0.6%
Rent to Value Ratio
Active
$289,000
3
bds
|
2
ba
|
1,656
sqft
|
built
1984
1416 Amber Rd, Killeen, TX 76543
$-843
Cash flow
-15.2%
Cash-on-Cash Return
2.8%
Cap rate
0.5%
Rent to Value Ratio
Active
$230,000
4
bds
|
2
ba
|
1,566
sqft
|
built
2010
3503 Ennis Dr, Killeen, TX 76549
$-594
Cash flow
-13.5%
Cash-on-Cash Return
3.2%
Cap rate
0.6%
Rent to Value Ratio
Active
$365,000
4
bds
|
3
ba
|
2,397
sqft
|
built
2020
5205 Colina Dr, Killeen, TX 76549
$-1,157
Cash flow
-16.5%
Cash-on-Cash Return
2.5%
Cap rate
0.5%
Rent to Value Ratio
Active
$230,000
3
bds
|
2
ba
|
1,535
sqft
|
built
2004
5012 Fawn Dr, Killeen, TX 76542
$-479
Cash flow
-10.9%
Cash-on-Cash Return
3.8%
Cap rate
0.7%
Rent to Value Ratio
Active
$243,000
3
bds
|
2
ba
|
1,752
sqft
|
built
1996
1506 Bristol Dr, Killeen, TX 76542
$-505
Cash flow
-10.8%
Cash-on-Cash Return
3.8%
Cap rate
0.7%
Rent to Value Ratio
Active
$100,000
2
bds
|
1
ba
|
925
sqft
|
built
1955
807 Evergreen Dr, Killeen, TX 76541
$159
Cash flow
8.3%
Cash-on-Cash Return
8.2%
Cap rate
1.2%
Rent to Value Ratio
Active
$399,000
bds
|
0
ba
|
3,506
sqft
|
built
1983
1002 Charisse St, Killeen, TX 76543
$-1,975
Cash flow
-25.8%
Cash-on-Cash Return
0.3%
Cap rate
0.2%
Rent to Value Ratio
Active
$124,900
2
bds
|
2
ba
|
1,132
sqft
|
built
1985
1220 Westway Cir, Killeen, TX 76549
$-66
Cash flow
-2.8%
Cash-on-Cash Return
5.6%
Cap rate
0.9%
Rent to Value Ratio
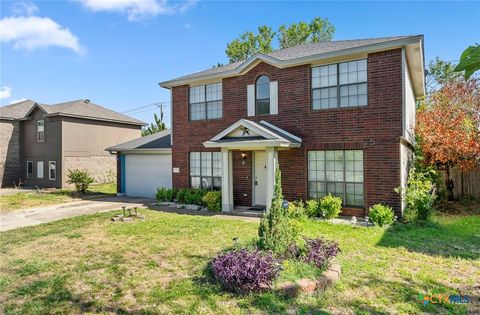
Active
$372,000
4
bds
|
3
ba
|
3,068
sqft
|
built
2003
229 Crossland Dr, Killeen, TX 76543
$-595
Cash flow
-8.3%
Cash-on-Cash Return
4.3%
Cap rate
0.7%
Rent to Value Ratio

Active
$219,000
3
bds
|
2
ba
|
1,520
sqft
|
built
1996
4803 Addie Dr, Killeen, TX 76542
$-487
Cash flow
-11.6%
Cash-on-Cash Return
3.6%
Cap rate
0.6%
Rent to Value Ratio
Active
$329,000
bds
|
0
ba
|
2,471
sqft
|
built
2015
4603 Waterproof, Killeen, TX 76549
$-1,431
Cash flow
-22.7%
Cash-on-Cash Return
1.0%
Cap rate
0.4%
Rent to Value Ratio
Active
$355,000
4
bds
|
2
ba
|
2,435
sqft
|
built
1978
120 Mighty Oak Ln, Killeen, TX 76542
$-1,146
Cash flow
-16.8%
Cash-on-Cash Return
2.4%
Cap rate
0.5%
Rent to Value Ratio
Active
$224,900
3
bds
|
2
ba
|
1,453
sqft
|
built
1998
4700 Aurora Cir, Killeen, TX 76542
$-431
Cash flow
-10.0%
Cash-on-Cash Return
4.0%
Cap rate
0.7%
Rent to Value Ratio
Active
$275,000
4
bds
|
3
ba
|
2,460
sqft
|
built
2014
308 E Vega Ln, Killeen, TX 76542
$-584
Cash flow
-11.1%
Cash-on-Cash Return
3.7%
Cap rate
0.7%
Rent to Value Ratio
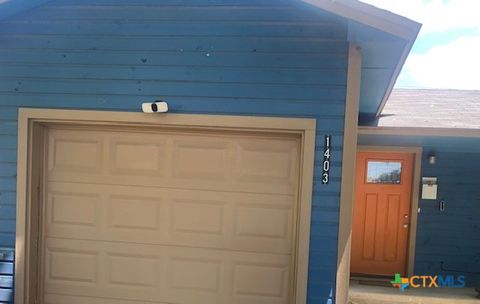
Active
$143,000
3
bds
|
1
ba
|
981
sqft
|
built
1961
1403 Zephyr Rd, Killeen, TX 76541
$-47
Cash flow
-1.7%
Cash-on-Cash Return
5.9%
Cap rate
0.9%
Rent to Value Ratio
Active
$219,900
3
bds
|
2
ba
|
1,509
sqft
|
built
1983
1517 Iris Ave, Killeen, TX 76543
$-117
Cash flow
-2.8%
Cash-on-Cash Return
5.6%
Cap rate
0.8%
Rent to Value Ratio
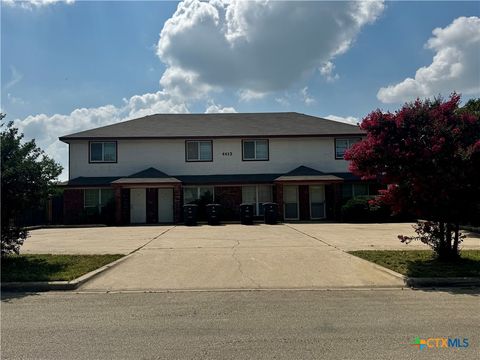
Active
$425,000
bds
|
0
ba
|
4,258
sqft
|
built
2003
4413 Abigail Dr, Killeen, TX 76549
$-2,424
Cash flow
-29.8%
Cash-on-Cash Return
-0.6%
Cap rate
0.2%
Rent to Value Ratio
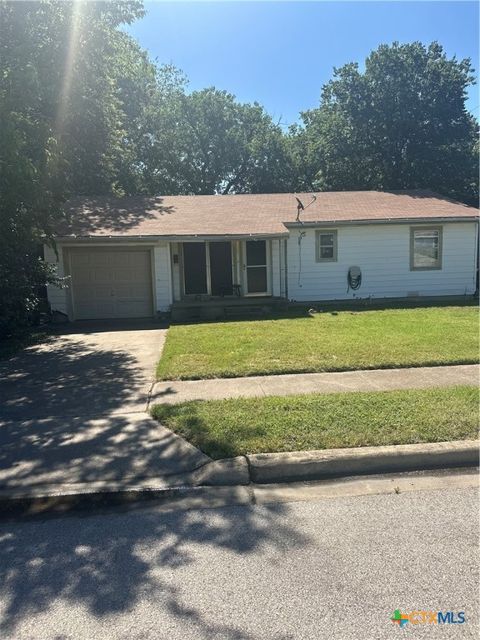
Active
$85,000
3
bds
|
1
ba
|
1,064
sqft
|
built
1958
1004 S 2nd St, Killeen, TX 76541
$137
Cash flow
8.4%
Cash-on-Cash Return
8.2%
Cap rate
1.3%
Rent to Value Ratio
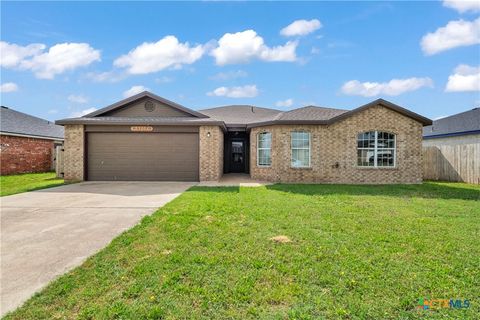
Active
$235,000
4
bds
|
2
ba
|
1,918
sqft
|
built
2007
5202 Holster Dr, Killeen, TX 76549
$-459
Cash flow
-10.2%
Cash-on-Cash Return
3.9%
Cap rate
0.7%
Rent to Value Ratio
Active
$268,500
3
bds
|
2
ba
|
1,476
sqft
|
built
2025
3314 Lake Rd, Killeen, TX 76543
$-762
Cash flow
-14.8%
Cash-on-Cash Return
2.9%
Cap rate
0.4%
Rent to Value Ratio
Active
$305,000
4
bds
|
3
ba
|
2,226
sqft
|
built
2020
901 Marlow Cv, Killeen, TX 76542
$-745
Cash flow
-12.7%
Cash-on-Cash Return
3.3%
Cap rate
0.7%
Rent to Value Ratio
Active
$449,500
4
bds
|
3
ba
|
3,486
sqft
|
built
2005
214 Forest Ridge Dr, Killeen, TX 76543
$-972
Cash flow
-11.3%
Cash-on-Cash Return
3.7%
Cap rate
0.6%
Rent to Value Ratio