Killeen, TX Investment Properties for Sale
Browse homes for sale and investment properties in Killeen, TX. Refine your search by price, property type, or more.
Best cash flowing properties in Killeen, TX
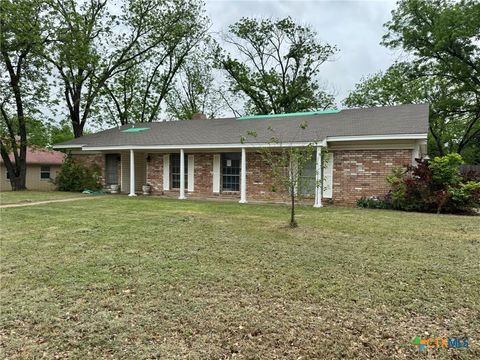
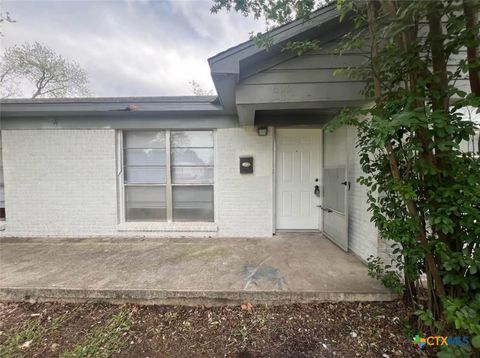
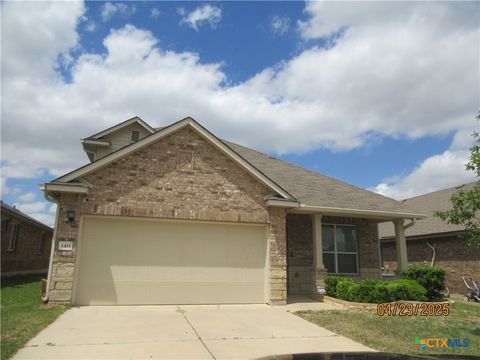
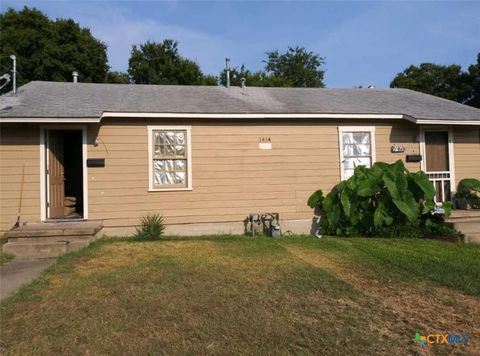
Active
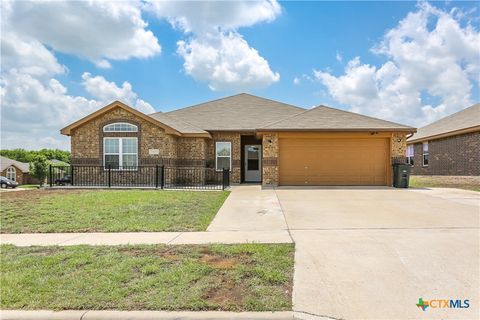
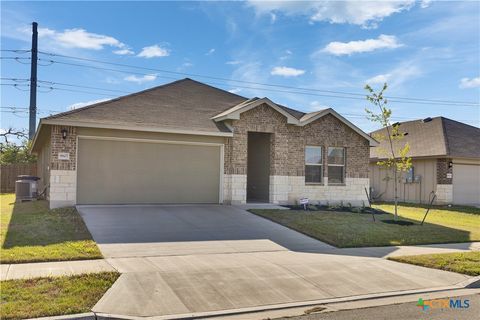
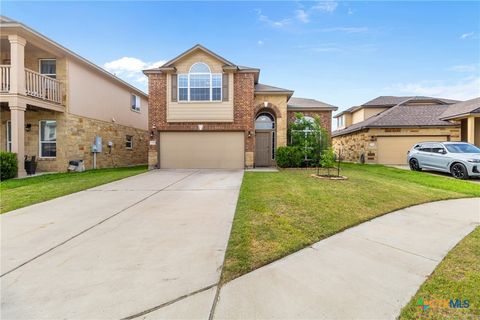
$159,900
4
bds
|
2
ba
|
2,289
sqft
|
built
1965
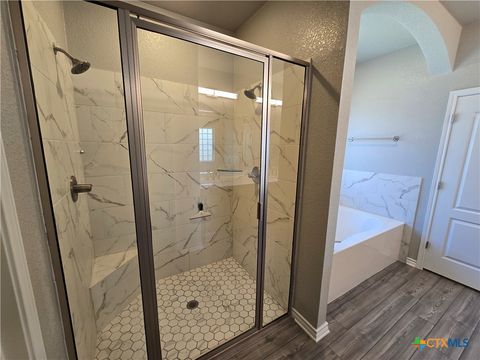
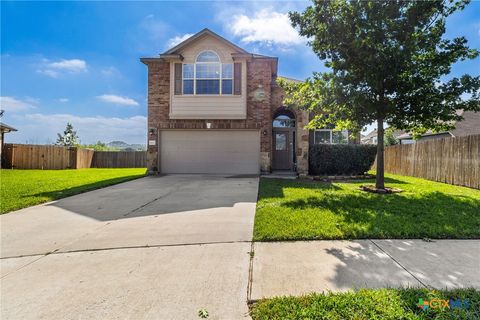
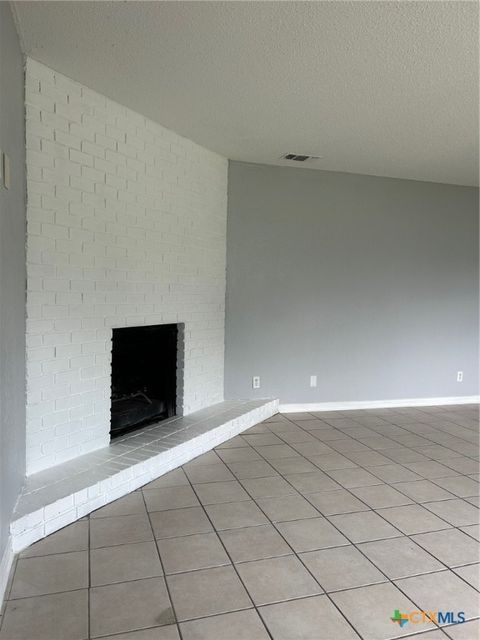
1804 Prather Dr, Killeen, TX 76541
$407
Cash flow
13.3%
Cash-on-Cash Return
9.3%
Cap rate
1.1%
Rent to Value Ratio

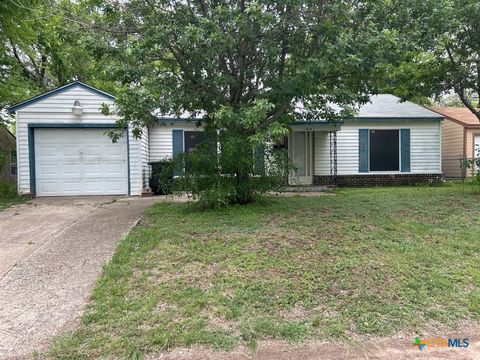
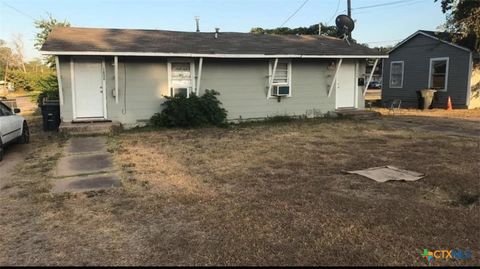
Active
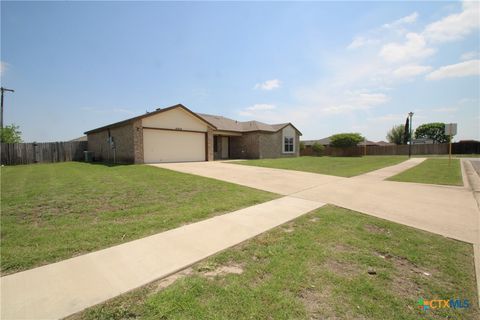
$125,000
3
bds
|
2
ba
|
1,695
sqft
|
built
1964
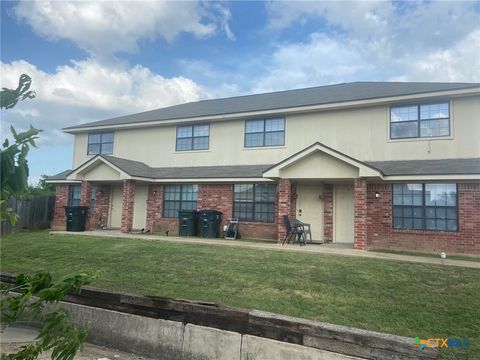
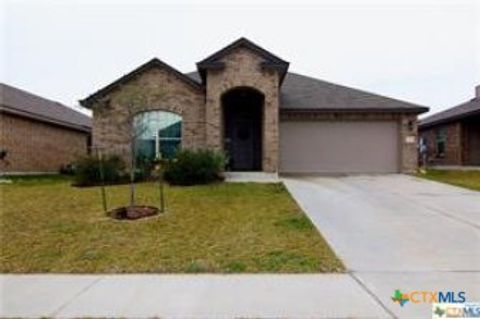
620 Bishop Dr, Killeen, TX 76541
$5
Cash flow
0.2%
Cash-on-Cash Return
6.3%
Cap rate
1.1%
Rent to Value Ratio
543 out of 777 properties for sale in Killeen, TX
Limited Results Shown
Create a free account, or log in to reveal all property listings and enjoy the complete experience.
Active
$260,000
4
bds
|
2
ba
|
1,865
sqft
|
built
2016
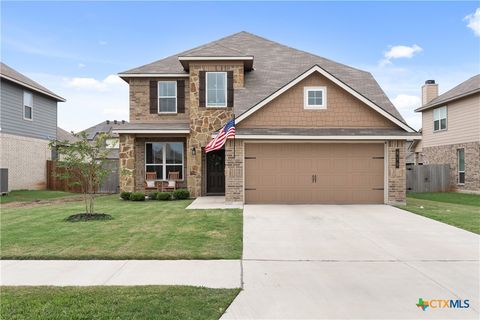
7202 Bose Ikard Dr, Killeen, TX 76549
$-553
Cash flow
-11.1%
Cash-on-Cash Return
3.7%
Cap rate
0.7%
Rent to Value Ratio
Active
$118,000
3
bds
|
1
ba
|
1,044
sqft
|
built
1953
1601 White Ave, Killeen, TX 76541
$-82
Cash flow
-3.6%
Cash-on-Cash Return
5.4%
Cap rate
0.8%
Rent to Value Ratio
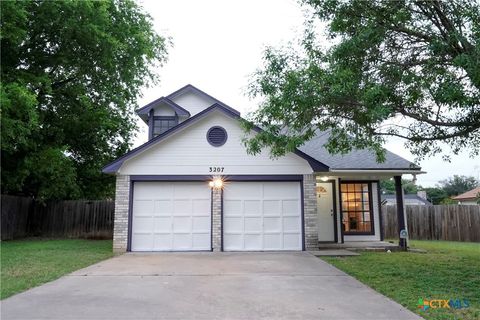
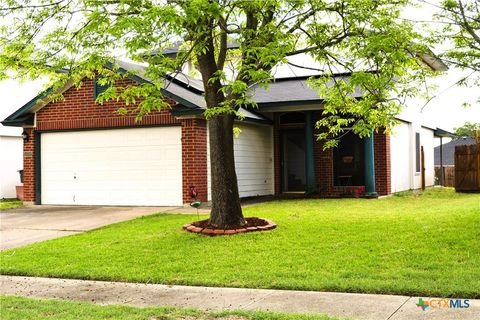
Active
$190,000
3
bds
|
2
ba
|
1,168
sqft
|
built
1986
3207 Honeysuckle Dr, Killeen, TX 76542
$-267
Cash flow
-7.3%
Cash-on-Cash Return
4.6%
Cap rate
0.7%
Rent to Value Ratio
Active
$259,950
4
bds
|
2
ba
|
1,981
sqft
|
built
2013
2100 Golden Eagle Dr, Killeen, TX 76549
$-628
Cash flow
-12.6%
Cash-on-Cash Return
3.4%
Cap rate
0.6%
Rent to Value Ratio
Active
$361,900
5
bds
|
3
ba
|
2,711
sqft
|
built
2014
6404 Mustang Creek Rd, Killeen, TX 76549
$-708
Cash flow
-10.2%
Cash-on-Cash Return
3.9%
Cap rate
0.7%
Rent to Value Ratio
Active
$499,900
3
bds
|
2
ba
|
2,081
sqft
|
built
2005
634 Irish Ln, Killeen, TX 76549
$-1,650
Cash flow
-17.2%
Cash-on-Cash Return
2.3%
Cap rate
0.4%
Rent to Value Ratio
Active
$369,900
4
bds
|
2
ba
|
2,135
sqft
|
built
2023
6105 Spc Laramore Dr, Killeen, TX 76542
$-590
Cash flow
-8.3%
Cash-on-Cash Return
4.4%
Cap rate
0.8%
Rent to Value Ratio
Active
$469,900
4
bds
|
3
ba
|
2,205
sqft
|
built
2022
7802 Gold Dr, Killeen, TX 76542
$-1,073
Cash flow
-11.9%
Cash-on-Cash Return
3.5%
Cap rate
0.4%
Rent to Value Ratio
Active
$310,000
4
bds
|
3
ba
|
2,071
sqft
|
built
2015
4805 Farrell Ln, Killeen, TX 76549
$-882
Cash flow
-14.8%
Cash-on-Cash Return
2.8%
Cap rate
0.5%
Rent to Value Ratio
Active
$439,900
bds
|
0
ba
|
4,230
sqft
|
built
2007
1009 Lansberry Ct, Killeen, TX 76549
$-2,611
Cash flow
-31.0%
Cash-on-Cash Return
-0.9%
Cap rate
0.1%
Rent to Value Ratio
Active
$210,000
4
bds
|
2
ba
|
1,524
sqft
|
built
1989
1502 Stratford Dr, Killeen, TX 76549
$-343
Cash flow
-8.5%
Cash-on-Cash Return
4.3%
Cap rate
0.8%
Rent to Value Ratio

Active
$286,500
3
bds
|
2
ba
|
1,507
sqft
|
built
2024
5002 Rose Garden Loop, Killeen, TX 76542
$-175
Cash flow
-3.2%
Cash-on-Cash Return
5.5%
Cap rate
0.7%
Rent to Value Ratio
Active
$194,900
4
bds
|
2
ba
|
1,607
sqft
|
built
1979
2006 Ruiz Dr, Killeen, TX 76543
$-313
Cash flow
-8.4%
Cash-on-Cash Return
4.3%
Cap rate
0.8%
Rent to Value Ratio
Active
$260,000
3
bds
|
2
ba
|
1,736
sqft
|
built
2017
6309 Katy Creek Ln, Killeen, TX 76549
$-542
Cash flow
-10.9%
Cash-on-Cash Return
3.8%
Cap rate
0.7%
Rent to Value Ratio

Active
$349,000
4
bds
|
2
ba
|
1,739
sqft
|
built
2005
699 Irish Ln, Killeen, TX 76549
$-845
Cash flow
-12.6%
Cash-on-Cash Return
3.4%
Cap rate
0.5%
Rent to Value Ratio
Active
$254,000
4
bds
|
3
ba
|
2,027
sqft
|
built
2007
6502 Griffith Loop, Killeen, TX 76549
$-504
Cash flow
-10.4%
Cash-on-Cash Return
3.9%
Cap rate
0.7%
Rent to Value Ratio
Active
$378,900
4
bds
|
3
ba
|
2,708
sqft
|
built
2022
810 Mc Laury Cv, Killeen, TX 76542
$-1,186
Cash flow
-16.3%
Cash-on-Cash Return
2.5%
Cap rate
0.5%
Rent to Value Ratio
Active
$275,000
4
bds
|
2
ba
|
1,812
sqft
|
built
2021
9607 Kensley Rose Dr, Killeen, TX 76542
$-702
Cash flow
-13.3%
Cash-on-Cash Return
3.2%
Cap rate
0.7%
Rent to Value Ratio
Active
$239,000
4
bds
|
2
ba
|
1,649
sqft
|
built
2005
4916 Judson Ave, Killeen, TX 76549
$-510
Cash flow
-11.1%
Cash-on-Cash Return
3.7%
Cap rate
0.7%
Rent to Value Ratio
Active
$180,000
3
bds
|
2
ba
|
1,177
sqft
|
built
1983
4508 Greenbriar Cir, Killeen, TX 76543
$-189
Cash flow
-5.5%
Cash-on-Cash Return
5.0%
Cap rate
0.8%
Rent to Value Ratio
Active
$235,000
4
bds
|
3
ba
|
1,697
sqft
|
built
2009
3410 Regency Ct, Killeen, TX 76549
$-368
Cash flow
-8.2%
Cash-on-Cash Return
4.4%
Cap rate
0.8%
Rent to Value Ratio
Active
$159,000
bds
|
0
ba
|
1,574
sqft
|
built
1959
602 Blake St, Killeen, TX 76541
$-497
Cash flow
-16.3%
Cash-on-Cash Return
2.5%
Cap rate
0.5%
Rent to Value Ratio
Active
$295,000
bds
|
0
ba
|
1,550
sqft
|
built
1985
4802 Rainbow Cir, Killeen, TX 76543
$-1,404
Cash flow
-24.8%
Cash-on-Cash Return
0.6%
Cap rate
0.2%
Rent to Value Ratio
Active
$159,900
4
bds
|
2
ba
|
2,289
sqft
|
built
1965
1804 Prather Dr, Killeen, TX 76541
$407
Cash flow
13.3%
Cash-on-Cash Return
9.3%
Cap rate
1.1%
Rent to Value Ratio
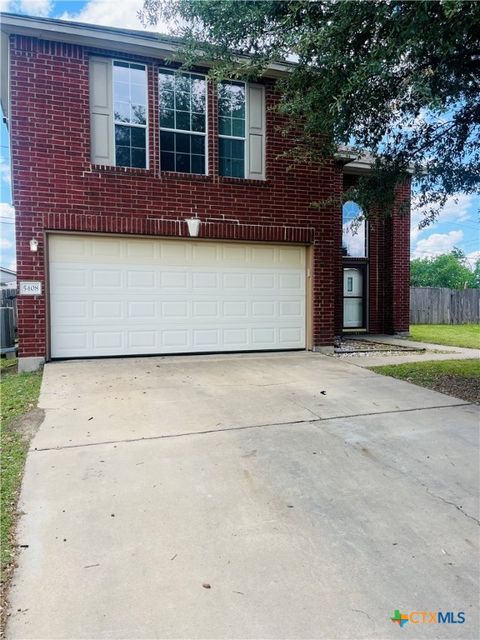
Active
$229,999
3
bds
|
3
ba
|
1,785
sqft
|
built
2005
5408 Donegal Bay Ct, Killeen, TX 76549
$-355
Cash flow
-8.1%
Cash-on-Cash Return
4.4%
Cap rate
0.8%
Rent to Value Ratio
Active
$278,000
4
bds
|
2
ba
|
2,284
sqft
|
built
1994
4803 Chad Dr, Killeen, TX 76542
$-534
Cash flow
-10.0%
Cash-on-Cash Return
4.0%
Cap rate
0.6%
Rent to Value Ratio
Active
$285,000
4
bds
|
3
ba
|
2,630
sqft
|
built
2016
3411 Parkmill Dr, Killeen, TX 76542
$-653
Cash flow
-12.0%
Cash-on-Cash Return
3.5%
Cap rate
0.7%
Rent to Value Ratio
Active
$649,950
4
bds
|
3
ba
|
3,252
sqft
|
built
1993
2110 Lakeview Loop, Killeen, TX 76543
$-2,597
Cash flow
-20.8%
Cash-on-Cash Return
1.5%
Cap rate
0.3%
Rent to Value Ratio
Active
$315,000
5
bds
|
3
ba
|
2,527
sqft
|
built
2019
3621 Aubree Katherine Dr, Killeen, TX 76542
$-58
Cash flow
-1.0%
Cash-on-Cash Return
6.0%
Cap rate
0.7%
Rent to Value Ratio
Active
$355,000
bds
|
0
ba
|
2,534
sqft
|
built
2019
5708 Lariat Ct, Killeen, TX 76543
$-956
Cash flow
-14.1%
Cash-on-Cash Return
3.0%
Cap rate
0.4%
Rent to Value Ratio
Active
$285,000
4
bds
|
3
ba
|
2,100
sqft
|
built
2017
3306 Lorne Dr, Killeen, TX 76542
$-595
Cash flow
-10.9%
Cash-on-Cash Return
3.8%
Cap rate
0.7%
Rent to Value Ratio
Active
$125,000
3
bds
|
2
ba
|
1,695
sqft
|
built
1964
620 Bishop Dr, Killeen, TX 76541
$5
Cash flow
0.2%
Cash-on-Cash Return
6.3%
Cap rate
1.1%
Rent to Value Ratio
Active
$169,000
bds
|
0
ba
|
1,626
sqft
|
built
1940
112 W Harrison Ave, Killeen, TX 76541
$-684
Cash flow
-21.1%
Cash-on-Cash Return
1.4%
Cap rate
0.4%
Rent to Value Ratio
Active
$165,000
3
bds
|
2
ba
|
1,476
sqft
|
built
1963
1004 Estes Dr, Killeen, TX 76541
$-224
Cash flow
-7.1%
Cash-on-Cash Return
4.6%
Cap rate
0.8%
Rent to Value Ratio
Active
$385,000
bds
|
0
ba
|
3,924
sqft
|
built
2001
4202 Deek Dr, Killeen, TX 76549
$-2,150
Cash flow
-29.1%
Cash-on-Cash Return
-0.4%
Cap rate
0.2%
Rent to Value Ratio
Active
$117,500
2
bds
|
0
ba
|
960
sqft
|
built
1956
1414 Mulford St, Killeen, TX 76541
$-265
Cash flow
-11.8%
Cash-on-Cash Return
3.6%
Cap rate
0.6%
Rent to Value Ratio
Active
$249,900
3
bds
|
2
ba
|
1,697
sqft
|
built
1998
1402 Fox Creek Dr, Killeen, TX 76543
$-546
Cash flow
-11.4%
Cash-on-Cash Return
3.6%
Cap rate
0.6%
Rent to Value Ratio

Active
$235,000
4
bds
|
2
ba
|
2,010
sqft
|
built
1994
4301 River Oaks Dr, Killeen, TX 76543
$-347
Cash flow
-7.7%
Cash-on-Cash Return
4.5%
Cap rate
0.8%
Rent to Value Ratio
Active
$235,000
bds
|
0
ba
|
1,944
sqft
|
built
1960
1105 Harbour Ave, Killeen, TX 76541
$-896
Cash flow
-19.9%
Cash-on-Cash Return
1.7%
Cap rate
0.3%
Rent to Value Ratio
Active
$339,000
4
bds
|
3
ba
|
2,539
sqft
|
built
2012
3306 Castleton Dr, Killeen, TX 76542
$-922
Cash flow
-14.2%
Cash-on-Cash Return
3.0%
Cap rate
0.6%
Rent to Value Ratio