Killeen, TX Investment Properties for Sale
Browse homes for sale and investment properties in Killeen, TX. Refine your search by price, property type, or more.
Best cash flowing properties in Killeen, TX
Active
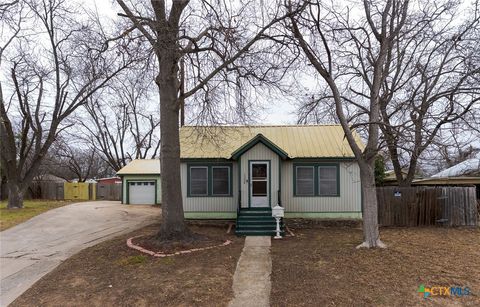
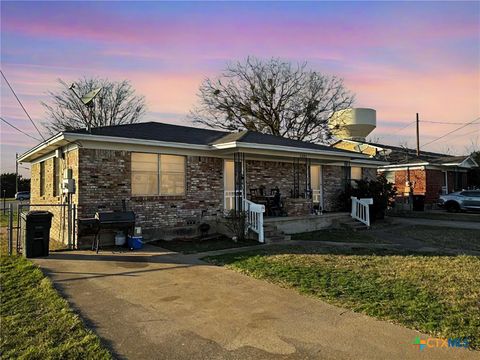
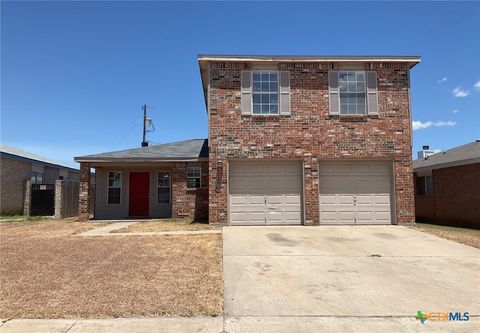
$169,900
4
bds
|
3
ba
|
1,578
sqft
|
built
1950
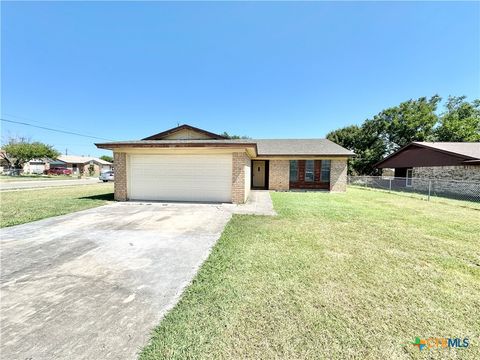
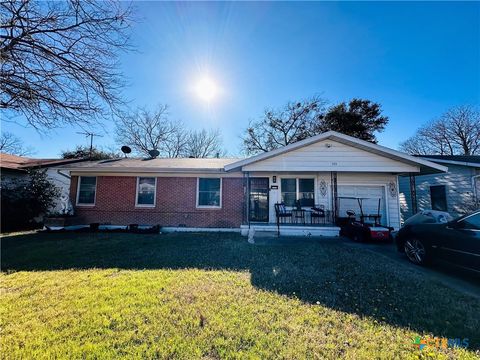
1306 Alexander St, Killeen, TX 76541
$-22
Cash flow
-0.7%
Cash-on-Cash Return
6.1%
Cap rate
0.9%
Rent to Value Ratio
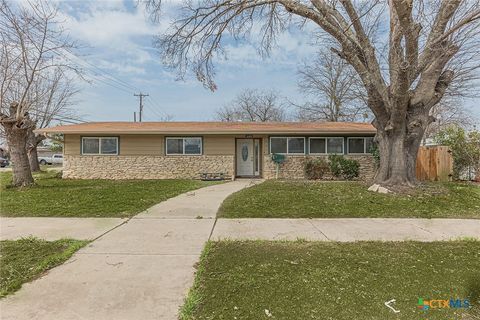
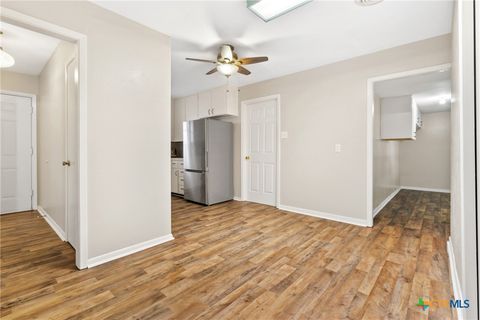
Active
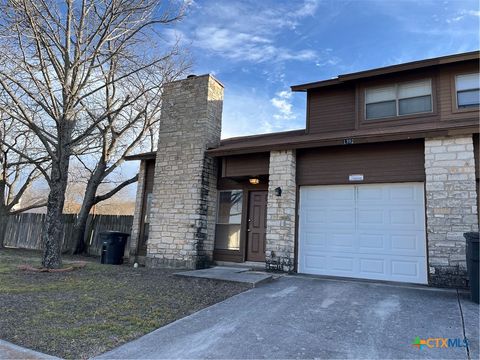
$129,900
2
bds
|
2
ba
|
1,140
sqft
|
built
1985
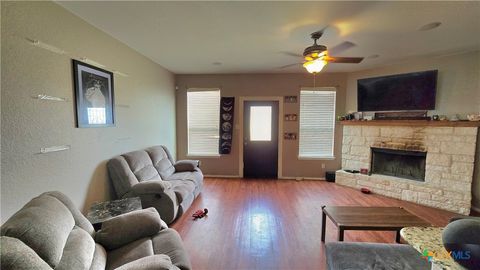
1302 Royal Crest Dr, Killeen, TX 76549
$-24
Cash flow
-1.0%
Cash-on-Cash Return
6.0%
Cap rate
0.9%
Rent to Value Ratio
622 out of 771 properties for sale in Killeen, TX
Limited Results Shown
Create a free account, or log in to reveal all property listings and enjoy the complete experience.
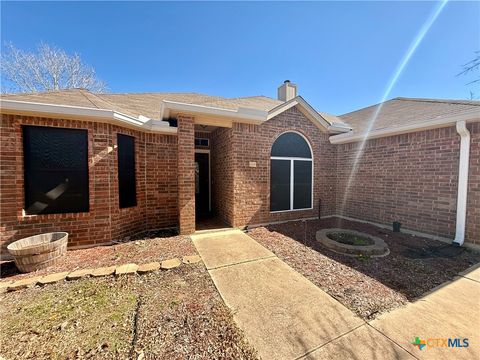
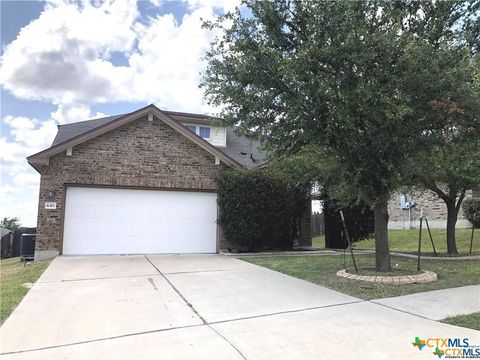
Active
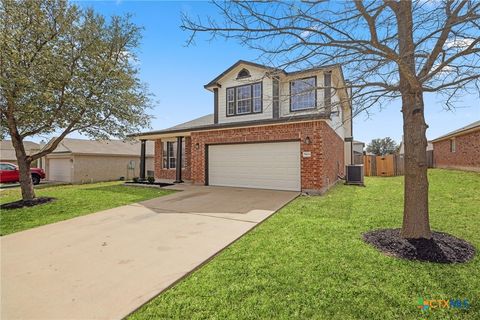
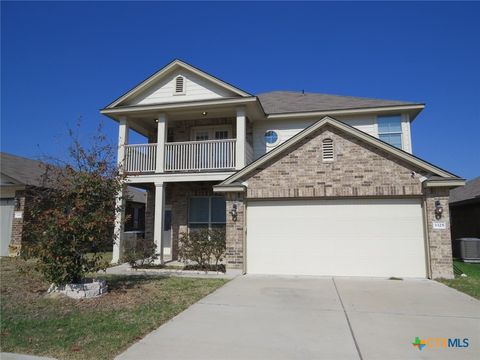
$294,900
4
bds
|
3
ba
|
2,058
sqft
|
built
2006
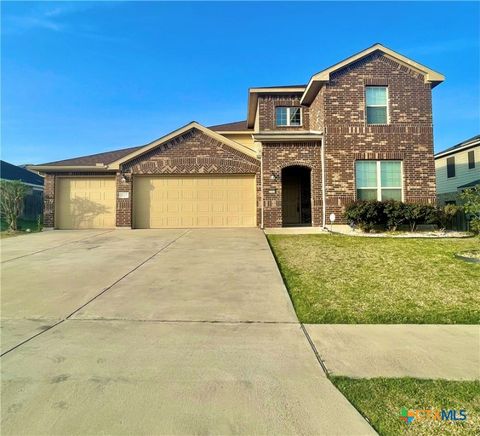
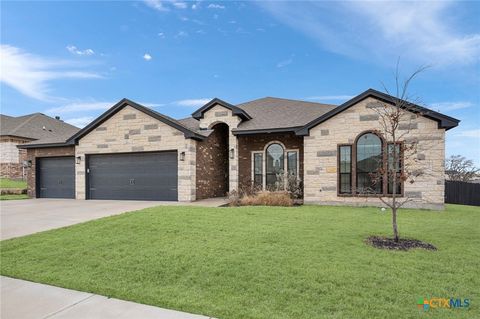
5804 Drystone Ln, Killeen, TX 76542
$-749
Cash flow
-13.3%
Cash-on-Cash Return
3.2%
Cap rate
0.6%
Rent to Value Ratio
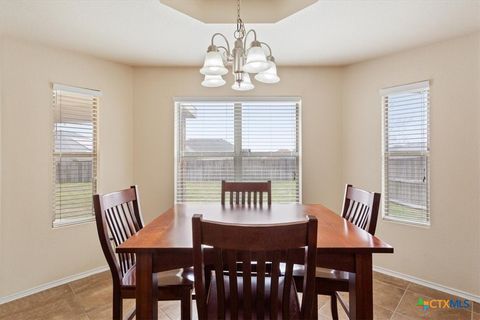
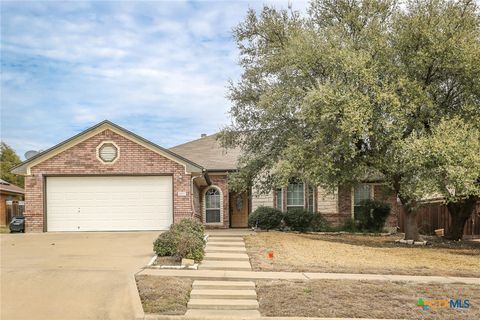
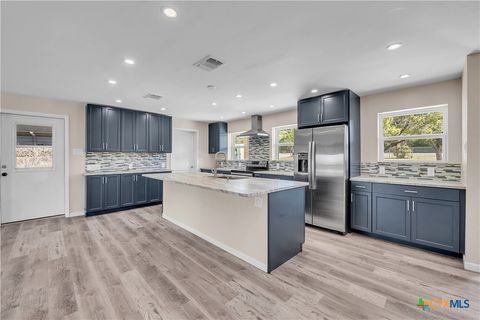
Active
$289,000
3
bds
|
2
ba
|
2,130
sqft
|
built
2009
404 Curtis Dr, Killeen, TX 76542
$-794
Cash flow
-14.3%
Cash-on-Cash Return
3.0%
Cap rate
0.6%
Rent to Value Ratio
Active
$114,900
bds
|
0
ba
|
1,100
sqft
|
built
1969
1501 Bundrant Dr, Killeen, TX 76543
$-186
Cash flow
-8.4%
Cash-on-Cash Return
4.3%
Cap rate
0.5%
Rent to Value Ratio
Active
$292,000
4
bds
|
2
ba
|
2,350
sqft
|
built
1963
1129 Chippendale Dr, Killeen, TX 76549
$-567
Cash flow
-10.1%
Cash-on-Cash Return
3.9%
Cap rate
0.7%
Rent to Value Ratio
Active
$251,469
3
bds
|
2
ba
|
2,121
sqft
|
built
2006
1902 Prestige Loop, Killeen, TX 76549
$-477
Cash flow
-9.9%
Cash-on-Cash Return
4.0%
Cap rate
0.7%
Rent to Value Ratio
Active
$325,000
4
bds
|
2
ba
|
2,140
sqft
|
built
2008
4812 Hammerstone Trl, Killeen, TX 76542
$-909
Cash flow
-14.6%
Cash-on-Cash Return
2.9%
Cap rate
0.6%
Rent to Value Ratio
Active
$240,000
4
bds
|
2
ba
|
1,878
sqft
|
built
2016
5004 Imperial Eagle, Killeen, TX 76549
$-430
Cash flow
-9.3%
Cash-on-Cash Return
4.1%
Cap rate
0.8%
Rent to Value Ratio

Active
$150,000
3
bds
|
2
ba
|
1,047
sqft
|
built
1964
1510 Meadow Dr, Killeen, TX 76549
$-93
Cash flow
-3.2%
Cash-on-Cash Return
5.5%
Cap rate
0.7%
Rent to Value Ratio
Active
$180,000
3
bds
|
2
ba
|
1,110
sqft
|
built
1996
2103 Caprice Dr, Killeen, TX 76543
$-215
Cash flow
-6.2%
Cash-on-Cash Return
4.8%
Cap rate
0.8%
Rent to Value Ratio
Active
$192,500
3
bds
|
2
ba
|
1,637
sqft
|
built
1963
1302 Cedar Dr, Killeen, TX 76543
$-231
Cash flow
-6.3%
Cash-on-Cash Return
4.8%
Cap rate
0.8%
Rent to Value Ratio
Active
$300,000
3
bds
|
3
ba
|
2,629
sqft
|
built
2004
1907 Schorn Dr, Killeen, TX 76542
$-633
Cash flow
-11.0%
Cash-on-Cash Return
3.7%
Cap rate
0.7%
Rent to Value Ratio
Active
$249,900
3
bds
|
3
ba
|
2,010
sqft
|
built
2007
4502 Causeway Ct, Killeen, TX 76549
$-63
Cash flow
-1.3%
Cash-on-Cash Return
6.0%
Cap rate
0.7%
Rent to Value Ratio
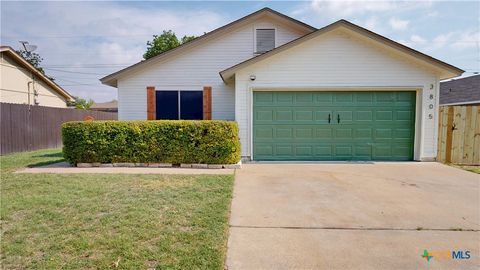
Active
$185,000
3
bds
|
2
ba
|
1,185
sqft
|
built
1986
3805 Daniels Dr, Killeen, TX 76543
$-310
Cash flow
-8.7%
Cash-on-Cash Return
4.3%
Cap rate
0.8%
Rent to Value Ratio
Active
$195,000
3
bds
|
2
ba
|
1,629
sqft
|
built
1978
1700 Hooten St, Killeen, TX 76543
$-228
Cash flow
-6.1%
Cash-on-Cash Return
4.9%
Cap rate
0.8%
Rent to Value Ratio
Active
$255,900
3
bds
|
2
ba
|
1,914
sqft
|
built
2011
3401 Cricklewood Dr, Killeen, TX 76542
$-573
Cash flow
-11.7%
Cash-on-Cash Return
3.6%
Cap rate
0.7%
Rent to Value Ratio
Active
$168,000
3
bds
|
2
ba
|
1,209
sqft
|
built
1983
2101 Lamplight Dr, Killeen, TX 76543
$-187
Cash flow
-5.8%
Cash-on-Cash Return
4.9%
Cap rate
0.8%
Rent to Value Ratio
Active
$250,000
5
bds
|
3
ba
|
2,606
sqft
|
built
2010
5200 Milky Way Ave, Killeen, TX 76542
$-277
Cash flow
-5.8%
Cash-on-Cash Return
4.9%
Cap rate
0.9%
Rent to Value Ratio
Active
$163,000
3
bds
|
2
ba
|
1,344
sqft
|
built
1985
3104 Julie Ln, Killeen, TX 76549
$-292
Cash flow
-9.3%
Cash-on-Cash Return
4.1%
Cap rate
0.8%
Rent to Value Ratio
Active
$265,000
4
bds
|
3
ba
|
1,945
sqft
|
built
2018
3325 Aubree Katherine Dr, Killeen, TX 76542
$-499
Cash flow
-9.8%
Cash-on-Cash Return
4.0%
Cap rate
0.8%
Rent to Value Ratio

Active
$1,500,000
5
bds
|
6
ba
|
4,408
sqft
|
built
2017
509 Hickory Dr, Killeen, TX 76549
$-4,783
Cash flow
-16.6%
Cash-on-Cash Return
2.4%
Cap rate
0.3%
Rent to Value Ratio
Active
$262,000
3
bds
|
3
ba
|
2,181
sqft
|
built
2008
6311 Blayney Dr, Killeen, TX 76549
$-547
Cash flow
-10.9%
Cash-on-Cash Return
3.8%
Cap rate
0.7%
Rent to Value Ratio
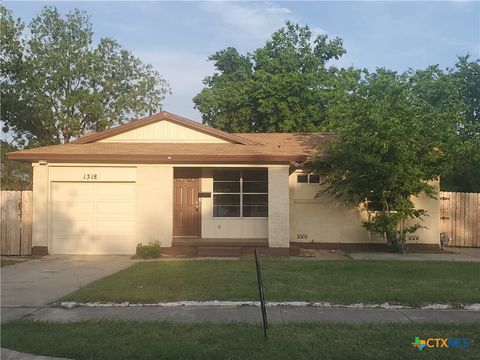
Active
$155,000
3
bds
|
1
ba
|
1,301
sqft
|
built
1965
1318 Rose Ave, Killeen, TX 76543
$-161
Cash flow
-5.4%
Cash-on-Cash Return
5.0%
Cap rate
0.8%
Rent to Value Ratio
Active
$129,900
2
bds
|
2
ba
|
1,140
sqft
|
built
1985
1302 Royal Crest Dr, Killeen, TX 76549
$-24
Cash flow
-1.0%
Cash-on-Cash Return
6.0%
Cap rate
0.9%
Rent to Value Ratio
Active
$169,900
4
bds
|
3
ba
|
1,578
sqft
|
built
1950
1306 Alexander St, Killeen, TX 76541
$-22
Cash flow
-0.7%
Cash-on-Cash Return
6.1%
Cap rate
0.9%
Rent to Value Ratio
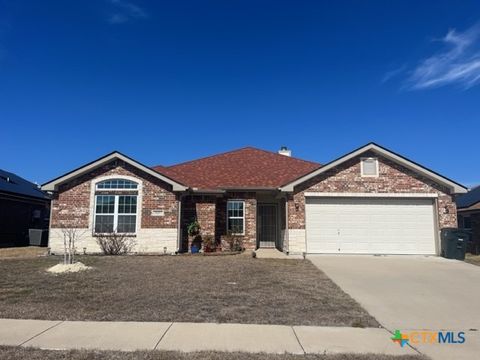
Active
$298,000
4
bds
|
2
ba
|
1,985
sqft
|
built
2013
2107 Golden Eagle Dr, Killeen, TX 76549
$-742
Cash flow
-13.0%
Cash-on-Cash Return
3.3%
Cap rate
0.6%
Rent to Value Ratio
Active
$165,000
2
bds
|
2
ba
|
1,337
sqft
|
built
1963
1402 Duvall Dr, Killeen, TX 76541
$-215
Cash flow
-6.8%
Cash-on-Cash Return
4.7%
Cap rate
0.8%
Rent to Value Ratio
Active
$373,500
4
bds
|
3
ba
|
3,223
sqft
|
built
2016
3707 Ozark Dr, Killeen, TX 76549
$-842
Cash flow
-11.8%
Cash-on-Cash Return
3.6%
Cap rate
0.7%
Rent to Value Ratio
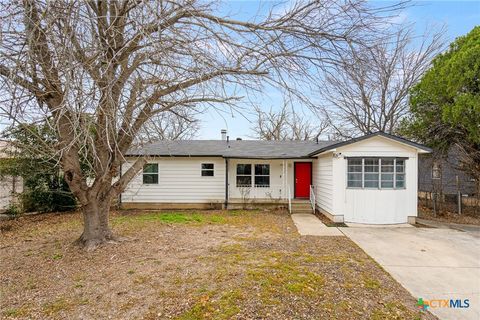
Active
$170,000
3
bds
|
1
ba
|
1,460
sqft
|
built
1962
1006 San Antonio St, Killeen, TX 76541
$-187
Cash flow
-5.7%
Cash-on-Cash Return
4.9%
Cap rate
0.8%
Rent to Value Ratio
Active
$214,900
3
bds
|
3
ba
|
1,641
sqft
|
built
2000
3805 Sunflower Dr, Killeen, TX 76542
$-447
Cash flow
-10.9%
Cash-on-Cash Return
3.8%
Cap rate
0.7%
Rent to Value Ratio
Active
$589,995
3
bds
|
3
ba
|
2,152
sqft
|
built
1986
1717 Creek Place Dr, Killeen, TX 76549
$-2,284
Cash flow
-20.2%
Cash-on-Cash Return
1.6%
Cap rate
0.3%
Rent to Value Ratio
Active
$175,000
bds
|
0
ba
|
1,500
sqft
|
built
1985
1806 Cedarhill Dr, Killeen, TX 76543
$-783
Cash flow
-23.3%
Cash-on-Cash Return
0.9%
Cap rate
0.3%
Rent to Value Ratio
Active
$240,000
5
bds
|
2
ba
|
2,016
sqft
|
built
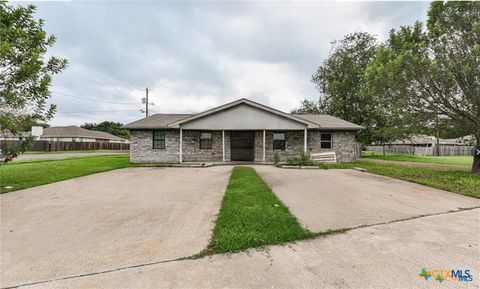
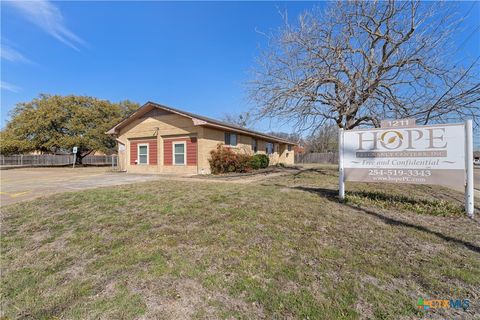
1962
1211 Florence Rd, Killeen, TX 76541
$-458
Cash flow
-10.0%
Cash-on-Cash Return
4.0%
Cap rate
0.7%
Rent to Value Ratio
Active
$240,000
4
bds
|
2
ba
|
1,617
sqft
|
built
1997
1808 Agate Dr, Killeen, TX 76549
$-514
Cash flow
-11.2%
Cash-on-Cash Return
3.7%
Cap rate
0.6%
Rent to Value Ratio
Active
$134,500
2
bds
|
1
ba
|
1,009
sqft
|
built
1983
2103 Spicewood Dr, Killeen, TX 76543
$-287
Cash flow
-11.1%
Cash-on-Cash Return
3.7%
Cap rate
0.7%
Rent to Value Ratio
Active
$399,000
4
bds
|
3
ba
|
2,291
sqft
|
built
2021
8401 Preserve Trl, Killeen, TX 76542
$-1,167
Cash flow
-15.3%
Cash-on-Cash Return
2.8%
Cap rate
0.6%
Rent to Value Ratio
Active
$287,500
3
bds
|
2
ba
|
1,831
sqft
|
built
2020
903 Mc Laury Cv, Killeen, TX 76542
$-733
Cash flow
-13.3%
Cash-on-Cash Return
3.2%
Cap rate
0.6%
Rent to Value Ratio
Active
$150,000
3
bds
|
1
ba
|
1,186
sqft
|
built
1963
503 Cardinal Ave, Killeen, TX 76541
$-255
Cash flow
-8.9%
Cash-on-Cash Return
4.2%
Cap rate
0.7%
Rent to Value Ratio
Active
$189,900
3
bds
|
2
ba
|
1,348
sqft
|
built
2000
2705 Blackburn Dr, Killeen, TX 76543
$-115
Cash flow
-3.2%
Cash-on-Cash Return
5.5%
Cap rate
0.8%
Rent to Value Ratio
Active
$229,000
4
bds
|
3
ba
|
1,896
sqft
|
built
1980
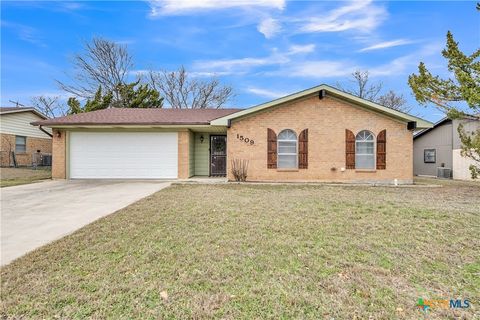
1509 Arkansas Ave, Killeen, TX 76541
$-597
Cash flow
-13.6%
Cash-on-Cash Return
3.1%
Cap rate
0.6%
Rent to Value Ratio
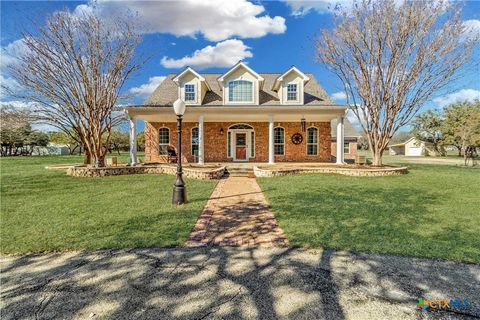
Active
$859,900
4
bds
|
4
ba
|
2,934
sqft
|
built
1997
375 Amber Jill Cv, Killeen, TX 76549
$-2,975
Cash flow
-18.1%
Cash-on-Cash Return
2.1%
Cap rate
0.4%
Rent to Value Ratio