Killeen, TX Investment Properties for Sale
Browse homes for sale and investment properties in Killeen, TX. Refine your search by price, property type, or more.
Best cash flowing properties in Killeen, TX
Active
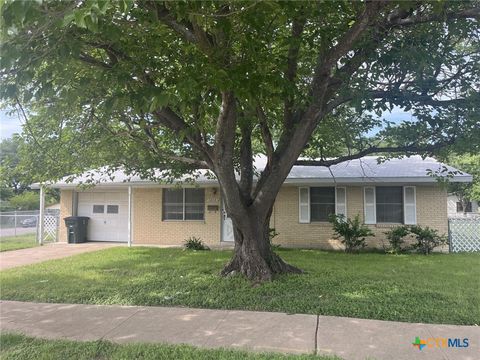
$115,000
4
bds
|
2
ba
|
1,152
sqft
|
built
1969
1313 Kathey Dr, Killeen, TX 76549
$42
Cash flow
1.9%
Cash-on-Cash Return
6.7%
Cap rate
1.1%
Rent to Value Ratio
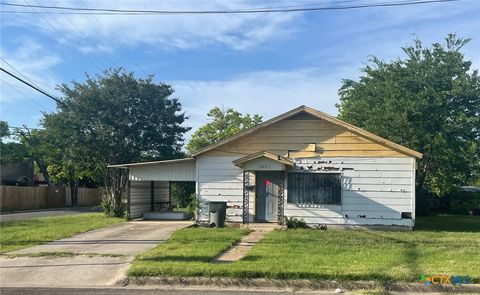
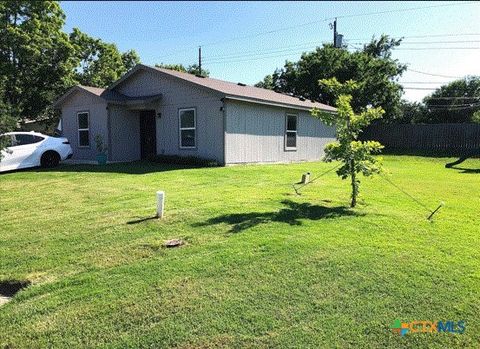
Active
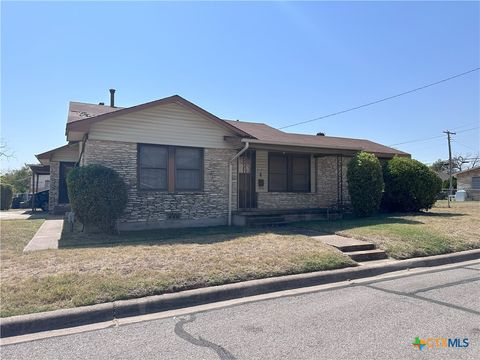
$135,000
2
bds
|
2
ba
|
1,497
sqft
|
built
1937
1014 Parmer Ave, Killeen, TX 76541
$-1
Cash flow
0.0%
Cash-on-Cash Return
6.3%
Cap rate
0.9%
Rent to Value Ratio
622 out of 771 properties for sale in Killeen, TX
Limited Results Shown
Create a free account, or log in to reveal all property listings and enjoy the complete experience.
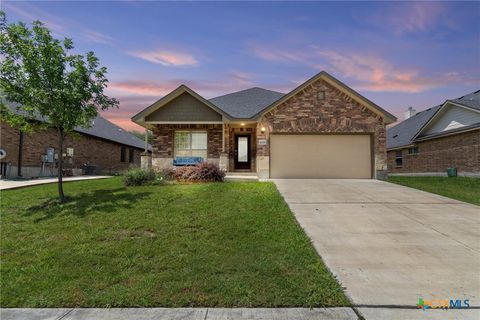
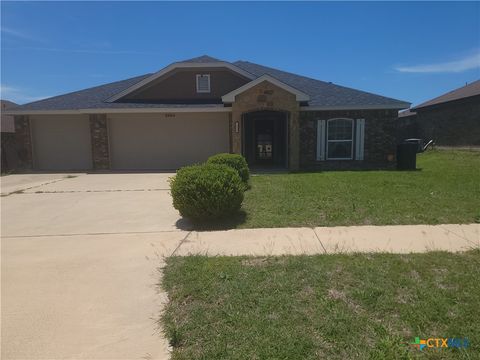
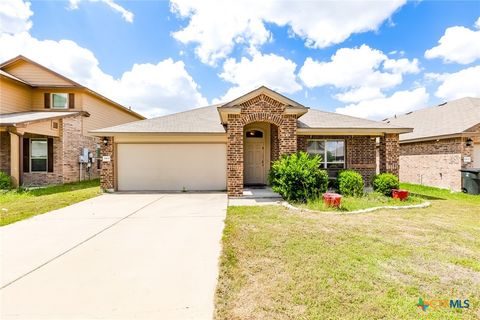
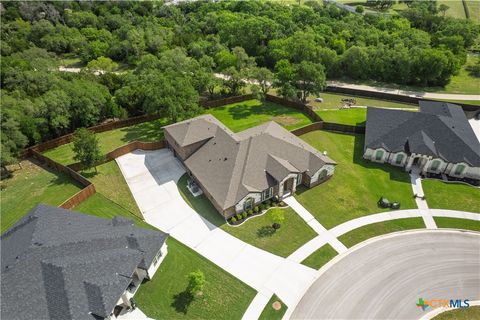
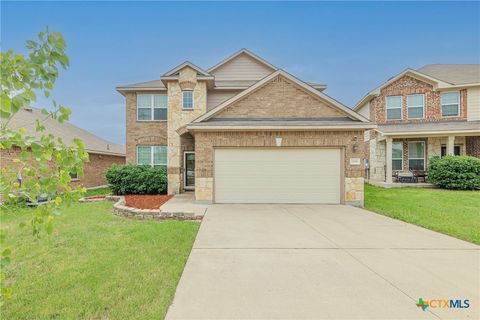
Active
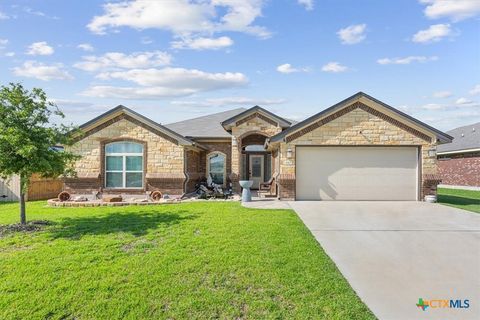
$365,000
4
bds
|
3
ba
|
2,109
sqft
|
built
2018
5907 Verde Dr, Killeen, TX 76549
$-794
Cash flow
-11.3%
Cash-on-Cash Return
3.7%
Cap rate
0.7%
Rent to Value Ratio
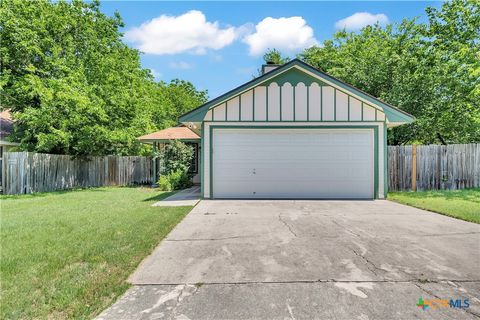
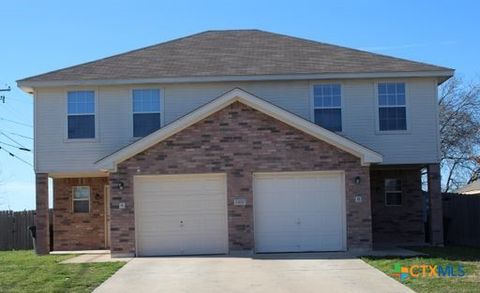
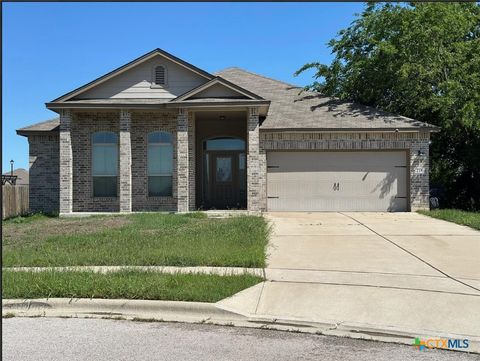
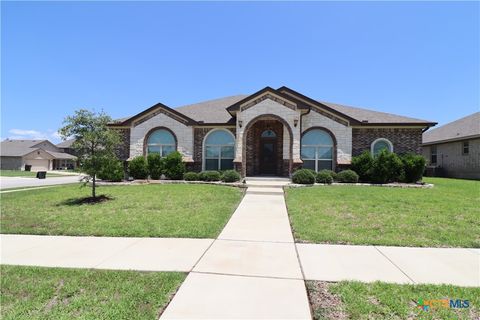
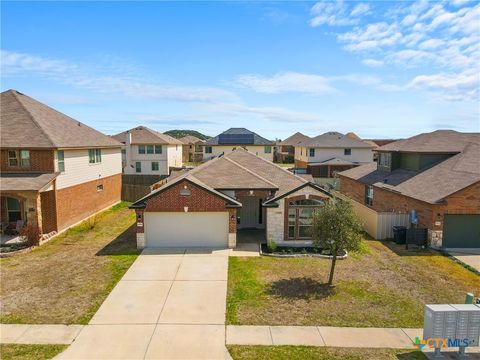
Active
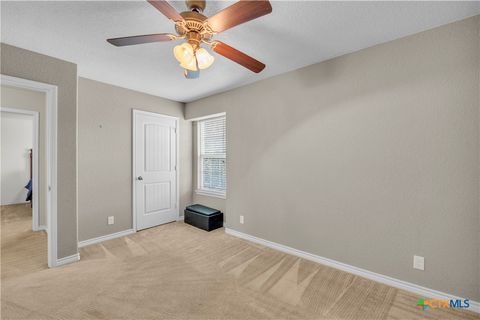
$289,999
4
bds
|
3
ba
|
2,310
sqft
|
built
2013
2506 Alamocitos Creek Dr, Killeen, TX 76549
$-594
Cash flow
-10.7%
Cash-on-Cash Return
3.8%
Cap rate
0.7%
Rent to Value Ratio
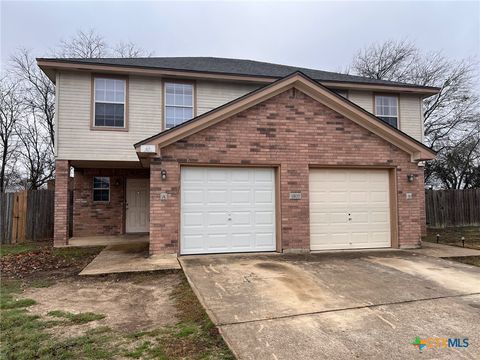
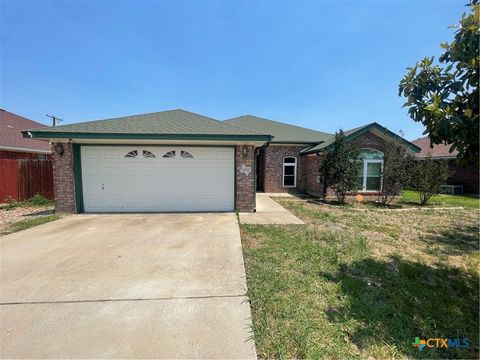
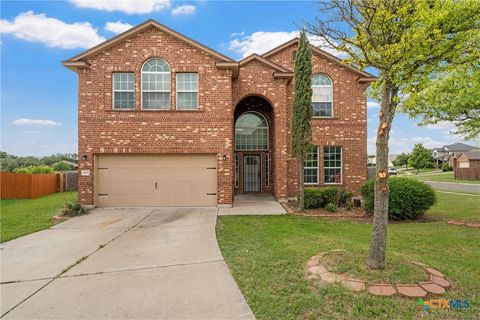
Active
$349,400
4
bds
|
3
ba
|
2,543
sqft
|
built
2017
6203 Morganite Ln, Killeen, TX 76542
$-891
Cash flow
-13.3%
Cash-on-Cash Return
3.2%
Cap rate
0.6%
Rent to Value Ratio

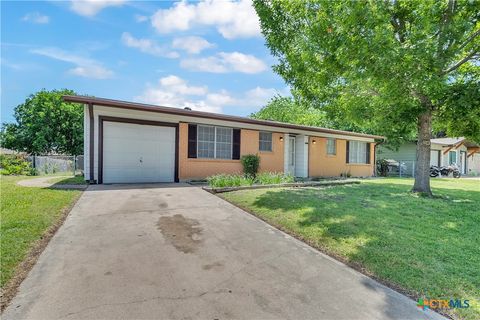
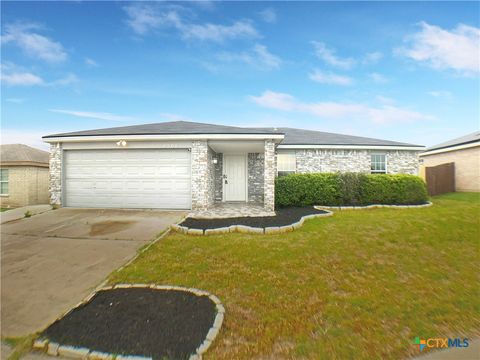
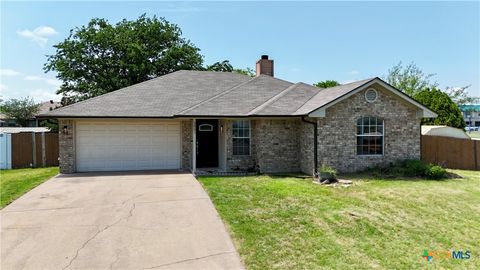
Active
$192,500
3
bds
|
3
ba
|
1,349
sqft
|
built
1992
2707 Tripp Trl, Killeen, TX 76543
$-353
Cash flow
-9.6%
Cash-on-Cash Return
4.1%
Cap rate
0.7%
Rent to Value Ratio
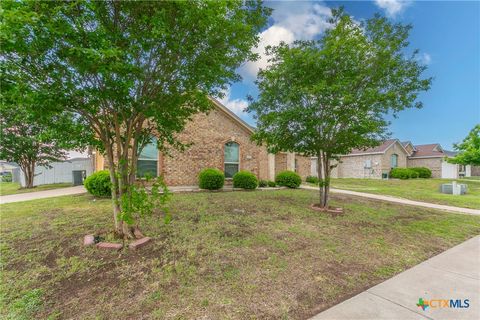
Active
$147,500
2
bds
|
1
ba
|
936
sqft
|
built
1985
3701 Trotwood Trl, Killeen, TX 76543
$-211
Cash flow
-7.5%
Cash-on-Cash Return
4.5%
Cap rate
0.8%
Rent to Value Ratio
Active
$150,000
3
bds
|
1
ba
|
1,040
sqft
|
built
1963
1210 Ridgemont Dr, Killeen, TX 76549
$-321
Cash flow
-11.2%
Cash-on-Cash Return
3.7%
Cap rate
0.7%
Rent to Value Ratio
Active
$295,000
bds
|
0
ba
|
2,221
sqft
|
built
2007
1402 Chips, Killeen, TX 76549
$-1,280
Cash flow
-22.6%
Cash-on-Cash Return
1.1%
Cap rate
0.4%
Rent to Value Ratio
Active
$115,000
4
bds
|
2
ba
|
1,152
sqft
|
built
1969
1313 Kathey Dr, Killeen, TX 76549
$42
Cash flow
1.9%
Cash-on-Cash Return
6.7%
Cap rate
1.1%
Rent to Value Ratio
Active
$305,000
4
bds
|
3
ba
|
2,228
sqft
|
built
2013
2604 Alamocitos Creek Dr, Killeen, TX 76549
$-675
Cash flow
-11.5%
Cash-on-Cash Return
3.6%
Cap rate
0.7%
Rent to Value Ratio

Active
$249,900
4
bds
|
2
ba
|
1,640
sqft
|
built
2007
3705 Armstrong County Ct, Killeen, TX 76549
$-452
Cash flow
-9.4%
Cash-on-Cash Return
4.1%
Cap rate
0.7%
Rent to Value Ratio

Active
$295,000
bds
|
0
ba
|
2,221
sqft
|
built
2007
1401 Chips, Killeen, TX 76549
$-1,280
Cash flow
-22.6%
Cash-on-Cash Return
1.1%
Cap rate
0.4%
Rent to Value Ratio
Active
$150,000
4
bds
|
3
ba
|
2,148
sqft
|
built
1954
207 W Anderson Ave, Killeen, TX 76541
$-429
Cash flow
-14.9%
Cash-on-Cash Return
2.8%
Cap rate
0.6%
Rent to Value Ratio
Active
$295,000
bds
|
0
ba
|
2,221
sqft
|
built
2007
1300 Chips, Killeen, TX 76549
$-1,280
Cash flow
-22.6%
Cash-on-Cash Return
1.1%
Cap rate
0.4%
Rent to Value Ratio
Active
$234,000
3
bds
|
2
ba
|
1,710
sqft
|
built
2003
4300 Pennington Ave, Killeen, TX 76549
$-439
Cash flow
-9.8%
Cash-on-Cash Return
4.0%
Cap rate
0.7%
Rent to Value Ratio

Active
$265,000
3
bds
|
2
ba
|
1,965
sqft
|
built
2004
2903 Phoenix Dr, Killeen, TX 76543
$-589
Cash flow
-11.6%
Cash-on-Cash Return
3.6%
Cap rate
0.7%
Rent to Value Ratio

Active
$196,500
3
bds
|
2
ba
|
1,491
sqft
|
built
1995
2703 Casey Dr, Killeen, TX 76543
$-179
Cash flow
-4.8%
Cash-on-Cash Return
5.2%
Cap rate
0.9%
Rent to Value Ratio
Active
$135,000
2
bds
|
2
ba
|
1,497
sqft
|
built
1937
1014 Parmer Ave, Killeen, TX 76541
$-1
Cash flow
0.0%
Cash-on-Cash Return
6.3%
Cap rate
0.9%
Rent to Value Ratio

Active
$186,000
3
bds
|
2
ba
|
1,184
sqft
|
built
1972
1008 Ronstan Dr, Killeen, TX 76542
$-361
Cash flow
-10.1%
Cash-on-Cash Return
3.9%
Cap rate
0.6%
Rent to Value Ratio

Active
$220,000
4
bds
|
2
ba
|
1,636
sqft
|
built
2001
4409 Beach Ball Dr, Killeen, TX 76549
$-336
Cash flow
-8.0%
Cash-on-Cash Return
4.4%
Cap rate
0.7%
Rent to Value Ratio

Active
$184,999
3
bds
|
2
ba
|
1,164
sqft
|
built
1997
4701 Ridgehaven Dr, Killeen, TX 76543
$-350
Cash flow
-9.9%
Cash-on-Cash Return
4.0%
Cap rate
0.7%
Rent to Value Ratio

Active
$250,000
4
bds
|
2
ba
|
1,666
sqft
|
built
2009
3704 Dewitt County Ct, Killeen, TX 76549
$-469
Cash flow
-9.8%
Cash-on-Cash Return
4.0%
Cap rate
0.7%
Rent to Value Ratio
Active
$239,999
3
bds
|
2
ba
|
1,785
sqft
|
built
2017
5402 Waterbank Ln, Killeen, TX 76543
$-556
Cash flow
-12.1%
Cash-on-Cash Return
3.5%
Cap rate
0.7%
Rent to Value Ratio
Active
$199,000
3
bds
|
2
ba
|
1,092
sqft
|
built
2022
1305 Meadow Dr, Killeen, TX 76549
$-239
Cash flow
-6.3%
Cash-on-Cash Return
4.8%
Cap rate
0.8%
Rent to Value Ratio
Active
$190,000
3
bds
|
2
ba
|
1,310
sqft
|
built
1992
2504 Pixton Dr, Killeen, TX 76543
$-339
Cash flow
-9.3%
Cash-on-Cash Return
4.1%
Cap rate
0.7%
Rent to Value Ratio
Active
$294,000
3
bds
|
3
ba
|
2,210
sqft
|
built
2018
215 Danielle Dr, Killeen, TX 76542
$-645
Cash flow
-11.4%
Cash-on-Cash Return
3.6%
Cap rate
0.7%
Rent to Value Ratio

Active
$225,000
3
bds
|
2
ba
|
1,539
sqft
|
built
1989
2804 Bluejay Dr, Killeen, TX 76549
$-319
Cash flow
-7.4%
Cash-on-Cash Return
4.6%
Cap rate
0.8%
Rent to Value Ratio
Active
$684,950
4
bds
|
4
ba
|
3,187
sqft
|
built
2022
7623 Palladium Loop, Killeen, TX 76542
$-2,762
Cash flow
-21.0%
Cash-on-Cash Return
0.8%
Cap rate
0.3%
Rent to Value Ratio
Active
$410,000
4
bds
|
3
ba
|
2,404
sqft
|
built
2019
5000 Pinar Trl, Killeen, TX 76549
$-879
Cash flow
-11.2%
Cash-on-Cash Return
3.1%
Cap rate
0.6%
Rent to Value Ratio
Active
$214,000
4
bds
|
2
ba
|
1,556
sqft
|
built
2005
4506 Janelle Dr, Killeen, TX 76549
$-256
Cash flow
-6.2%
Cash-on-Cash Return
4.2%
Cap rate
0.7%
Rent to Value Ratio
Active
$362,900
5
bds
|
3
ba
|
3,262
sqft
|
built
2010
5501 Southern Belle Dr, Killeen, TX 76542
$-308
Cash flow
-4.4%
Cash-on-Cash Return
5.2%
Cap rate
0.6%
Rent to Value Ratio
Active
$322,500
4
bds
|
3
ba
|
2,933
sqft
|
built
2012
3306 Rusack Dr, Killeen, TX 76542
$-585
Cash flow
-9.5%
Cash-on-Cash Return
3.5%
Cap rate
0.7%
Rent to Value Ratio
Active
$259,000
4
bds
|
2
ba
|
1,856
sqft
|
built
2014
6500 Mustang Creek Rd, Killeen, TX 76549
$-548
Cash flow
-11.0%
Cash-on-Cash Return
3.7%
Cap rate
0.7%
Rent to Value Ratio
Active
$175,000
4
bds
|
2
ba
|
1,551
sqft
|
built
1994
3801 Tallwood Dr, Killeen, TX 76549
$-161
Cash flow
-4.8%
Cash-on-Cash Return
5.2%
Cap rate
0.9%
Rent to Value Ratio
Active
$245,000
4
bds
|
2
ba
|
1,700
sqft
|
built
2011
1200 Vanguard Ln, Killeen, TX 76549
$-449
Cash flow
-9.6%
Cash-on-Cash Return
4.1%
Cap rate
0.7%
Rent to Value Ratio

Active
$194,500
3
bds
|
2
ba
|
1,272
sqft
|
built
1993
4108 Pepper Mill Holw, Killeen, TX 76542
$-144
Cash flow
-3.9%
Cash-on-Cash Return
4.8%
Cap rate
0.8%
Rent to Value Ratio
Active
$154,999
3
bds
|
2
ba
|
1,730
sqft
|
built
1970
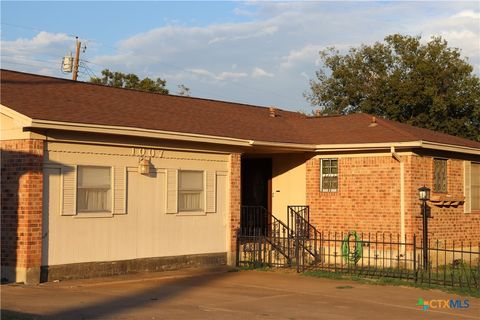
1007 Illinois Ave, Killeen, TX 76541
$-173
Cash flow
-5.8%
Cash-on-Cash Return
4.9%
Cap rate
0.8%
Rent to Value Ratio
Active
$260,000
4
bds
|
2
ba
|
1,865
sqft
|
built
2016
7202 Bose Ikard Dr, Killeen, TX 76549
$-553
Cash flow
-11.1%
Cash-on-Cash Return
3.7%
Cap rate
0.7%
Rent to Value Ratio
Active
$118,000
3
bds
|
1
ba
|
1,044
sqft
|
built
1953
1601 White Ave, Killeen, TX 76541
$-82
Cash flow
-3.6%
Cash-on-Cash Return
5.4%
Cap rate
0.8%
Rent to Value Ratio
Active
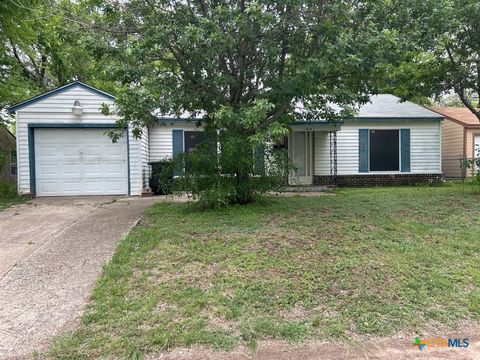
$190,000
3
bds
|
2
ba
|
1,168
sqft
|
built
1986
3207 Honeysuckle Dr, Killeen, TX 76542
$-267
Cash flow
-7.3%
Cash-on-Cash Return
4.6%
Cap rate
0.7%
Rent to Value Ratio
Active
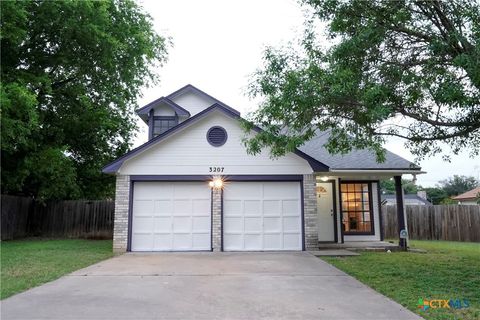
$259,950
4
bds
|
2
ba
|
1,981
sqft
|
built
2013
2100 Golden Eagle Dr, Killeen, TX 76549
$-628
Cash flow
-12.6%
Cash-on-Cash Return
3.4%
Cap rate
0.6%
Rent to Value Ratio