East Baton Rouge Parish County Investment Properties for Sale
Browse homes for sale and investment properties in East Baton Rouge Parish County. Refine your search by price, property type, or more.
Best cash flowing properties in East Baton Rouge Parish County
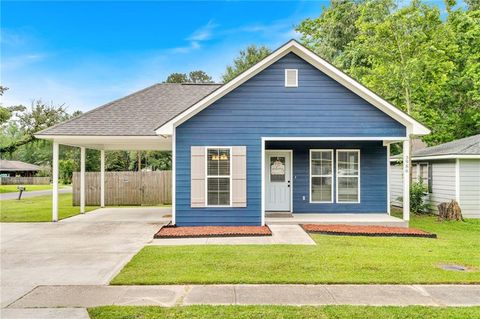
Active
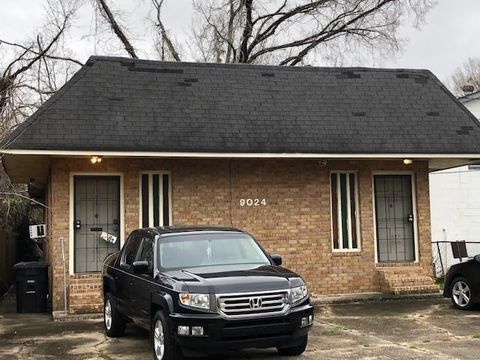
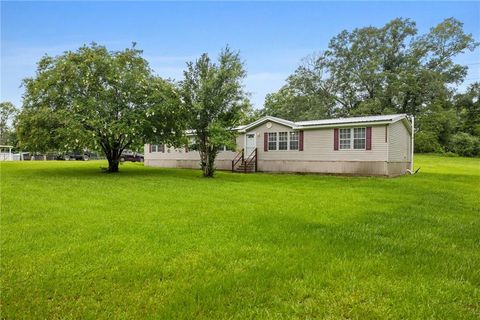
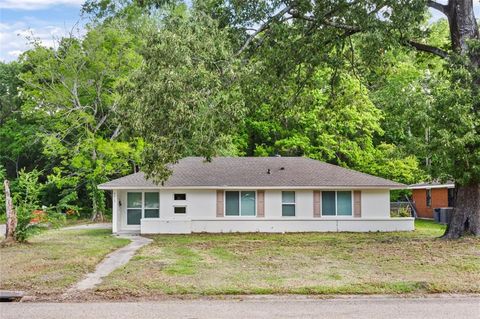
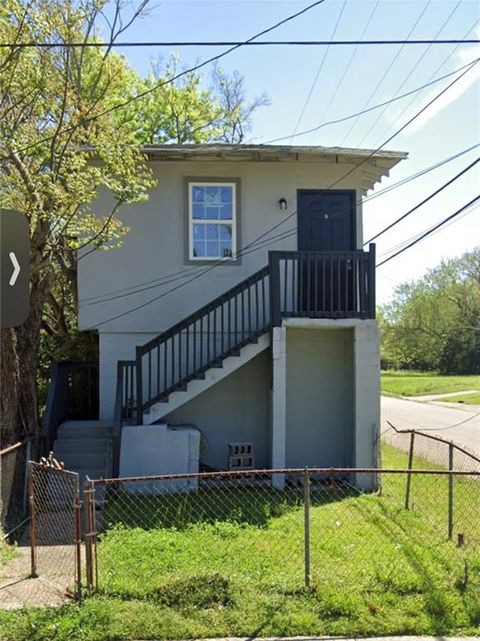
$34,500
3
bds
|
2
ba
|
1,624
sqft
|
built
1982
9024 Scenic Hwy, Baton Rouge, LA 70807
$759
Cash flow
25.6%
Cash-on-Cash Return
26.4%
Cap rate
3.2%
Rent to Value Ratio
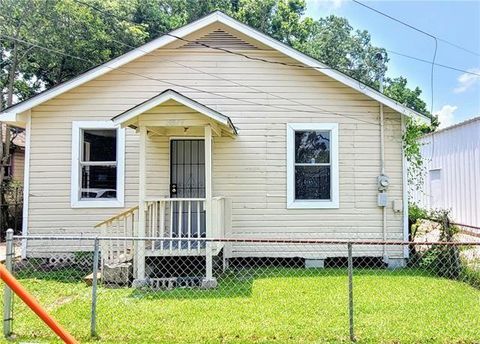
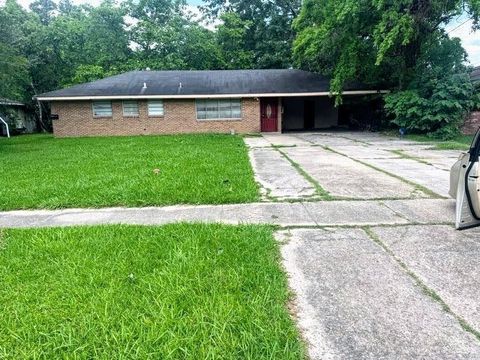
Active
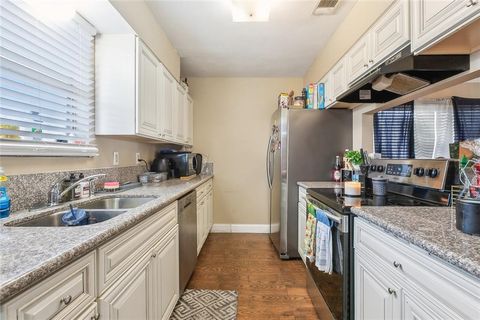
$69,000
3
bds
|
1
ba
|
884
sqft
|
built
1988
3877 Keokuk St, Baton Rouge, LA 70805
$690
Cash flow
11.7%
Cash-on-Cash Return
12.0%
Cap rate
1.4%
Rent to Value Ratio
936 out of 943 properties for sale in East Baton Rouge Parish County
Limited Results Shown
Create a free account, or log in to reveal all property listings and enjoy the complete experience.
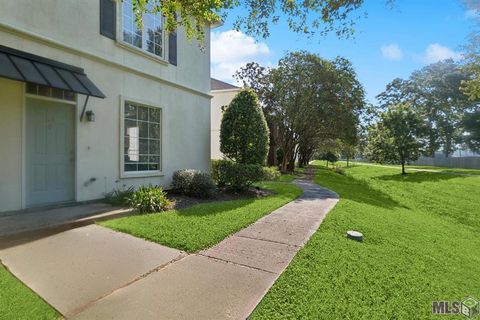
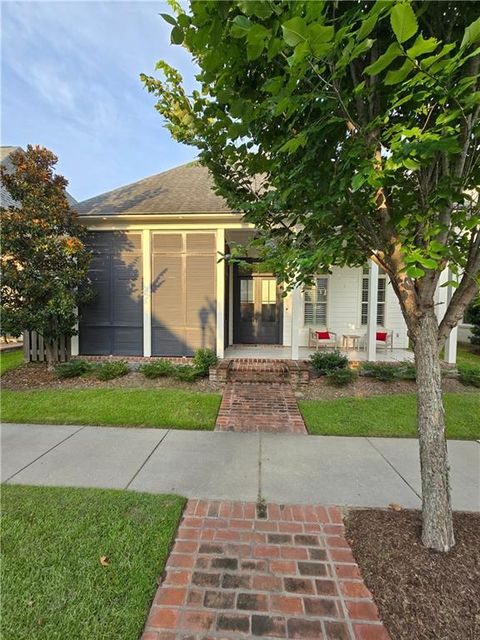
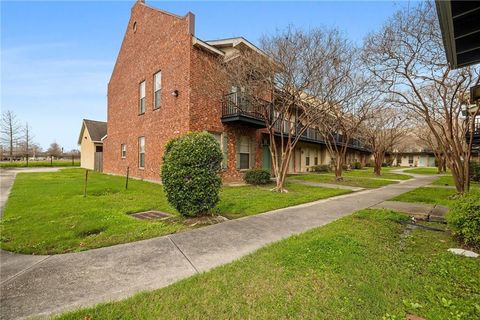
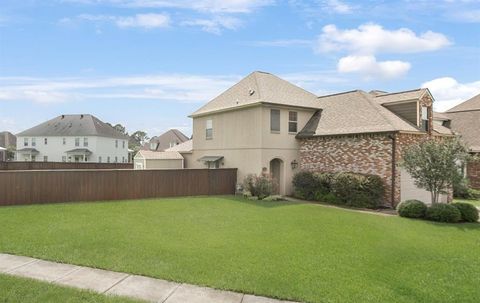
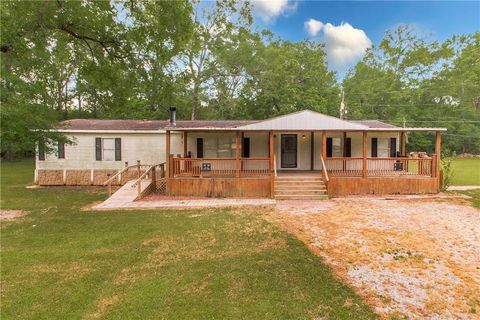
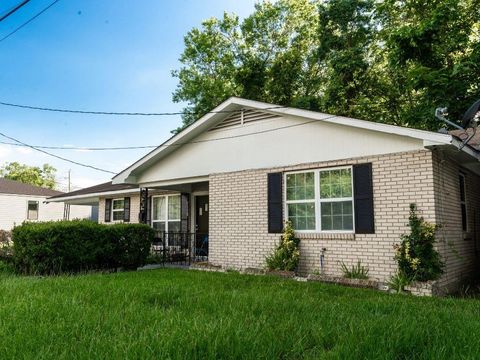
Active
$185,000
2
bds
|
3
ba
|
1,310
sqft
|
built
2006
4000 Lake Beau Pre Blvd, Baton Rouge, LA 70820
$-197
Cash flow
-5.6%
Cash-on-Cash Return
4.4%
Cap rate
0.8%
Rent to Value Ratio
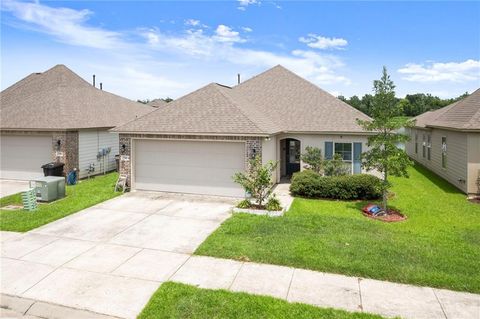
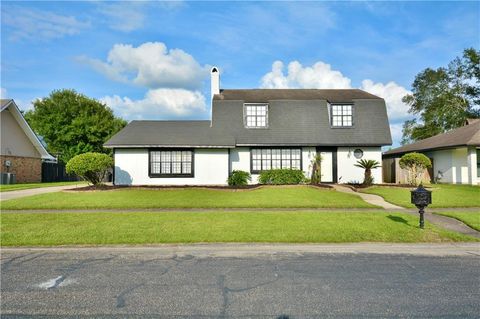
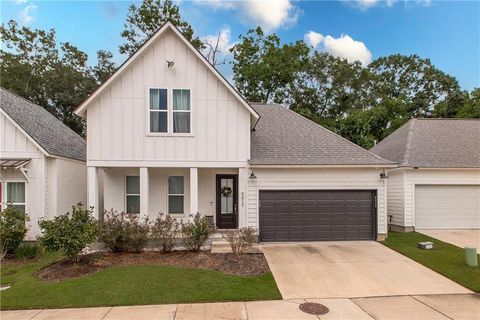
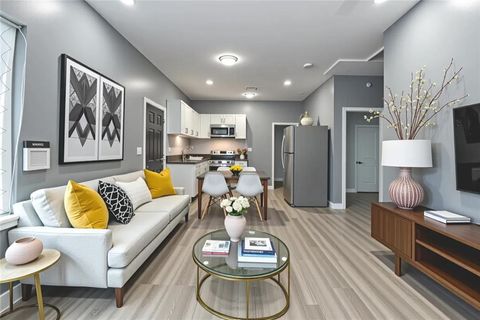
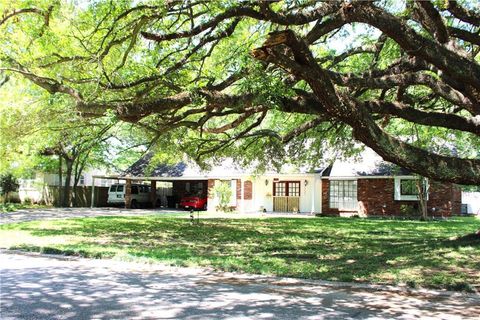
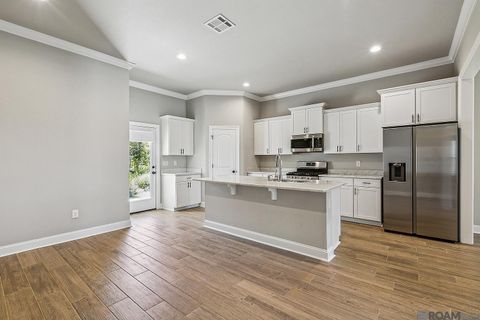
Active
$329,500
3
bds
|
3
ba
|
1,653
sqft
|
built
2018
7741 W Pelican Lakes Ave, Baton Rouge, LA 70820
$-434
Cash flow
-6.9%
Cash-on-Cash Return
4.1%
Cap rate
0.5%
Rent to Value Ratio
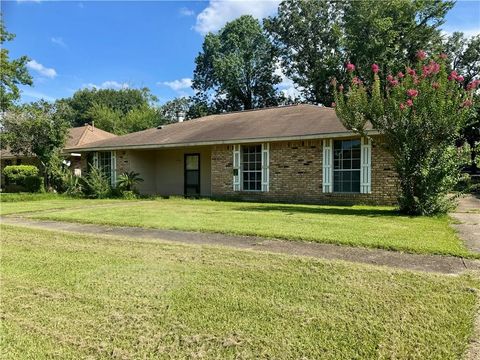
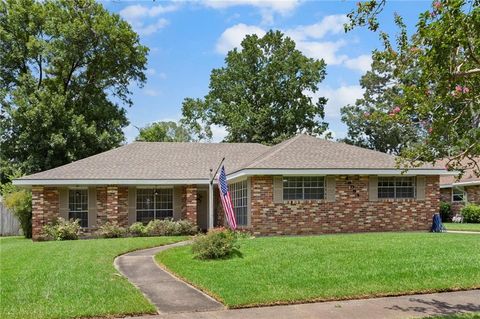
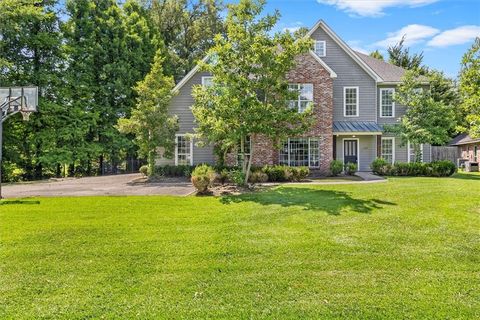
Active
$215,000
3
bds
|
2
ba
|
1,351
sqft
|
built
2020
3986 Main St, Zachary, LA 70791
$-120
Cash flow
-2.9%
Cash-on-Cash Return
5.0%
Cap rate
0.6%
Rent to Value Ratio
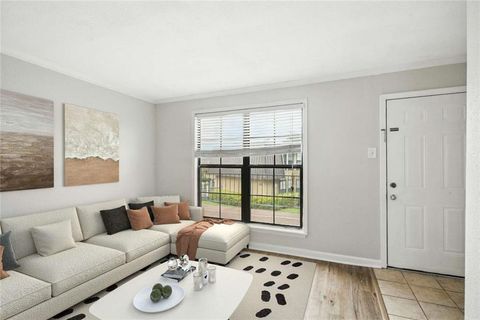
Active
$580,000
3
bds
|
3
ba
|
2,273
sqft
|
built
2017
10723 Turning Leaf Dr, Baton Rouge, LA 70810
$-662
Cash flow
-6.0%
Cash-on-Cash Return
4.3%
Cap rate
0.6%
Rent to Value Ratio
Active
$279,997
3
bds
|
2
ba
|
1,865
sqft
|
built
1995
3718 Redlands Dr, Baton Rouge, LA 70814
$-83
Cash flow
-1.5%
Cash-on-Cash Return
5.3%
Cap rate
0.6%
Rent to Value Ratio
Active
$194,900
3
bds
|
2
ba
|
1,510
sqft
|
built
1973
14412 Sweet Gum Ave, Baton Rouge, LA 70816
$182
Cash flow
4.9%
Cash-on-Cash Return
6.8%
Cap rate
0.8%
Rent to Value Ratio
Active
$185,000
3
bds
|
3
ba
|
1,449
sqft
|
built
2006
10600 Lakes Blvd, Baton Rouge, LA 70810
$229
Cash flow
6.5%
Cash-on-Cash Return
7.2%
Cap rate
0.9%
Rent to Value Ratio
Active
$399,900
4
bds
|
3
ba
|
2,342
sqft
|
built
2019
9017 Stonecroft Ave, Baton Rouge, LA 70810
$-10
Cash flow
-0.1%
Cash-on-Cash Return
5.6%
Cap rate
0.7%
Rent to Value Ratio
Active
$244,000
4
bds
|
2
ba
|
2,073
sqft
|
built
1967
12651 Parnell Ave, Baton Rouge, LA 70815
$85
Cash flow
1.8%
Cash-on-Cash Return
6.1%
Cap rate
0.7%
Rent to Value Ratio
Active
$84,900
2
bds
|
3
ba
|
1,136
sqft
|
built
1980
10286 W Winston Ave, Baton Rouge, LA 70809
$564
Cash flow
34.7%
Cash-on-Cash Return
13.7%
Cap rate
1.6%
Rent to Value Ratio
Active
$183,000
3
bds
|
2
ba
|
1,565
sqft
|
built
2007
11110 Boardwalk Dr, Baton Rouge, LA 70816
$376
Cash flow
10.7%
Cash-on-Cash Return
8.1%
Cap rate
1.0%
Rent to Value Ratio
Active
$186,000
2
bds
|
3
ba
|
1,408
sqft
|
built
2006
4000 Lake Beau Pre Blvd, Baton Rouge, LA 70820
$-133
Cash flow
-3.7%
Cash-on-Cash Return
4.8%
Cap rate
0.9%
Rent to Value Ratio
Active
$129,000
2
bds
|
2
ba
|
1,100
sqft
|
built
2008
818 Meadow Bend Dr, Baton Rouge, LA 70820
$287
Cash flow
11.6%
Cash-on-Cash Return
8.3%
Cap rate
1.0%
Rent to Value Ratio
Active
$500,000
4
bds
|
4
ba
|
2,327
sqft
|
built
2004
921 Carriage Way, Baton Rouge, LA 70808
$-94
Cash flow
-1.0%
Cash-on-Cash Return
5.5%
Cap rate
0.7%
Rent to Value Ratio
Active
$178,000
4
bds
|
2
ba
|
2,110
sqft
|
built
2007
24483 Riley Rd, Pride, LA 70770
$0
Cash flow
n/a
Cash-on-Cash Return
n/a
Cap rate
n/a
Rent to Value Ratio
Active
$399,500
4
bds
|
3
ba
|
2,374
sqft
|
built
2013
15314 Mistybrook Dr, Baton Rouge, LA 70816
$-110
Cash flow
-1.4%
Cash-on-Cash Return
5.3%
Cap rate
0.7%
Rent to Value Ratio
Active
$140,000
3
bds
|
2
ba
|
1,200
sqft
|
built
1970
272 W Harrison St, Baton Rouge, LA 70802
$234
Cash flow
8.7%
Cash-on-Cash Return
7.7%
Cap rate
0.9%
Rent to Value Ratio
Active
$650,000
4
bds
|
4
ba
|
3,149
sqft
|
built
1993
647 Highland Oaks Dr, Baton Rouge, LA 70810
$-686
Cash flow
-5.5%
Cash-on-Cash Return
4.4%
Cap rate
0.5%
Rent to Value Ratio
Active
$275,000
4
bds
|
2
ba
|
1,633
sqft
|
built
2006
3346 Southlake Ave, Baton Rouge, LA 70810
$37
Cash flow
0.7%
Cash-on-Cash Return
5.8%
Cap rate
0.7%
Rent to Value Ratio
Active
$193,500
3
bds
|
2
ba
|
1,554
sqft
|
built
2004
4441 Burbank Dr, Baton Rouge, LA 70820
$188
Cash flow
5.1%
Cash-on-Cash Return
6.8%
Cap rate
0.8%
Rent to Value Ratio
Active
$164,999
2
bds
|
2
ba
|
1,221
sqft
|
built
1999
710 E Boyd Dr, Baton Rouge, LA 70808
$185
Cash flow
5.8%
Cash-on-Cash Return
7.0%
Cap rate
0.8%
Rent to Value Ratio
Active
$195,000
3
bds
|
2
ba
|
1,656
sqft
|
built
1970
8554 S Essen Heights Ct, Baton Rouge, LA 70809
$388
Cash flow
10.4%
Cash-on-Cash Return
8.1%
Cap rate
1.0%
Rent to Value Ratio
Active
$182,500
3
bds
|
2
ba
|
1,270
sqft
|
built
1957
6815 Calumet St, Baton Rouge, LA 70805
$-174
Cash flow
-5.0%
Cash-on-Cash Return
4.5%
Cap rate
0.5%
Rent to Value Ratio
Active
$120,000
3
bds
|
2
ba
|
1,116
sqft
|
built
1967
3076 Elgin St, Baton Rouge, LA 70805
$329
Cash flow
14.3%
Cash-on-Cash Return
9.0%
Cap rate
1.1%
Rent to Value Ratio
Active
$179,900
3
bds
|
2
ba
|
1,872
sqft
|
built
2012
14822 Woodrow Kerr Ln, Zachary, LA 70791
$-23
Cash flow
-0.7%
Cash-on-Cash Return
5.5%
Cap rate
0.7%
Rent to Value Ratio
Active
$250,000
4
bds
|
4
ba
|
2,800
sqft
|
built
1985
5525 S Afton Pkwy, Baton Rouge, LA 70806
$59
Cash flow
1.2%
Cash-on-Cash Return
6.0%
Cap rate
0.7%
Rent to Value Ratio
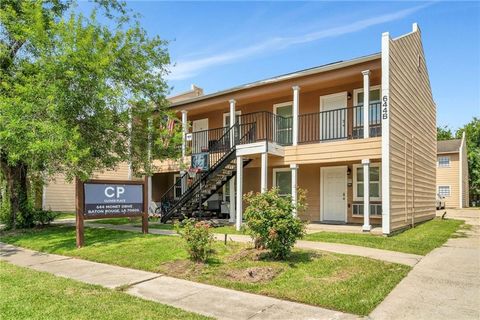
Active
$1,695,000
24
bds
|
24
ba
|
9,600
sqft
|
built
1984
644 Monet Dr, Baton Rouge, LA 70806
$-7,538
Cash flow
-23.2%
Cash-on-Cash Return
0.3%
Cap rate
0.0%
Rent to Value Ratio
Active
$189,500
3
bds
|
2
ba
|
1,748
sqft
|
built
1965
9180 Dancy Ave, Baton Rouge, LA 70814
$207
Cash flow
5.7%
Cash-on-Cash Return
7.0%
Cap rate
0.8%
Rent to Value Ratio
Active
$219,000
4
bds
|
2
ba
|
1,627
sqft
|
built
1992
11195 Shandon Dr, Greenwell Springs, LA 70739
$206
Cash flow
4.9%
Cash-on-Cash Return
6.8%
Cap rate
0.8%
Rent to Value Ratio
Active
$639,999
4
bds
|
3
ba
|
3,288
sqft
|
built
2022
17045 Burks Ave, Greenwell Springs, LA 70739
$-338
Cash flow
-2.8%
Cash-on-Cash Return
5.0%
Cap rate
0.6%
Rent to Value Ratio
Active
$220,000
4
bds
|
0
ba
|
1,703
sqft
|
built
2389 Tennessee St, Baton Rouge, LA 70802
$-75
Cash flow
-1.8%
Cash-on-Cash Return
5.3%
Cap rate
0.6%
Rent to Value Ratio
Active
$85,000
2
bds
|
3
ba
|
1,260
sqft
|
built
1992
1781 Boulevard De Province, Baton Rouge, LA 70816
$87
Cash flow
5.3%
Cash-on-Cash Return
6.9%
Cap rate
1.3%
Rent to Value Ratio
Active
$150,000
3
bds
|
2
ba
|
1,360
sqft
|
built
2024
2138 Minnesota St, Baton Rouge, LA 70802
$256
Cash flow
8.9%
Cash-on-Cash Return
7.7%
Cap rate
0.9%
Rent to Value Ratio
Active
$345,000
4
bds
|
3
ba
|
2,011
sqft
|
built
2022
10810 Maitland Ave, Baton Rouge, LA 70810
$114
Cash flow
1.7%
Cash-on-Cash Return
6.1%
Cap rate
0.8%
Rent to Value Ratio
Active
$585,000
4
bds
|
3
ba
|
2,503
sqft
|
built
1991
7530 Old Sturbridge Ln, Baton Rouge, LA 70806
$-1,572
Cash flow
-14.0%
Cash-on-Cash Return
2.5%
Cap rate
0.3%
Rent to Value Ratio
Active
$210,000
4
bds
|
2
ba
|
2,049
sqft
|
built
1974
1814 Mc Quaid Dr, Baton Rouge, LA 70810
$110
Cash flow
2.7%
Cash-on-Cash Return
6.3%
Cap rate
0.8%
Rent to Value Ratio
Active
$285,000
3
bds
|
3
ba
|
2,625
sqft
|
built
2009
2009 Lac Cache Ct, Baton Rouge, LA 70816
$-77
Cash flow
-1.4%
Cash-on-Cash Return
5.4%
Cap rate
0.7%
Rent to Value Ratio
Active
$130,000
2
bds
|
2
ba
|
1,135
sqft
|
built
1964
760 N 29th St, Baton Rouge, LA 70802
$75
Cash flow
3.0%
Cash-on-Cash Return
6.4%
Cap rate
0.8%
Rent to Value Ratio