East Baton Rouge Parish County Investment Properties for Sale
Browse homes for sale and investment properties in East Baton Rouge Parish County. Refine your search by price, property type, or more.
Best cash flowing properties in East Baton Rouge Parish County

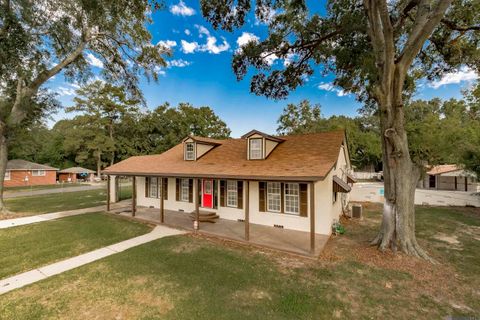
Active
$70,000
3
bds
|
2
ba
|
1,675
sqft
|
built
1950
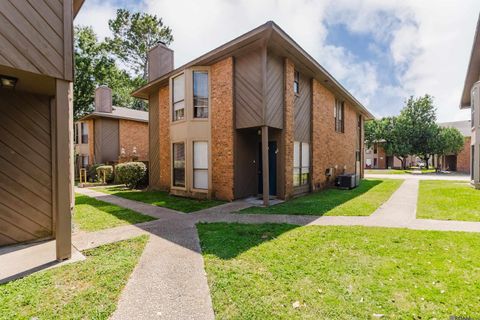
2855 Madison Ave, Baton Rouge, LA 70802
$828
Cash flow
13.8%
Cash-on-Cash Return
14.2%
Cap rate
1.7%
Rent to Value Ratio

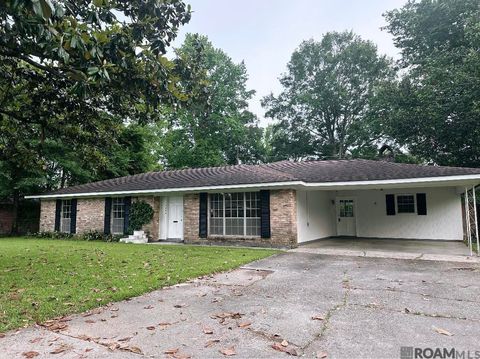
Active
$59,900
2
bds
|
1
ba
|
810
sqft
|
built
2005
3005 Highland Rd, Baton Rouge, LA 70802
$559
Cash flow
10.9%
Cash-on-Cash Return
11.2%
Cap rate
1.8%
Rent to Value Ratio
878 out of 885 properties for sale in East Baton Rouge Parish County
Limited Results Shown
Create a free account, or log in to reveal all property listings and enjoy the complete experience.
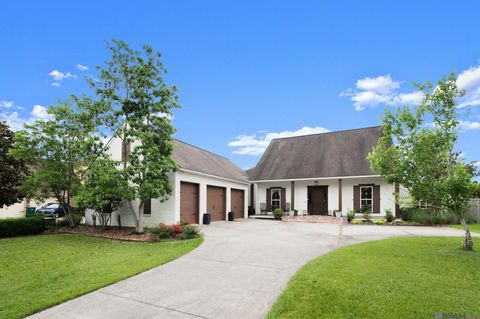
Active
$120,000
2
bds
|
3
ba
|
1,250
sqft
|
built
1984
1757 S Brightside View Dr, Baton Rouge, LA 70820
$114
Cash flow
5.0%
Cash-on-Cash Return
6.8%
Cap rate
1.2%
Rent to Value Ratio
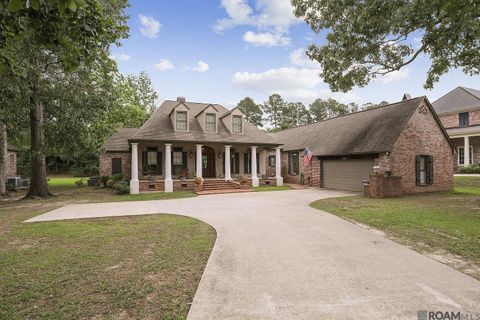
Active
$229,000
3
bds
|
2
ba
|
1,451
sqft
|
built
2012
9302 Redwood Lake Blvd, Zachary, LA 70791
$137
Cash flow
3.1%
Cash-on-Cash Return
6.4%
Cap rate
0.8%
Rent to Value Ratio
Active
$314,400
2
bds
|
3
ba
|
1,573
sqft
|
built
2018
5066 Myrtle Trail Dr, Baton Rouge, LA 70820
$-509
Cash flow
-8.4%
Cash-on-Cash Return
3.7%
Cap rate
0.5%
Rent to Value Ratio

Active
$325,000
3
bds
|
3
ba
|
2,216
sqft
|
built
1975
245 Rue De Laplace, Baton Rouge, LA 70810
$183
Cash flow
2.9%
Cash-on-Cash Return
6.4%
Cap rate
0.8%
Rent to Value Ratio

Active
$299,000
3
bds
|
3
ba
|
1,521
sqft
|
built
2016
7131 Kodiak Dr, Baton Rouge, LA 70810
$-79
Cash flow
-1.4%
Cash-on-Cash Return
5.4%
Cap rate
0.7%
Rent to Value Ratio

Active
$344,995
4
bds
|
2
ba
|
2,253
sqft
|
built
2016
17525 Waterloo Dr, Baton Rouge, LA 70817
$60
Cash flow
0.9%
Cash-on-Cash Return
5.9%
Cap rate
0.7%
Rent to Value Ratio

Active
$775,000
4
bds
|
3
ba
|
2,780
sqft
|
built
2015
11520 Ancestors Dr, Baton Rouge, LA 70810
$-692
Cash flow
-4.7%
Cash-on-Cash Return
4.6%
Cap rate
0.6%
Rent to Value Ratio

Active
$116,000
2
bds
|
1
ba
|
1,100
sqft
|
built
1970
2034 N 15th St, Baton Rouge, LA 70802
$417
Cash flow
18.8%
Cash-on-Cash Return
10.0%
Cap rate
1.2%
Rent to Value Ratio

Active
$849,900
3
bds
|
4
ba
|
2,729
sqft
|
built
2018
7470 Sevenoaks Ave, Baton Rouge, LA 70806
$-641
Cash flow
-3.9%
Cash-on-Cash Return
4.8%
Cap rate
0.6%
Rent to Value Ratio

Active
$315,000
2
bds
|
1
ba
|
1,480
sqft
|
built
1971
1313 S Eugene St, Baton Rouge, LA 70806
$-249
Cash flow
-4.1%
Cash-on-Cash Return
4.7%
Cap rate
0.6%
Rent to Value Ratio

Active
$86,000
4
bds
|
2
ba
|
1,677
sqft
|
built
1976
1438 N 43rd St, Baton Rouge, LA 70802
$421
Cash flow
25.5%
Cash-on-Cash Return
11.6%
Cap rate
1.4%
Rent to Value Ratio

Active
$925,000
4
bds
|
3
ba
|
3,409
sqft
|
built
1974
29549 Greenwell Springs Rd, Greenwell Springs, LA 70739
$-996
Cash flow
-5.6%
Cash-on-Cash Return
4.4%
Cap rate
0.5%
Rent to Value Ratio
Active
$269,900
3
bds
|
2
ba
|
1,932
sqft
|
built
1960
437 Cora Dr, Baton Rouge, LA 70815
$100
Cash flow
1.9%
Cash-on-Cash Return
6.1%
Cap rate
0.7%
Rent to Value Ratio
Active
$475,000
3
bds
|
3
ba
|
2,776
sqft
|
built
1964
3324 Delaware St, Baton Rouge, LA 70805
$-1,144
Cash flow
-12.6%
Cash-on-Cash Return
2.8%
Cap rate
0.3%
Rent to Value Ratio

Active
$835,000
4
bds
|
4
ba
|
3,290
sqft
|
built
2022
314 Casa Colina Ct, Baton Rouge, LA 70810
$-301
Cash flow
-1.9%
Cash-on-Cash Return
5.2%
Cap rate
0.7%
Rent to Value Ratio

Active
$580,000
3
bds
|
3
ba
|
2,205
sqft
|
built
2015
7037 Etage Ct, Baton Rouge, LA 70806
$-712
Cash flow
-6.4%
Cash-on-Cash Return
4.2%
Cap rate
0.6%
Rent to Value Ratio
Active
$470,000
4
bds
|
4
ba
|
2,920
sqft
|
built
2013
1684 Royal Troon Ct, Zachary, LA 70791
$60
Cash flow
0.7%
Cash-on-Cash Return
5.8%
Cap rate
0.8%
Rent to Value Ratio

Active
$425,000
4
bds
|
2
ba
|
1,995
sqft
|
built
2022
3006 Creekstone Way, Baton Rouge, LA 70810
$-162
Cash flow
-2.0%
Cash-on-Cash Return
5.2%
Cap rate
0.7%
Rent to Value Ratio

Active
$2,735,000
5
bds
|
6
ba
|
6,686
sqft
|
built
2019
16212 Highland Rd, Baton Rouge, LA 70810
$-6,802
Cash flow
-13.0%
Cash-on-Cash Return
2.7%
Cap rate
0.3%
Rent to Value Ratio

Active
$299,900
3
bds
|
2
ba
|
2,205
sqft
|
built
1942
1314 Laurel St, Baton Rouge, LA 70802
$99
Cash flow
1.7%
Cash-on-Cash Return
6.1%
Cap rate
0.7%
Rent to Value Ratio
Active
$995,000
5
bds
|
3
ba
|
4,114
sqft
|
built
1997
17230 N Lakeway Ave, Baton Rouge, LA 70810
$-2,500
Cash flow
-13.1%
Cash-on-Cash Return
2.7%
Cap rate
0.4%
Rent to Value Ratio
Active
$245,900
3
bds
|
2
ba
|
2,466
sqft
|
built
1958
11666 Parkwood Dr, Baton Rouge, LA 70815
$283
Cash flow
6.0%
Cash-on-Cash Return
7.1%
Cap rate
0.9%
Rent to Value Ratio

Active
$89,000
2
bds
|
2
ba
|
1,135
sqft
|
built
1975
4364 Gurney St, Baton Rouge, LA 70805
$476
Cash flow
27.9%
Cash-on-Cash Return
12.1%
Cap rate
1.5%
Rent to Value Ratio

Active
$2,595,000
6
bds
|
6
ba
|
5,822
sqft
|
built
2017
2930 Svendson Dr, Baton Rouge, LA 70809
$-6,091
Cash flow
-12.2%
Cash-on-Cash Return
2.9%
Cap rate
0.3%
Rent to Value Ratio
Active
$245,000
4
bds
|
3
ba
|
2,567
sqft
|
built
1974
2741 Westerwood Dr, Baton Rouge, LA 70816
$346
Cash flow
7.4%
Cash-on-Cash Return
7.4%
Cap rate
0.9%
Rent to Value Ratio

Active
$249,900
3
bds
|
2
ba
|
2,240
sqft
|
built
1975
3428 Madeira Dr, Baton Rouge, LA 70810
$128
Cash flow
2.7%
Cash-on-Cash Return
6.3%
Cap rate
0.8%
Rent to Value Ratio

Active
$950,000
4
bds
|
4
ba
|
3,352
sqft
|
built
1990
18650 Gleneagles Dr, Baton Rouge, LA 70810
$-1,252
Cash flow
-6.9%
Cash-on-Cash Return
4.1%
Cap rate
0.5%
Rent to Value Ratio
Active
$199,995
4
bds
|
3
ba
|
1,864
sqft
|
built
2008
1535 Stilt St, Baton Rouge, LA 70807
$296
Cash flow
7.7%
Cash-on-Cash Return
7.5%
Cap rate
0.9%
Rent to Value Ratio

Active
$500,000
3
bds
|
2
ba
|
1,883
sqft
|
built
1989
10013 Horseshoe Dr, Baton Rouge, LA 70817
$-1,124
Cash flow
-11.7%
Cash-on-Cash Return
3.0%
Cap rate
0.4%
Rent to Value Ratio

Active
$269,000
3
bds
|
2
ba
|
2,036
sqft
|
built
1984
347 E Plains Port Hudson Rd, Zachary, LA 70791
$-31
Cash flow
-0.6%
Cash-on-Cash Return
5.5%
Cap rate
0.7%
Rent to Value Ratio
Active
$1,050,000
4
bds
|
3
ba
|
3,256
sqft
|
built
1956
7375 Boyce Dr, Baton Rouge, LA 70809
$-693
Cash flow
-3.4%
Cash-on-Cash Return
4.9%
Cap rate
0.6%
Rent to Value Ratio

Active
$267,000
3
bds
|
2
ba
|
1,582
sqft
|
built
1993
17656 Chasefield Ave, Baton Rouge, LA 70817
$111
Cash flow
2.2%
Cash-on-Cash Return
6.2%
Cap rate
0.7%
Rent to Value Ratio

Active
$425,000
5
bds
|
2
ba
|
2,619
sqft
|
built
1978
8591 Wakefield Ave, Baton Rouge, LA 70806
$128
Cash flow
1.6%
Cash-on-Cash Return
6.0%
Cap rate
0.7%
Rent to Value Ratio

Active
$320,000
3
bds
|
2
ba
|
1,787
sqft
|
built
1997
17647 Lake Azalea Dr, Baton Rouge, LA 70817
$-6
Cash flow
-0.1%
Cash-on-Cash Return
5.7%
Cap rate
0.7%
Rent to Value Ratio

Active
$226,995
4
bds
|
2
ba
|
1,975
sqft
|
built
1977
5745 Estelle Dr, Baton Rouge, LA 70817
$306
Cash flow
7.0%
Cash-on-Cash Return
7.3%
Cap rate
0.9%
Rent to Value Ratio
Active
$324,900
4
bds
|
3
ba
|
2,378
sqft
|
built
1979
13734 Buckley Ave, Baton Rouge, LA 70816
$-158
Cash flow
-2.5%
Cash-on-Cash Return
5.1%
Cap rate
0.6%
Rent to Value Ratio

Active
$1,300,000
4
bds
|
4
ba
|
4,594
sqft
|
built
2017
4330 Trevi Ct, Baton Rouge, LA 70809
$-1,920
Cash flow
-7.7%
Cash-on-Cash Return
3.9%
Cap rate
0.5%
Rent to Value Ratio

Active
$349,999
3
bds
|
3
ba
|
1,836
sqft
|
built
1953
424 Centenary Dr, Baton Rouge, LA 70808
$69
Cash flow
1.0%
Cash-on-Cash Return
5.9%
Cap rate
0.7%
Rent to Value Ratio