Orleans Parish County Investment Properties for Sale
Browse homes for sale and investment properties in Orleans Parish County. Refine your search by price, property type, or more.
Best cash flowing properties in Orleans Parish County
Active
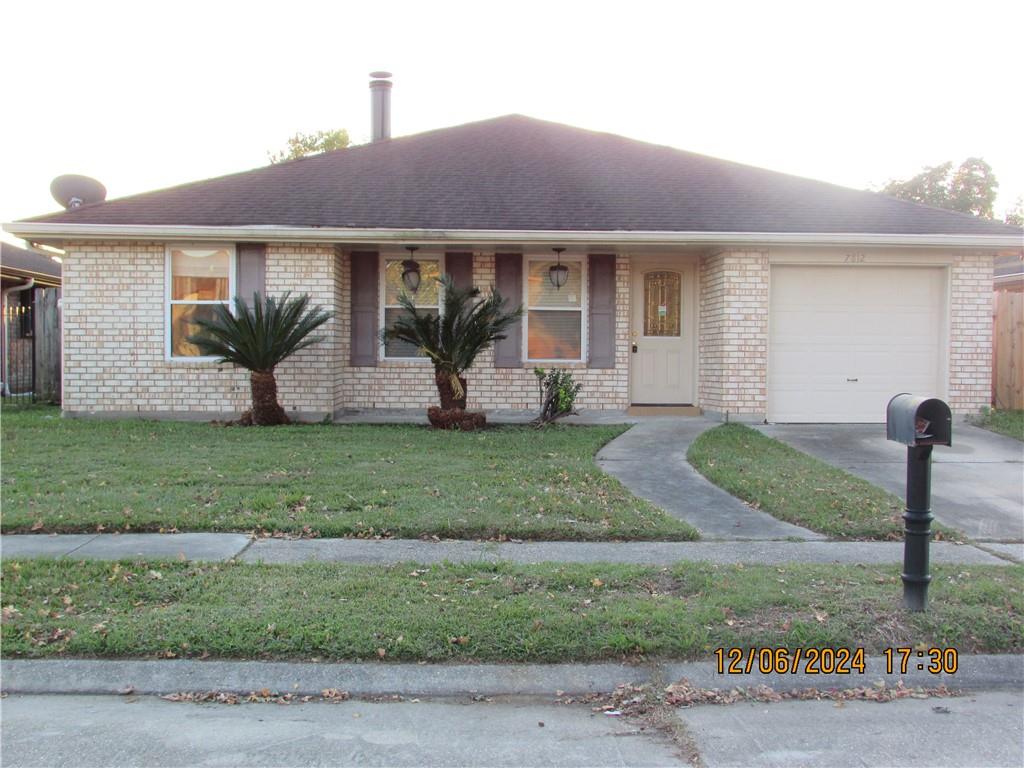
$164,900
3
bds
|
2
ba
|
1,700
sqft
|
built
2024
7812 Scottwood Dr, New Orleans, LA 70128
$600
Cash flow
19.0%
Cash-on-Cash Return
10.0%
Cap rate
1.2%
Rent to Value Ratio
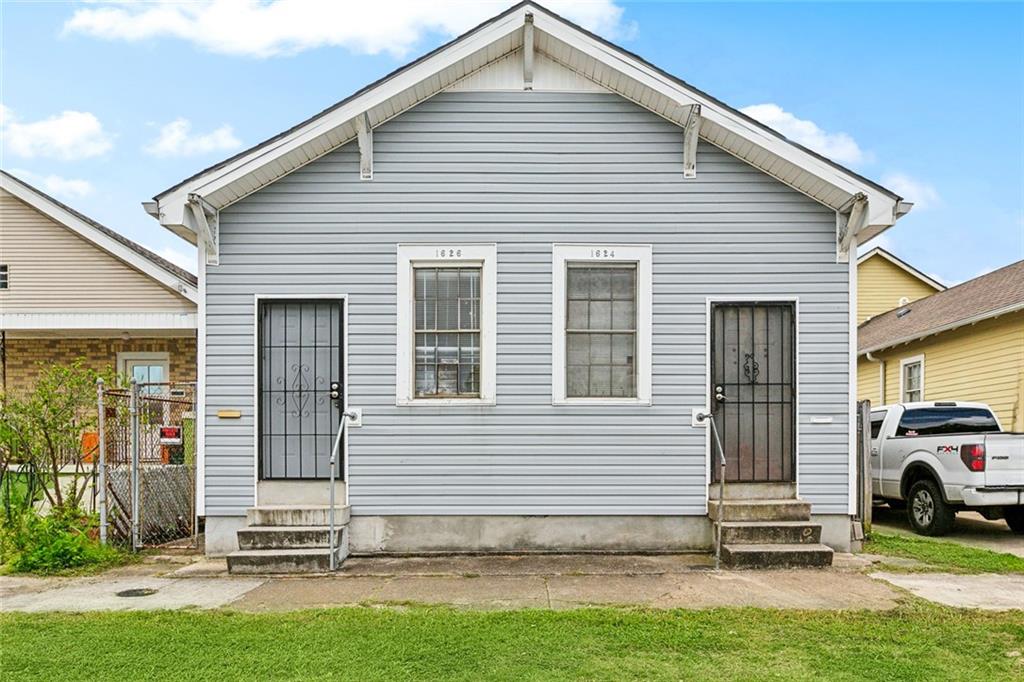
Active
$139,900
2
bds
|
0
ba
|
1,325
sqft
|
built
1918
1624 N Miro St, New Orleans, LA 70119
$580
Cash flow
21.6%
Cash-on-Cash Return
10.7%
Cap rate
1.3%
Rent to Value Ratio
1,785 out of 1,792 properties for sale in Orleans Parish County
Limited Results Shown
Create a free account, or log in to reveal all property listings and enjoy the complete experience.
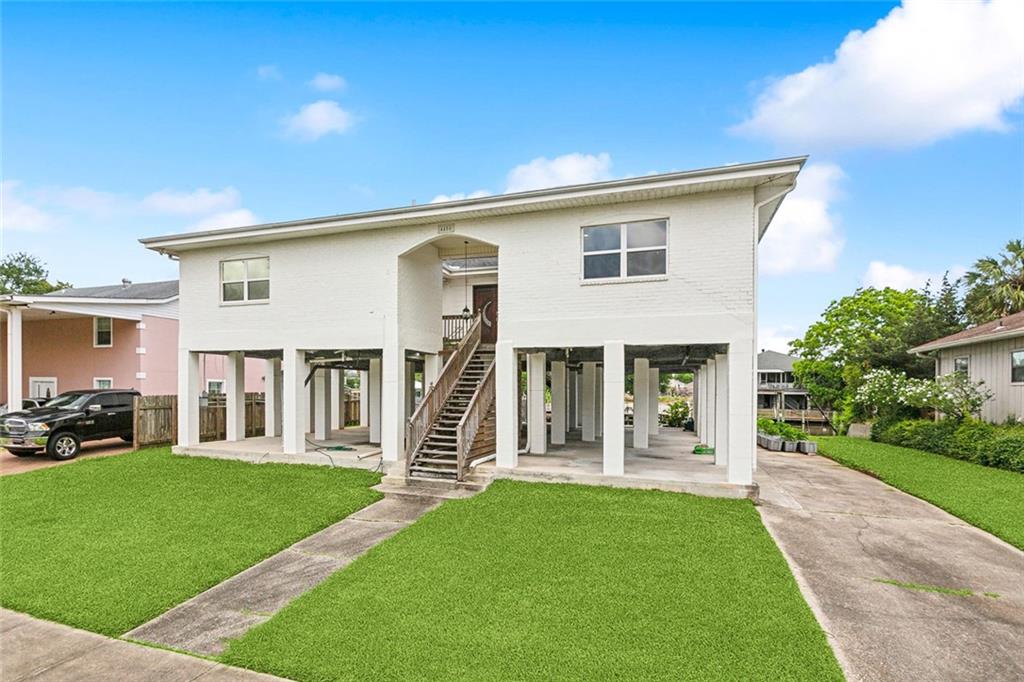
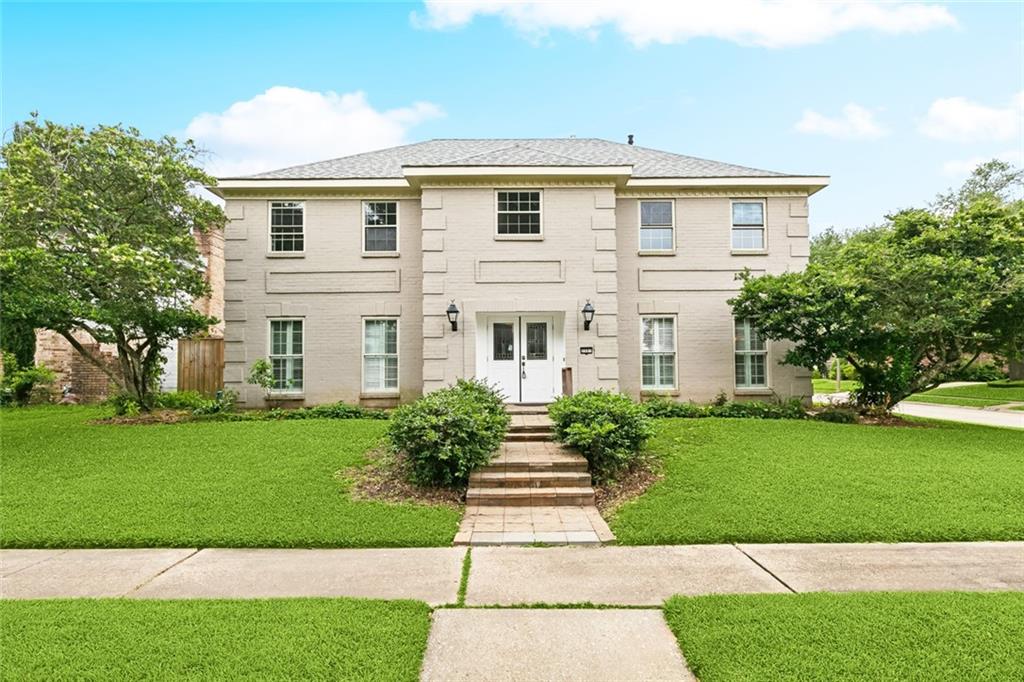
Active
$360,000
4
bds
|
2
ba
|
2,528
sqft
|
built
2000
4455 San Marco Rd, New Orleans, LA 70129
$-117
Cash flow
-1.7%
Cash-on-Cash Return
5.3%
Cap rate
0.6%
Rent to Value Ratio
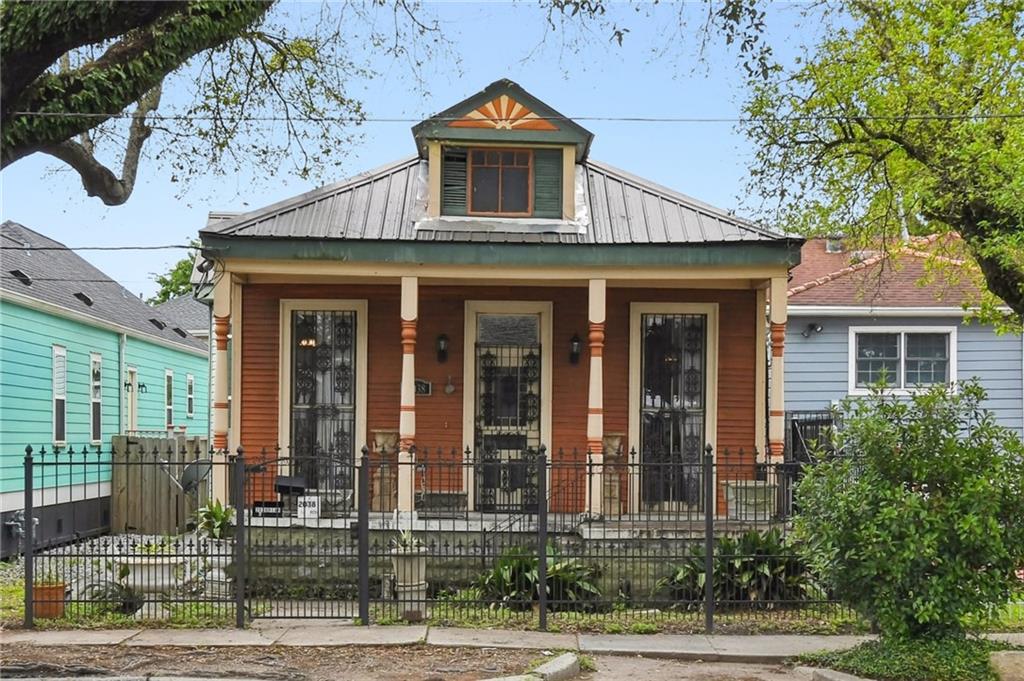
Active
$270,000
4
bds
|
0
ba
|
1,704
sqft
|
built
1920
2038 Elysian Fields Ave, New Orleans, LA 70117
$-36
Cash flow
-0.7%
Cash-on-Cash Return
5.5%
Cap rate
0.7%
Rent to Value Ratio
Active
$350,000
4
bds
|
0
ba
|
2,115
sqft
|
built
1950
2315 Peniston St, New Orleans, LA 70115
$-276
Cash flow
-4.1%
Cash-on-Cash Return
4.7%
Cap rate
0.6%
Rent to Value Ratio
Active
$260,000
4
bds
|
2
ba
|
1,883
sqft
|
built
1965
6133 Carlisle Ct, New Orleans, LA 70131
$150
Cash flow
3.0%
Cash-on-Cash Return
6.4%
Cap rate
0.8%
Rent to Value Ratio
Active
$249,900
3
bds
|
2
ba
|
1,196
sqft
|
built
2008
3725 Clermont Dr, New Orleans, LA 70122
$59
Cash flow
1.2%
Cash-on-Cash Return
6.0%
Cap rate
0.7%
Rent to Value Ratio
Active
$275,000
1
bds
|
1
ba
|
589
sqft
|
built
1985
822 Touro St, New Orleans, LA 70116
$-197
Cash flow
-3.7%
Cash-on-Cash Return
4.8%
Cap rate
0.6%
Rent to Value Ratio
Active
$499,900
2
bds
|
1
ba
|
1,318
sqft
|
built
1974
3262 Ridgeway Blvd, New Orleans, LA 70129
$-365
Cash flow
-3.8%
Cash-on-Cash Return
4.8%
Cap rate
0.6%
Rent to Value Ratio

Active
$480,000
3
bds
|
2
ba
|
1,843
sqft
|
built
2013
110 Sharon Dr, New Orleans, LA 70124
$143
Cash flow
1.6%
Cash-on-Cash Return
6.0%
Cap rate
0.7%
Rent to Value Ratio
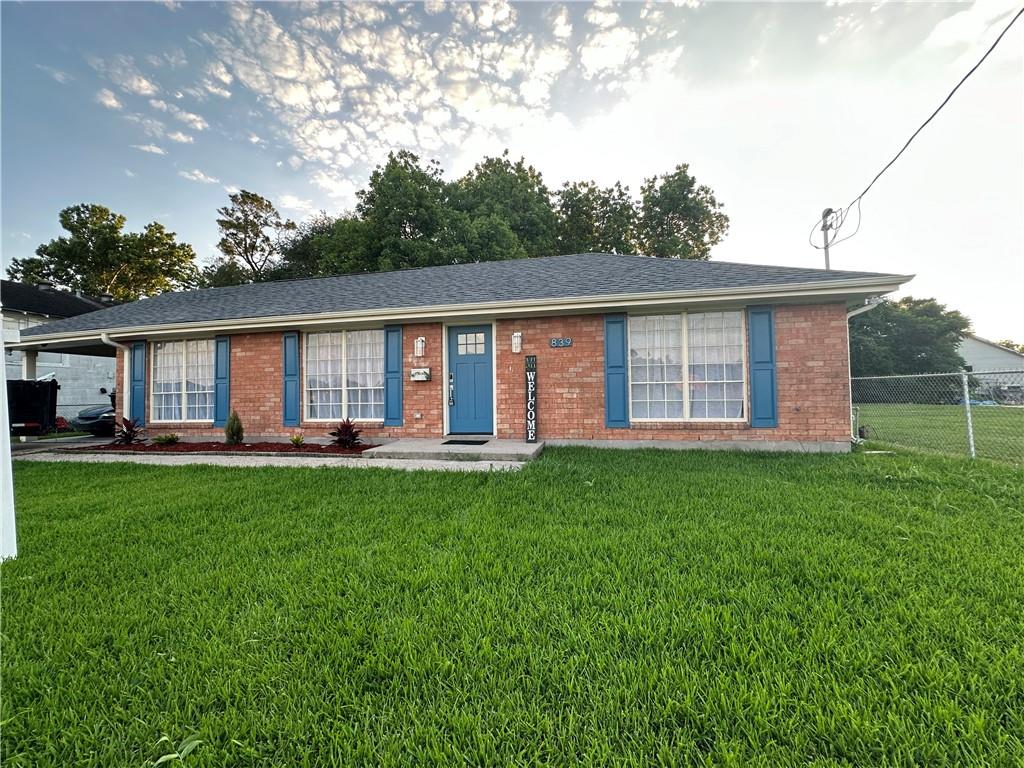
Active
$229,900
2
bds
|
2
ba
|
1,440
sqft
|
built
1950
839 Behrman Ave, New Orleans, LA 70114
$16
Cash flow
0.4%
Cash-on-Cash Return
5.8%
Cap rate
0.7%
Rent to Value Ratio
Active
$135,000
3
bds
|
0
ba
|
1,317
sqft
|
built
1960
3025 Saint Roch Ave, New Orleans, LA 70122
$327
Cash flow
12.6%
Cash-on-Cash Return
8.6%
Cap rate
1.0%
Rent to Value Ratio
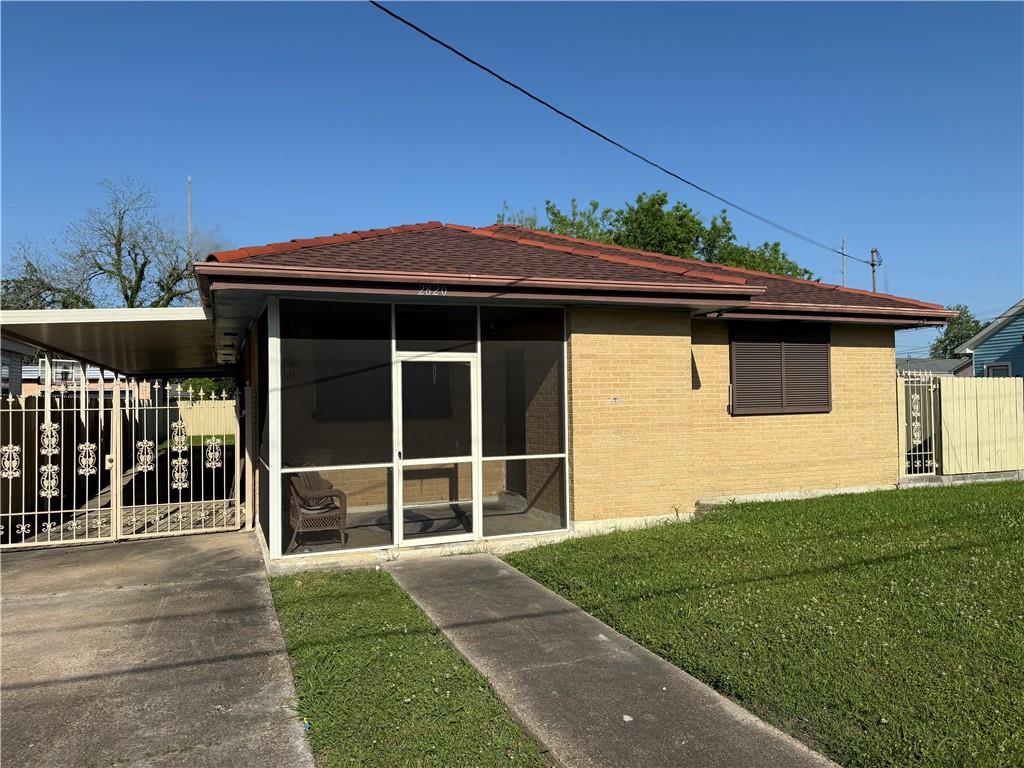
Active
$189,900
2
bds
|
2
ba
|
1,472
sqft
|
built
1968
2820 Annette St, New Orleans, LA 70119
$274
Cash flow
7.5%
Cash-on-Cash Return
7.4%
Cap rate
0.9%
Rent to Value Ratio
Active
$399,900
5
bds
|
4
ba
|
3,284
sqft
|
built
1972
3501 Pin Oak Ave, New Orleans, LA 70131
$-320
Cash flow
-4.2%
Cash-on-Cash Return
4.7%
Cap rate
0.6%
Rent to Value Ratio
Active
$250,000
3
bds
|
3
ba
|
1,471
sqft
|
built
2004
5320 Wickfield Dr, New Orleans, LA 70122
$59
Cash flow
1.2%
Cash-on-Cash Return
6.0%
Cap rate
0.7%
Rent to Value Ratio
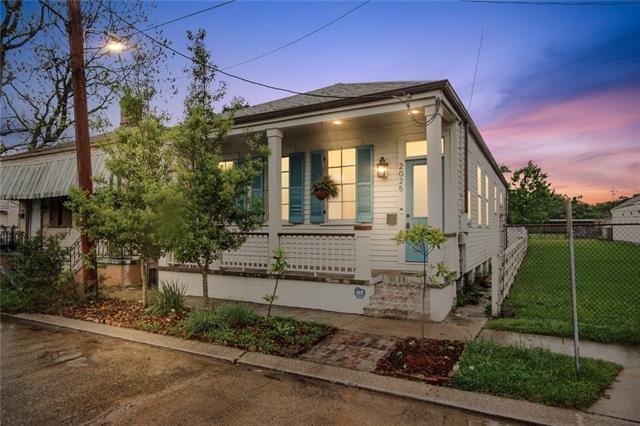
Active
$389,000
3
bds
|
4
ba
|
1,507
sqft
|
built
1936
2025 1st St, New Orleans, LA 70113
$-461
Cash flow
-6.2%
Cash-on-Cash Return
4.3%
Cap rate
0.5%
Rent to Value Ratio
Active
$550,000
4
bds
|
3
ba
|
2,650
sqft
|
built
1922
531 Olivier St, New Orleans, LA 70114
$-188
Cash flow
-1.8%
Cash-on-Cash Return
5.3%
Cap rate
0.6%
Rent to Value Ratio
Active
$1,050,000
4
bds
|
3
ba
|
2,760
sqft
|
built
1920
318 Walnut St, New Orleans, LA 70118
$-1,174
Cash flow
-5.8%
Cash-on-Cash Return
4.3%
Cap rate
0.5%
Rent to Value Ratio
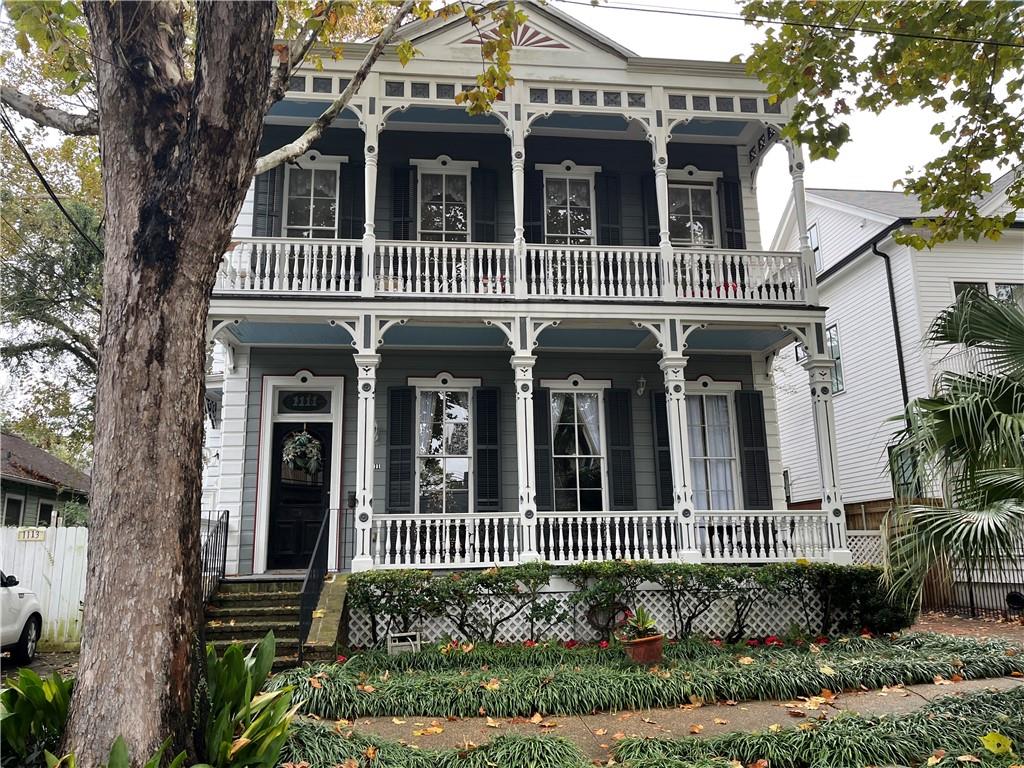
Active
$425,000
2
bds
|
2
ba
|
1,582
sqft
|
built
1854
1113 Peniston St, New Orleans, LA 70115
$-10
Cash flow
-0.1%
Cash-on-Cash Return
5.6%
Cap rate
0.7%
Rent to Value Ratio
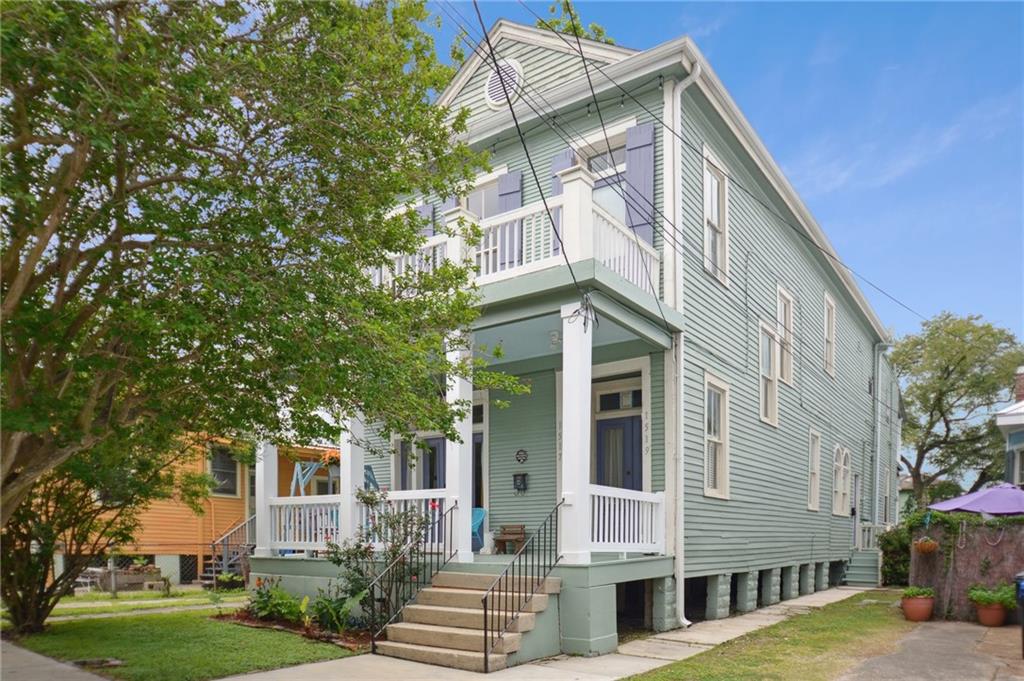
Active
$699,000
4
bds
|
0
ba
|
3,280
sqft
|
built
1917
1517 Crete St, New Orleans, LA 70119
$-2,204
Cash flow
-16.5%
Cash-on-Cash Return
1.9%
Cap rate
0.2%
Rent to Value Ratio
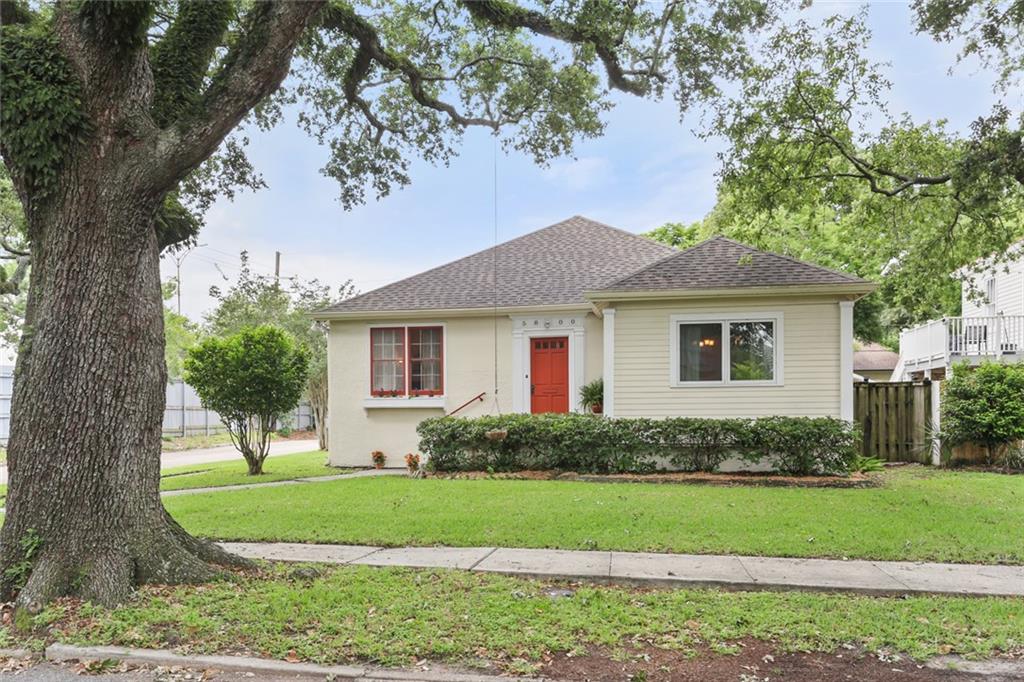
Active under contract
$435,000
2
bds
|
2
ba
|
1,679
sqft
|
built
1950
5800 Memphis St, New Orleans, LA 70124
$-127
Cash flow
-1.5%
Cash-on-Cash Return
5.3%
Cap rate
0.6%
Rent to Value Ratio
Active
$575,000
4
bds
|
2
ba
|
1,914
sqft
|
built
1938
5820 Magnolia St, New Orleans, LA 70115
$-306
Cash flow
-2.8%
Cash-on-Cash Return
5.0%
Cap rate
0.6%
Rent to Value Ratio
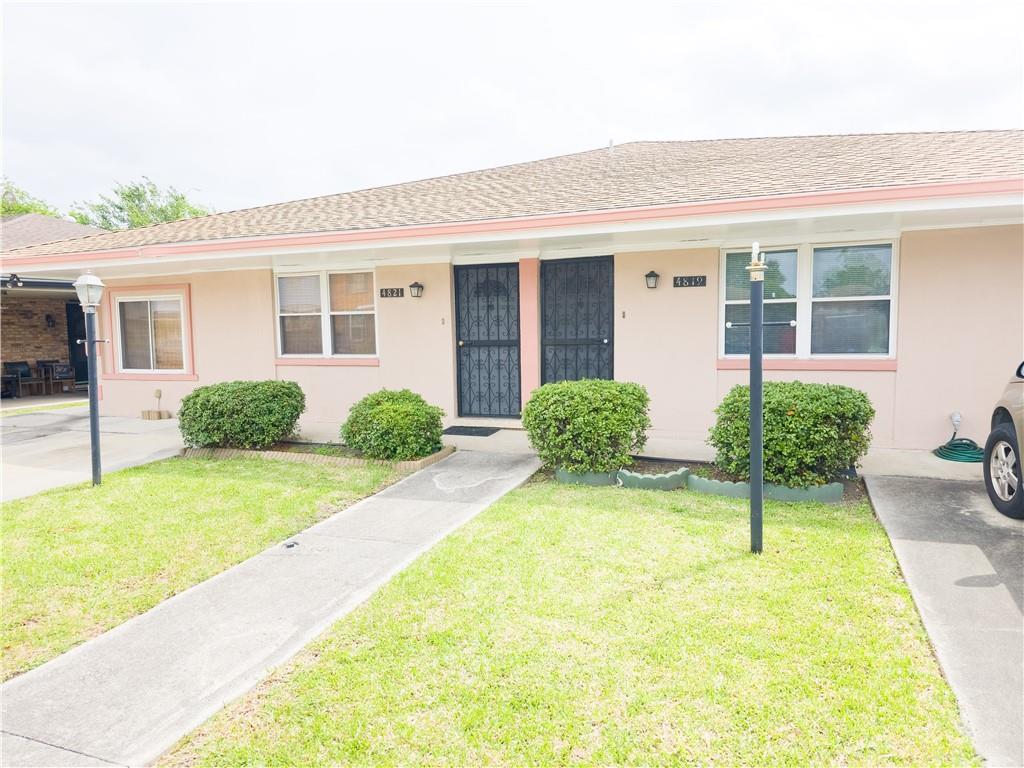
Active
$215,000
6
bds
|
0
ba
|
2,544
sqft
|
built
1970
4821 Francis Dr, New Orleans, LA 70126
$87
Cash flow
2.1%
Cash-on-Cash Return
6.2%
Cap rate
0.7%
Rent to Value Ratio
Active
$164,900
3
bds
|
2
ba
|
1,700
sqft
|
built
2024
7812 Scottwood Dr, New Orleans, LA 70128
$600
Cash flow
19.0%
Cash-on-Cash Return
10.0%
Cap rate
1.2%
Rent to Value Ratio
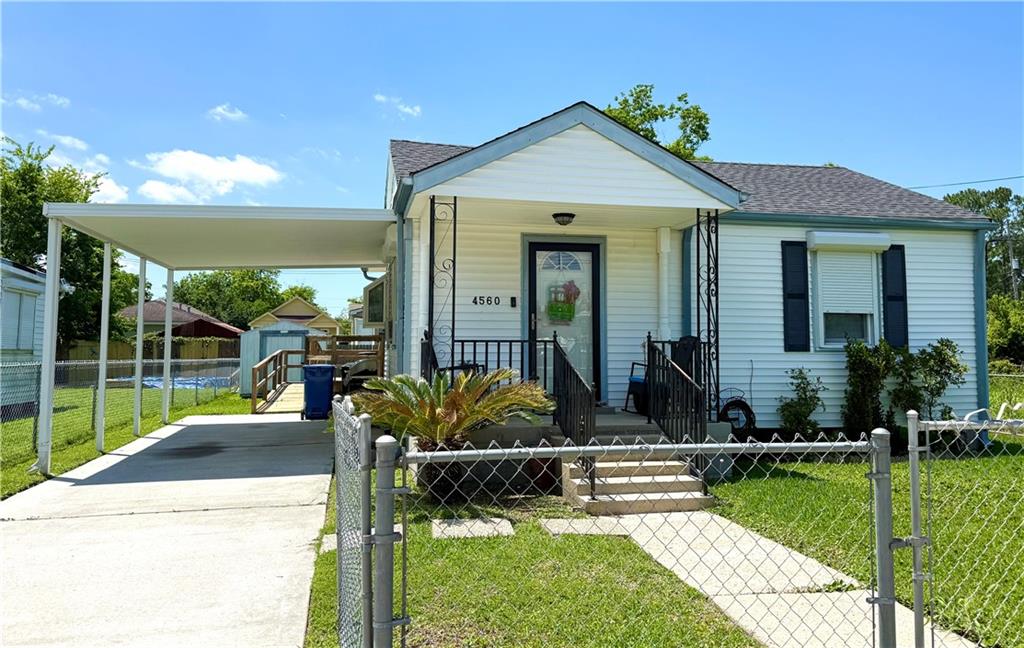
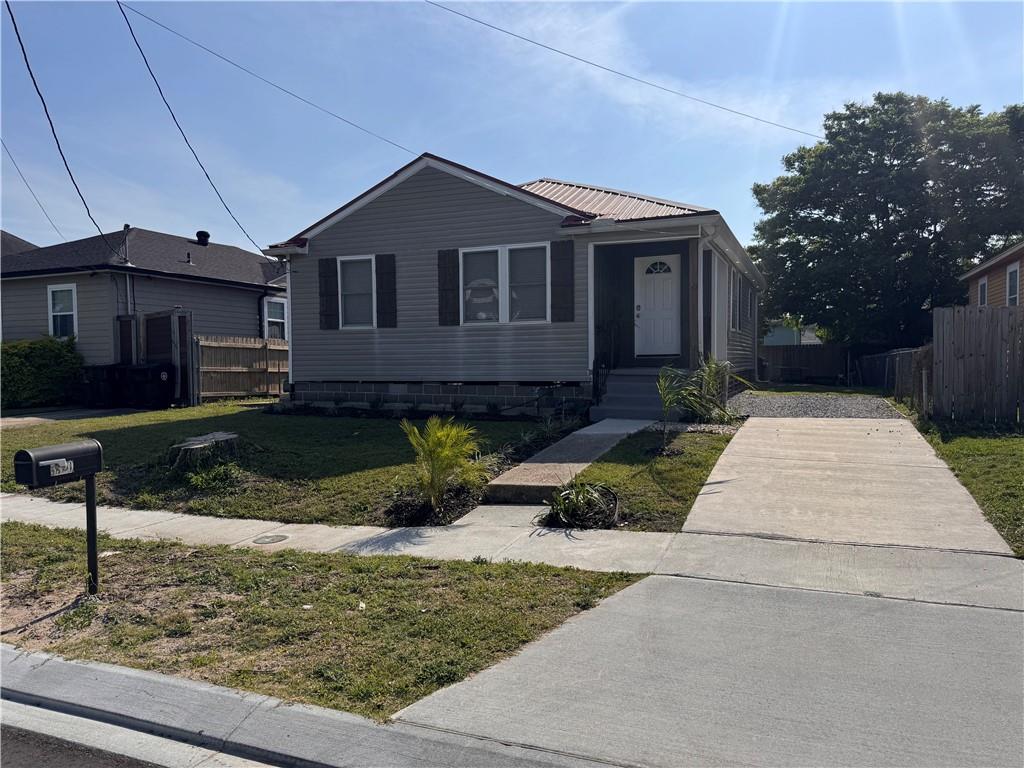
Active
$120,000
2
bds
|
1
ba
|
1,079
sqft
|
built
1991
4560 Laine Ave, New Orleans, LA 70126
$329
Cash flow
14.3%
Cash-on-Cash Return
9.0%
Cap rate
1.1%
Rent to Value Ratio
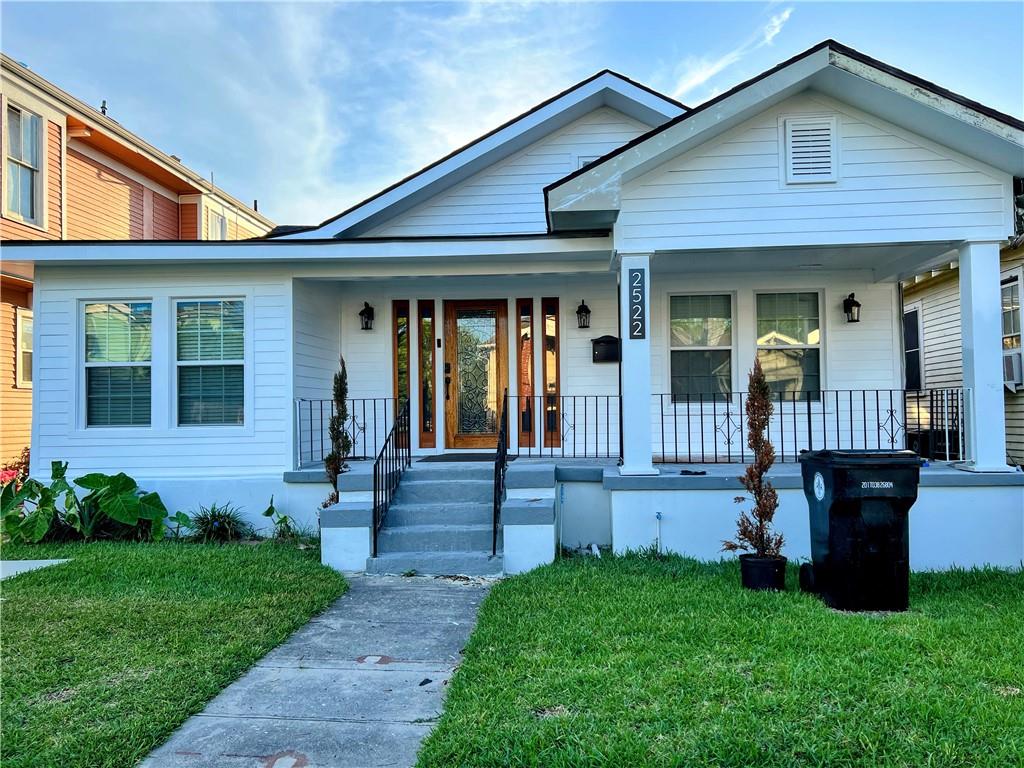
Active
$700,000
3
bds
|
3
ba
|
2,798
sqft
|
built
2018
2522 Robert St, New Orleans, LA 70115
$-1,381
Cash flow
-10.3%
Cash-on-Cash Return
3.3%
Cap rate
0.4%
Rent to Value Ratio
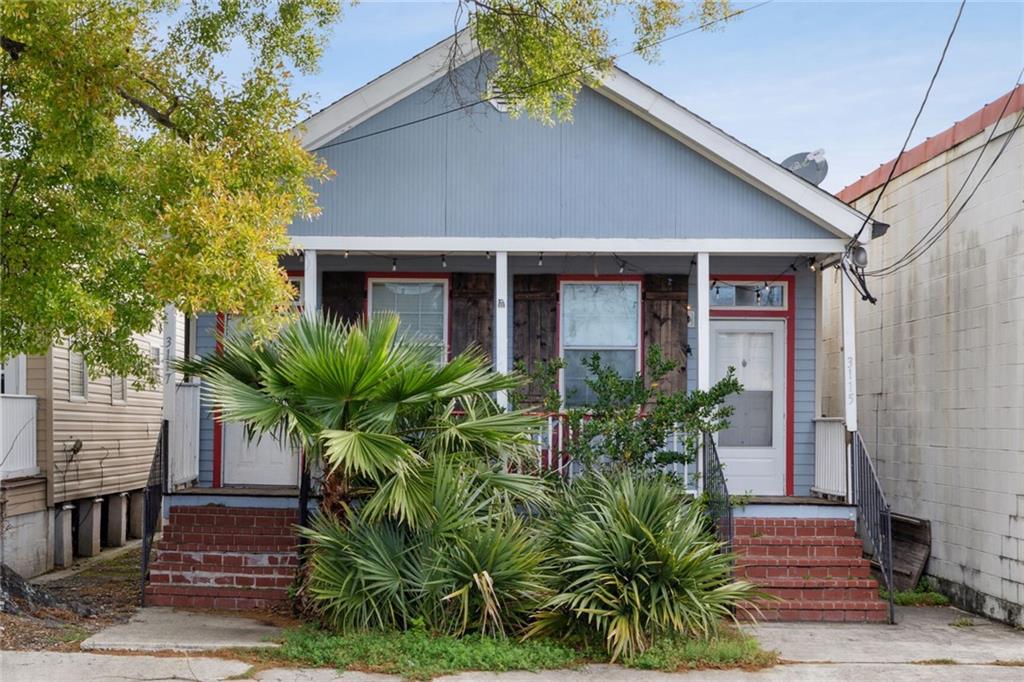
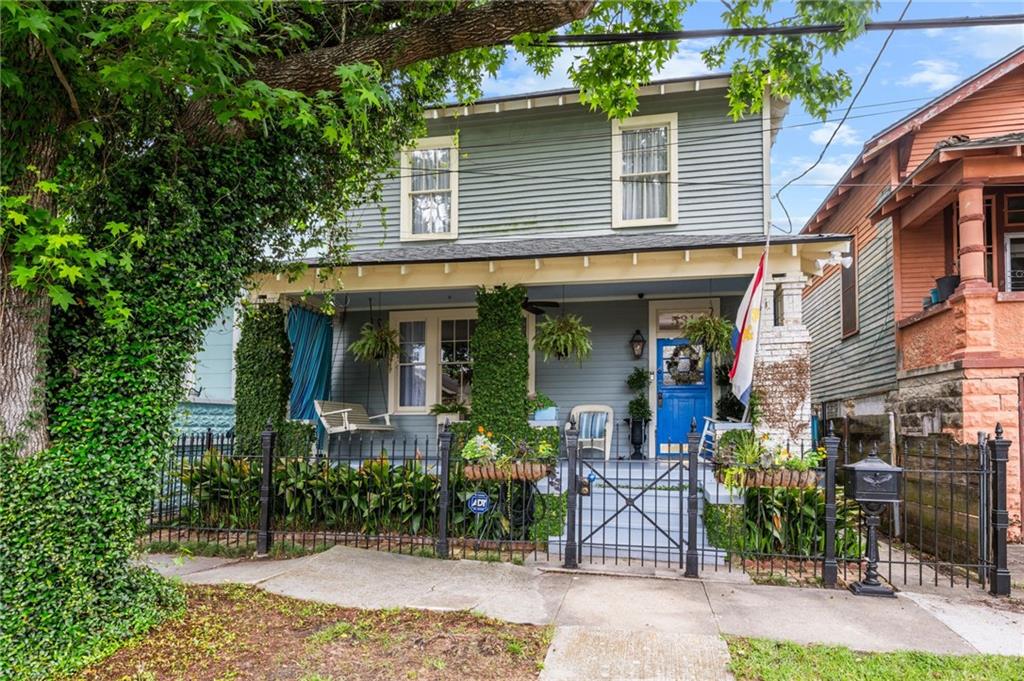
Active
$409,000
6
bds
|
4
ba
|
1,824
sqft
|
built
1920
3115 Conti St, New Orleans, LA 70119
$-694
Cash flow
-8.9%
Cash-on-Cash Return
3.6%
Cap rate
0.4%
Rent to Value Ratio
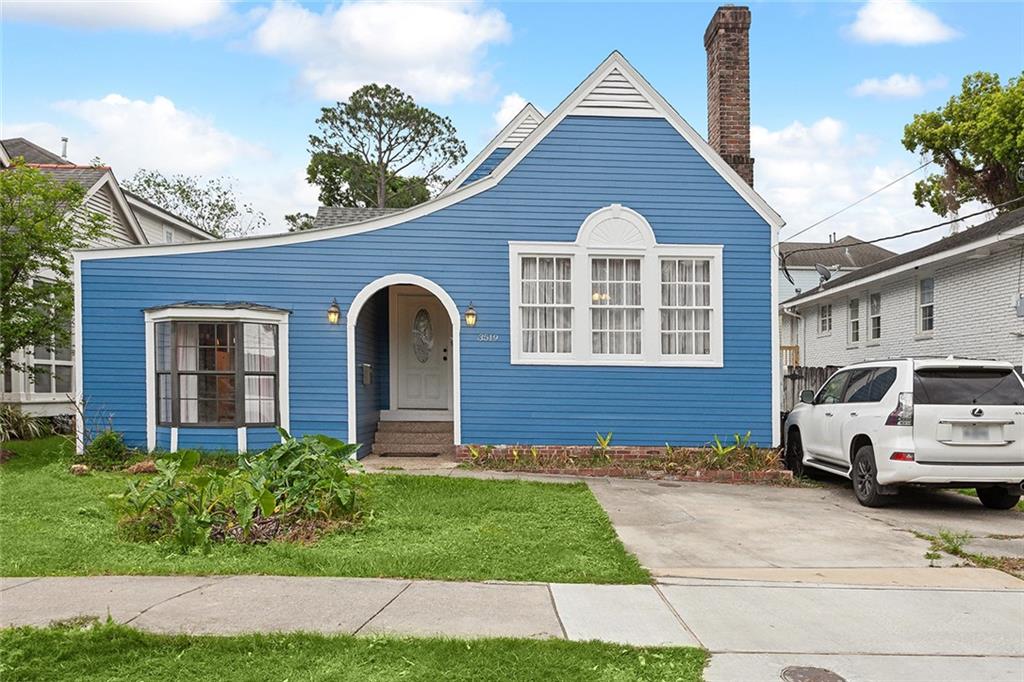
Active
$420,000
4
bds
|
3
ba
|
2,168
sqft
|
built
1940
3519 Octavia St, New Orleans, LA 70125
$13
Cash flow
0.2%
Cash-on-Cash Return
5.7%
Cap rate
0.7%
Rent to Value Ratio

Active
$265,000
3
bds
|
2
ba
|
2,510
sqft
|
built
1985
11240 Winrock Dr, New Orleans, LA 70128
$346
Cash flow
6.8%
Cash-on-Cash Return
7.2%
Cap rate
0.9%
Rent to Value Ratio
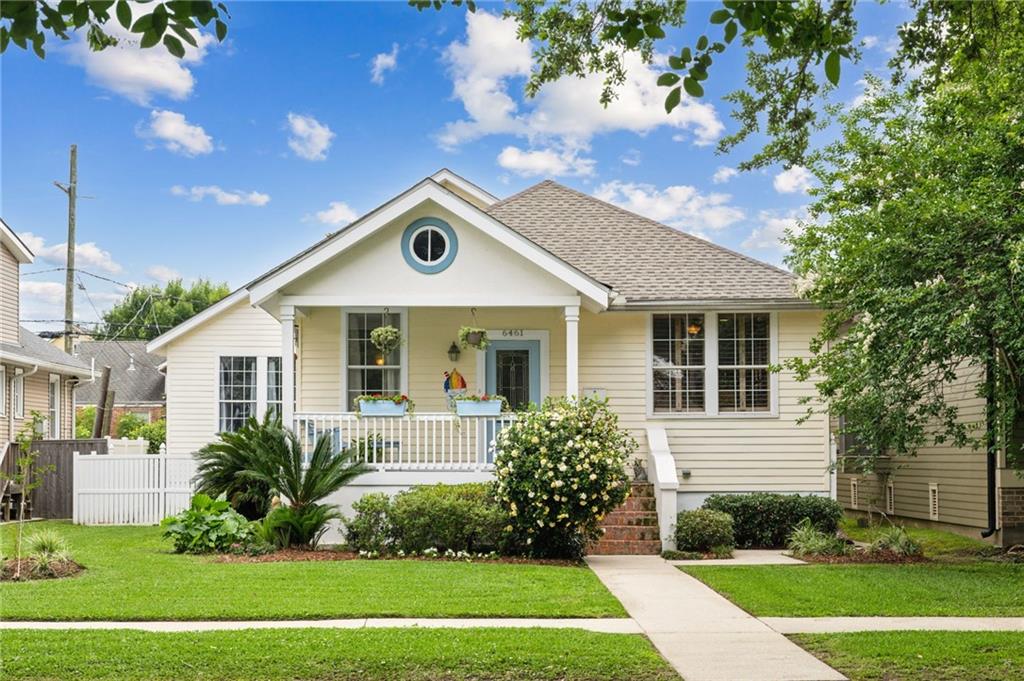
Active
$660,000
4
bds
|
3
ba
|
2,425
sqft
|
built
1950
6461 General Diaz St, New Orleans, LA 70124
$-1,122
Cash flow
-8.9%
Cash-on-Cash Return
3.6%
Cap rate
0.4%
Rent to Value Ratio
Active under contract
$209,900
3
bds
|
3
ba
|
1,400
sqft
|
built
1960
5717 Baccich St, New Orleans, LA 70122
$387
Cash flow
9.6%
Cash-on-Cash Return
7.9%
Cap rate
1.0%
Rent to Value Ratio
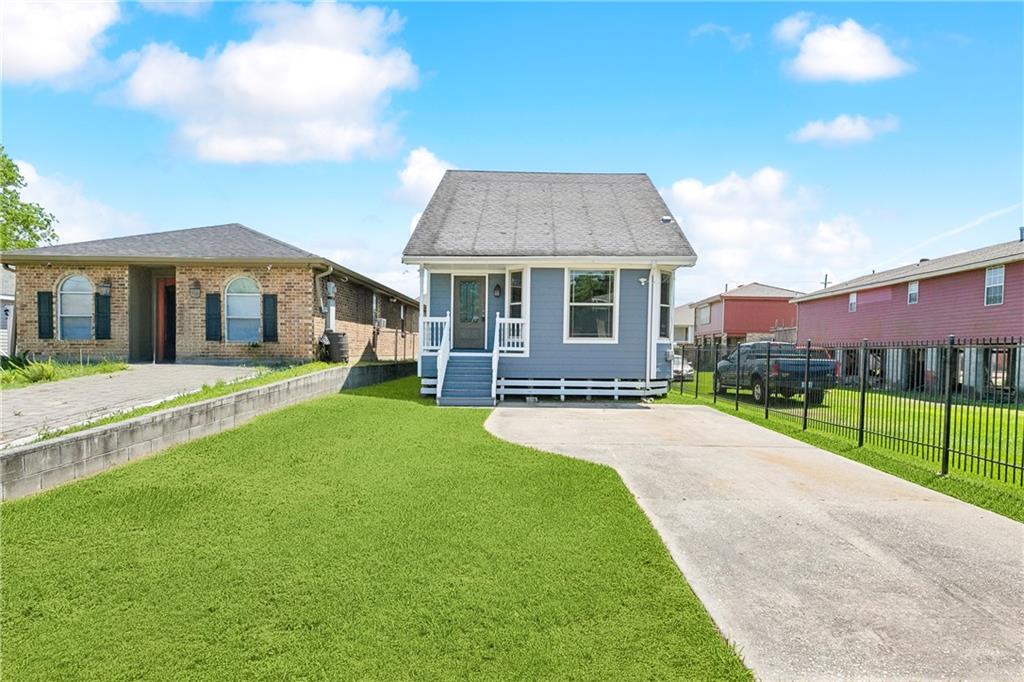
Active
$139,900
2
bds
|
0
ba
|
1,325
sqft
|
built
1918
1624 N Miro St, New Orleans, LA 70119
$580
Cash flow
21.6%
Cash-on-Cash Return
10.7%
Cap rate
1.3%
Rent to Value Ratio
Active
$598,000
2
bds
|
3
ba
|
2,016
sqft
|
built
1963
1729 Prytania St, New Orleans, LA 70130
$-691
Cash flow
-6.0%
Cash-on-Cash Return
4.3%
Cap rate
0.5%
Rent to Value Ratio
Active
$325,000
1
bds
|
1
ba
|
720
sqft
|
built
1924
1215 Louisiana Ave, New Orleans, LA 70115
$-296
Cash flow
-4.8%
Cash-on-Cash Return
4.6%
Cap rate
0.6%
Rent to Value Ratio
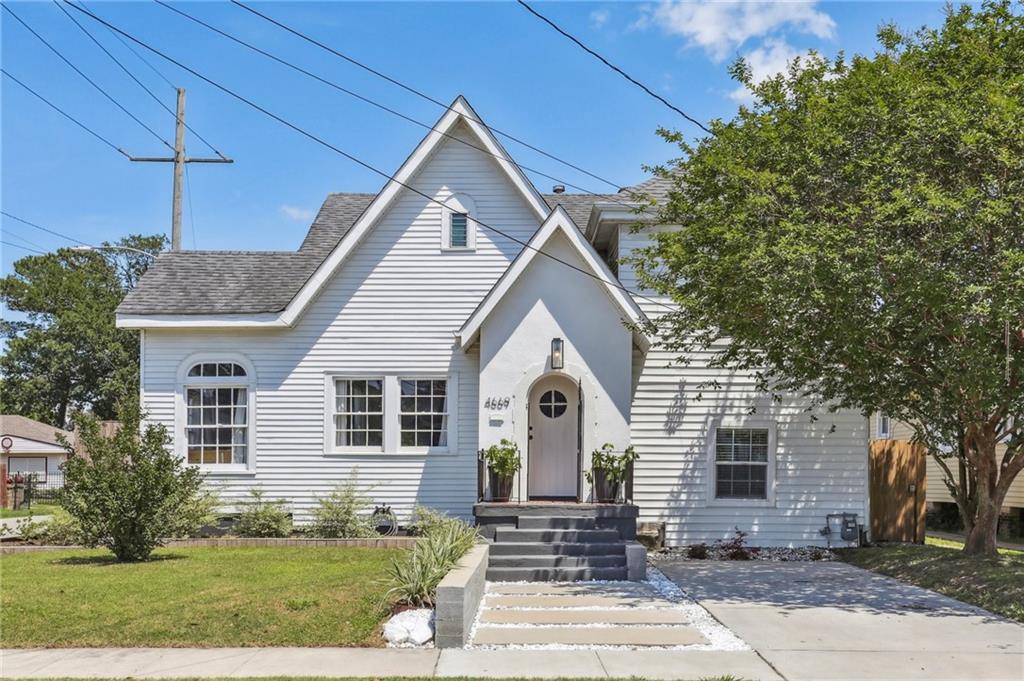
Active
$399,000
3
bds
|
3
ba
|
2,032
sqft
|
built
1941
4669 Baccich St, New Orleans, LA 70122
$-301
Cash flow
-3.9%
Cash-on-Cash Return
4.8%
Cap rate
0.6%
Rent to Value Ratio
Active
$395,000
2
bds
|
2
ba
|
1,326
sqft
|
built
1935
3314 Robert St, New Orleans, LA 70125
$-351
Cash flow
-4.6%
Cash-on-Cash Return
4.6%
Cap rate
0.6%
Rent to Value Ratio
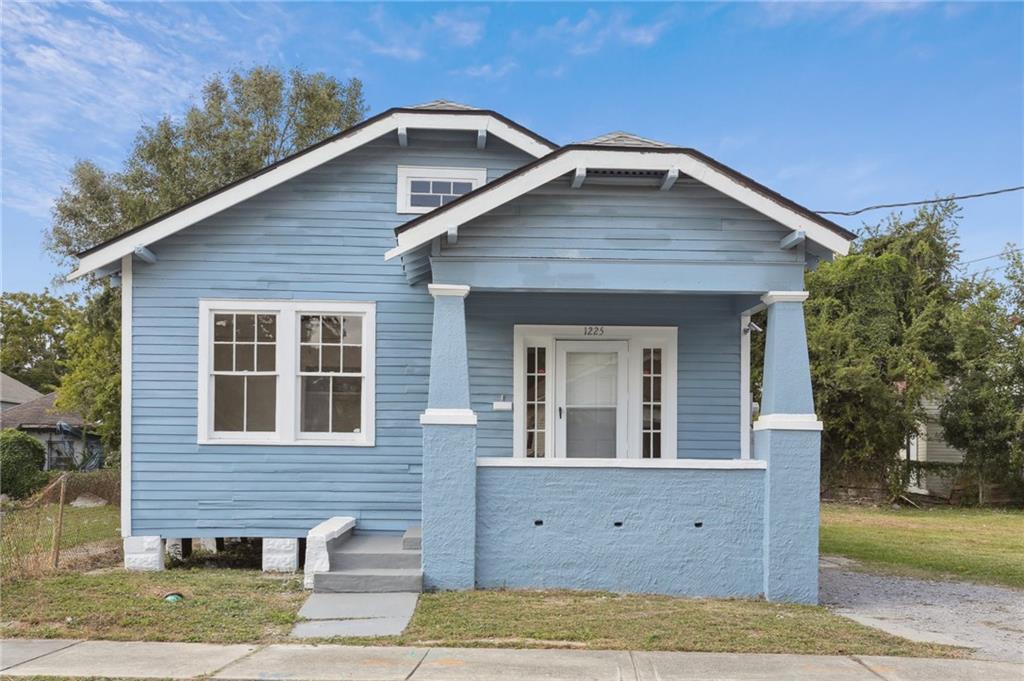
Active
$149,000
2
bds
|
2
ba
|
1,108
sqft
|
built
1934
1225 S Genois St, New Orleans, LA 70125
$537
Cash flow
18.8%
Cash-on-Cash Return
10.0%
Cap rate
1.2%
Rent to Value Ratio
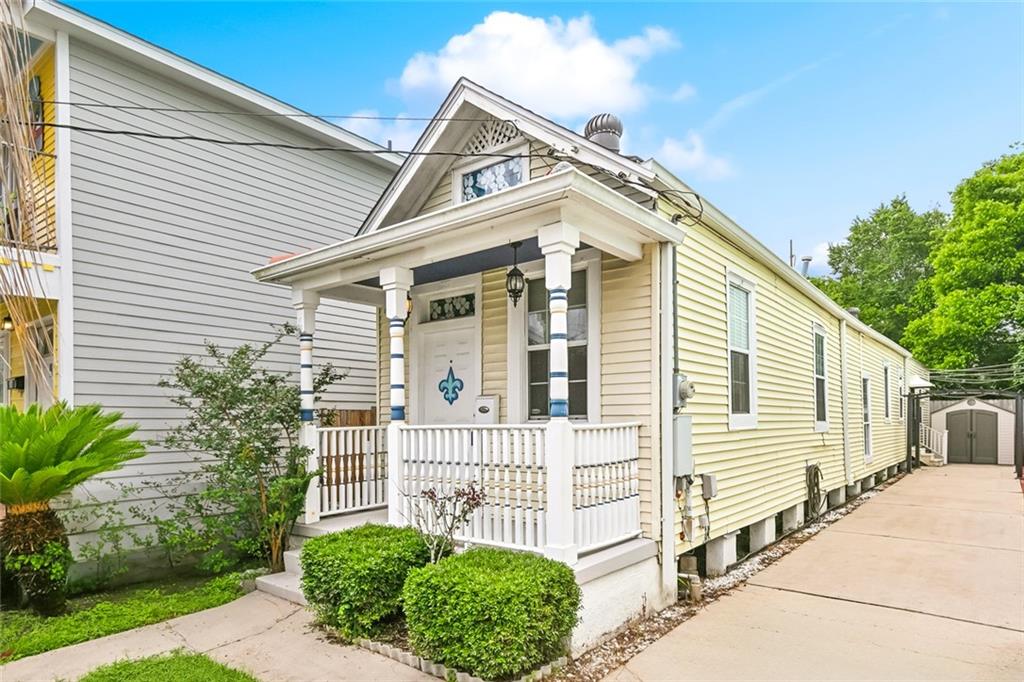
Active
$319,000
2
bds
|
2
ba
|
1,074
sqft
|
built
1927
525 S Telemachus St, New Orleans, LA 70119
$-130
Cash flow
-2.1%
Cash-on-Cash Return
5.2%
Cap rate
0.6%
Rent to Value Ratio
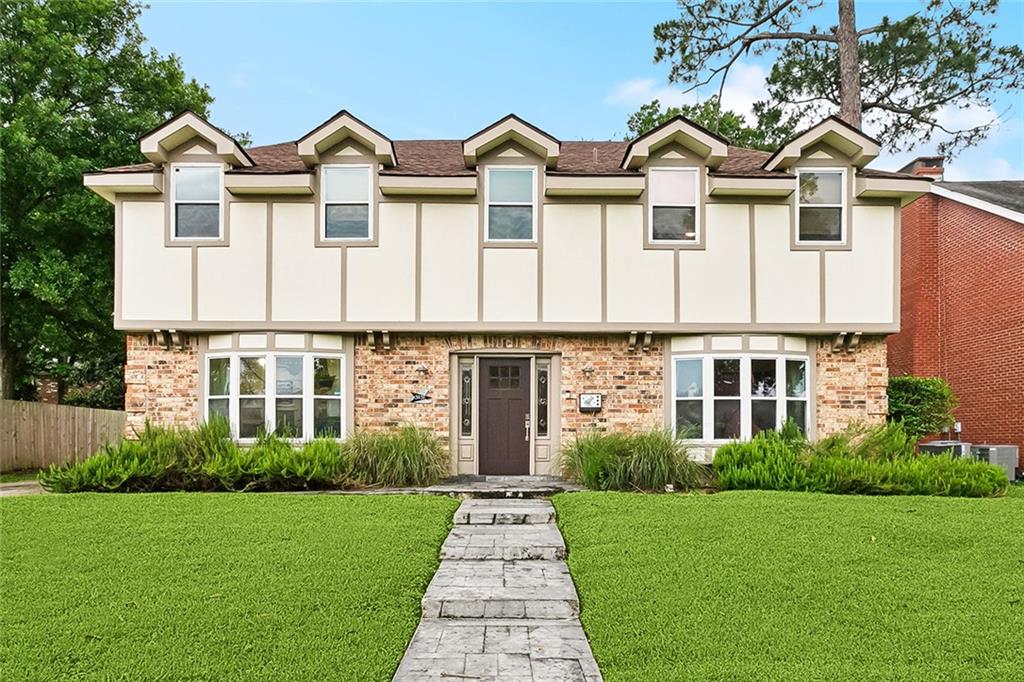
Active
$360,000
4
bds
|
3
ba
|
2,800
sqft
|
built
1970
3931 S Post Oak Ave, New Orleans, LA 70131
$79
Cash flow
1.1%
Cash-on-Cash Return
5.9%
Cap rate
0.8%
Rent to Value Ratio
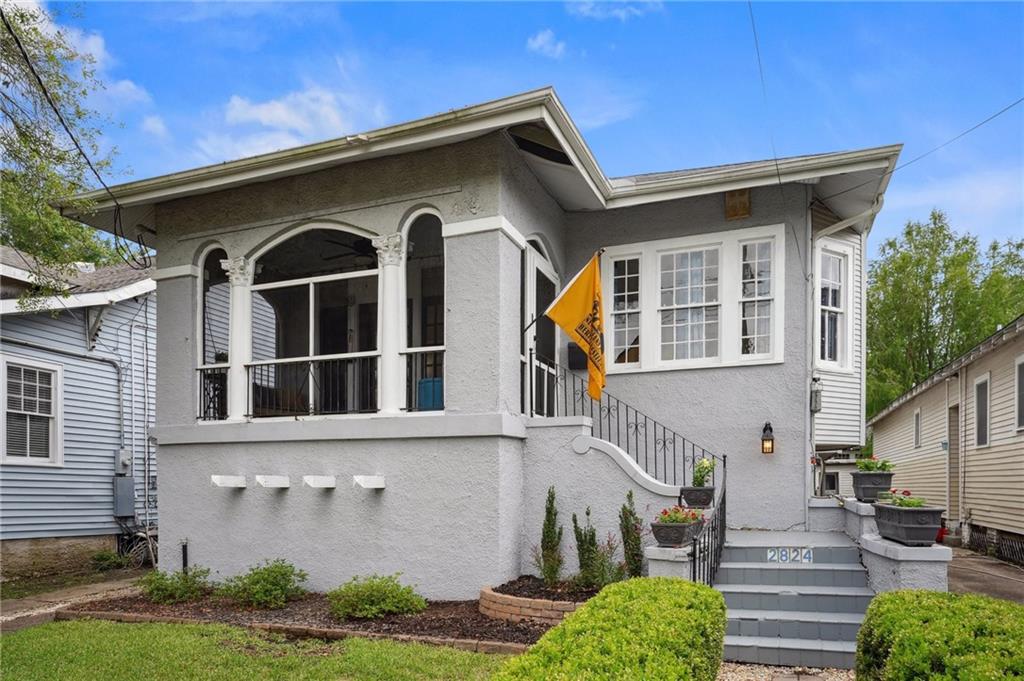
Active
$550,000
4
bds
|
3
ba
|
2,819
sqft
|
built
1925
2824 Calhoun St, New Orleans, LA 70118
$88
Cash flow
0.8%
Cash-on-Cash Return
5.9%
Cap rate
0.7%
Rent to Value Ratio
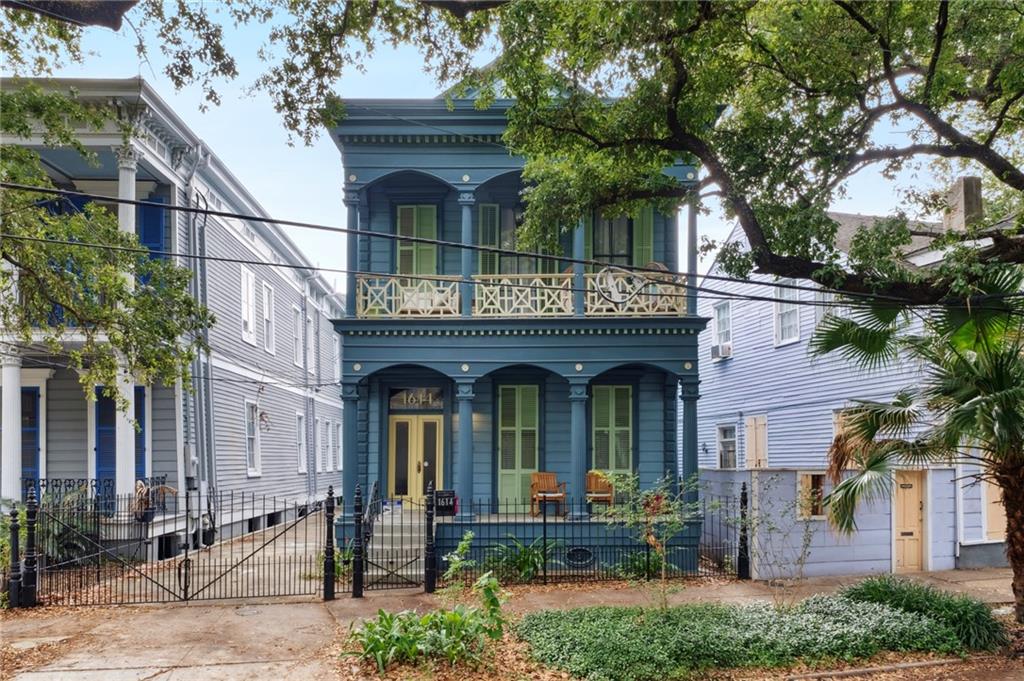
Active
$229,000
1
bds
|
1
ba
|
758
sqft
|
built
1845
1614 Governor Nicholls St, New Orleans, LA 70116
$-325
Cash flow
-7.4%
Cash-on-Cash Return
4.0%
Cap rate
0.5%
Rent to Value Ratio
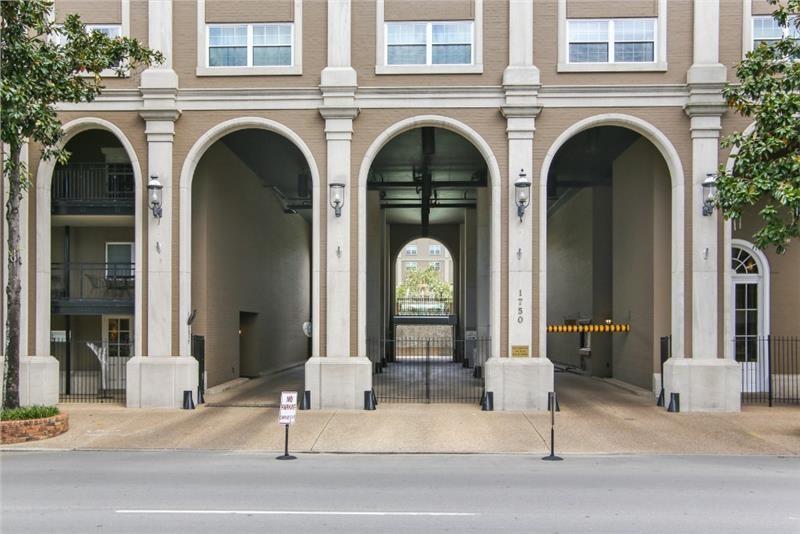
Active
$535,000
3
bds
|
2
ba
|
2,059
sqft
|
built
2005
1750 Saint Charles Ave, New Orleans, LA 70130
$-117
Cash flow
-1.1%
Cash-on-Cash Return
5.4%
Cap rate
0.7%
Rent to Value Ratio