Orleans Parish County Investment Properties for Sale
Browse homes for sale and investment properties in Orleans Parish County. Refine your search by price, property type, or more.
Best cash flowing properties in Orleans Parish County
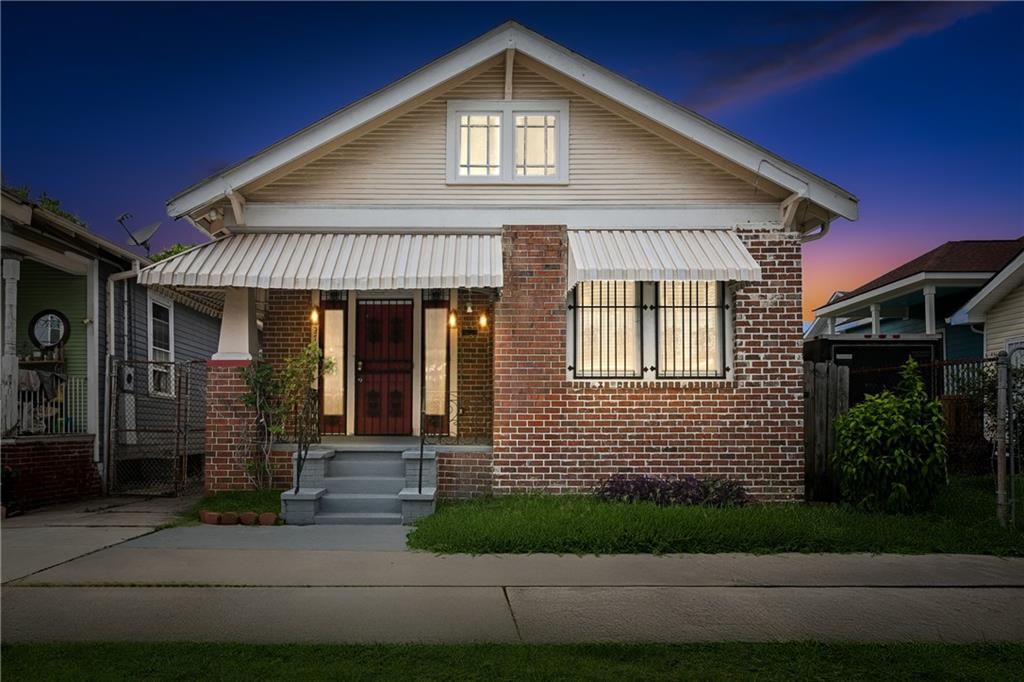
Active
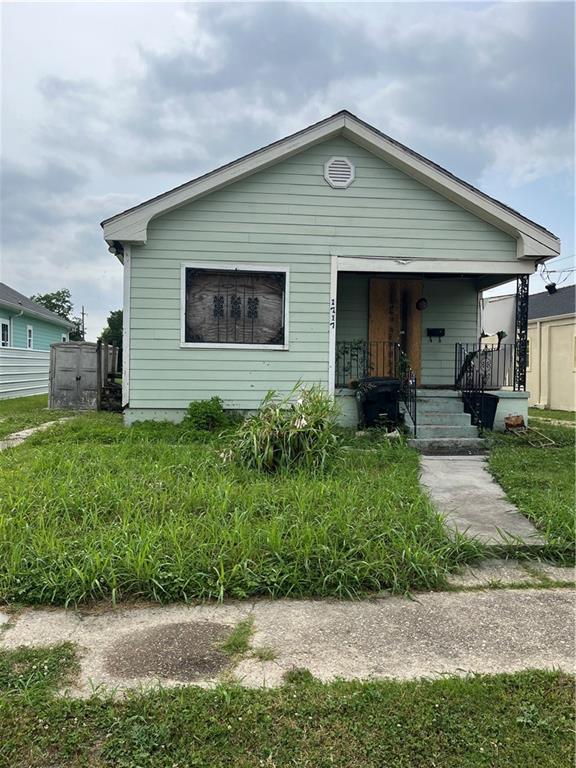
$50,000
2
bds
|
2
ba
|
1,428
sqft
|
built
1968
1717 Egania St, New Orleans, LA 70117
$966
Cash flow
22.5%
Cash-on-Cash Return
23.2%
Cap rate
2.8%
Rent to Value Ratio
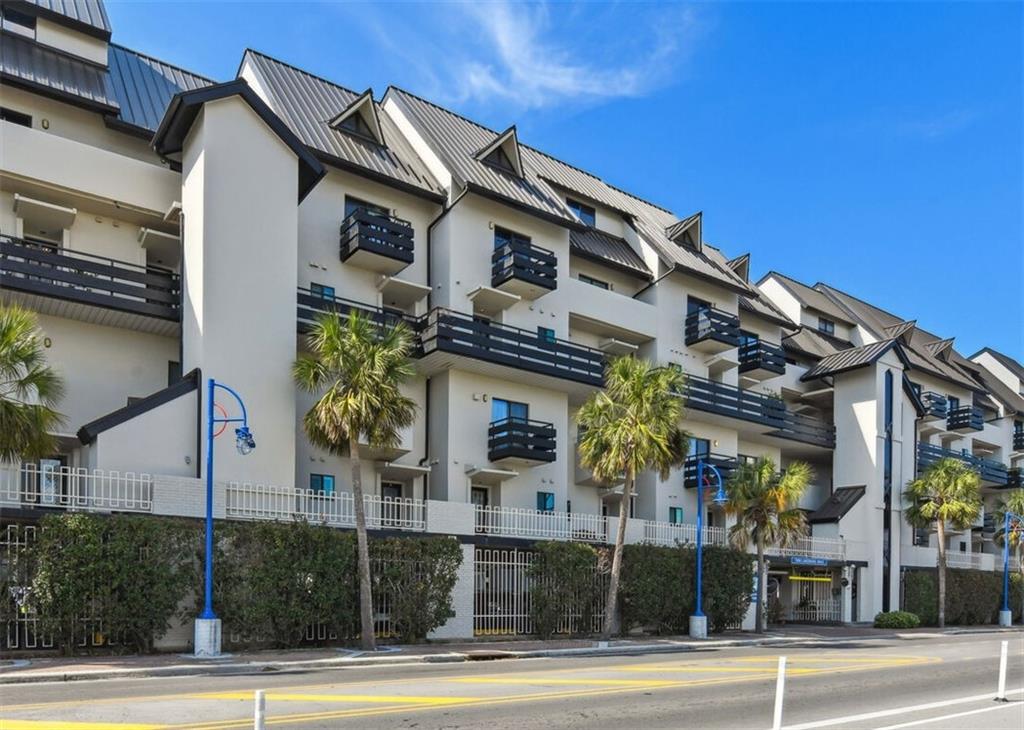
Active
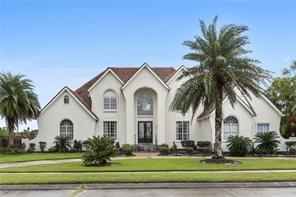
$659,000
5
bds
|
5
ba
|
5,371
sqft
|
built
1995
6011 Eastover Dr, New Orleans, LA 70128
$952
Cash flow
7.5%
Cash-on-Cash Return
7.4%
Cap rate
0.9%
Rent to Value Ratio
1,785 out of 1,792 properties for sale in Orleans Parish County
Limited Results Shown
Create a free account, or log in to reveal all property listings and enjoy the complete experience.
Active
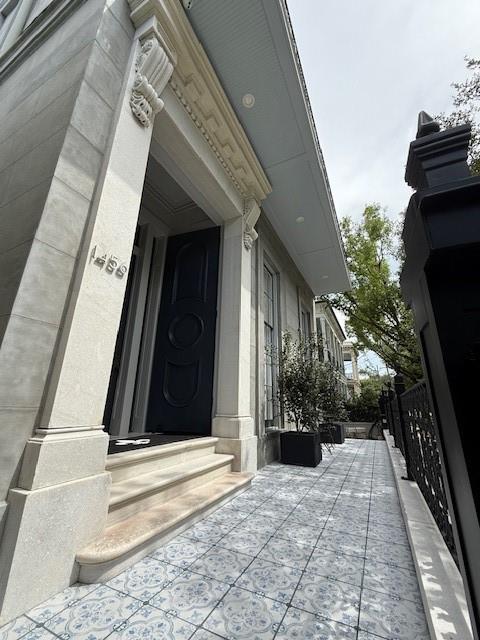
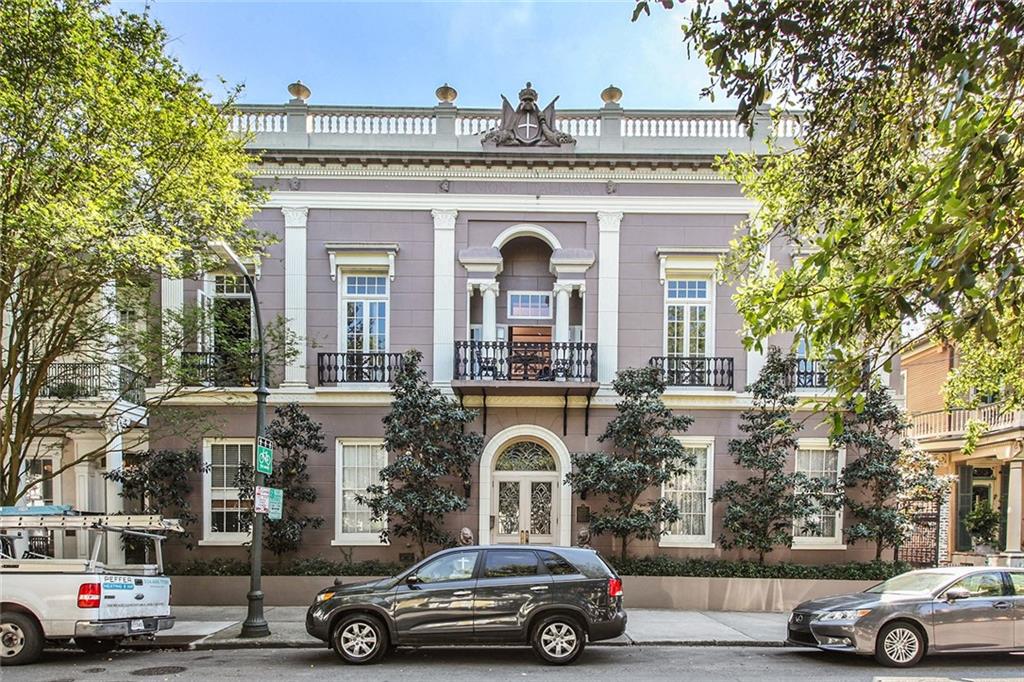
$3,200,000
5
bds
|
6
ba
|
6,405
sqft
|
built
1856
1456 Camp St, New Orleans, LA 70130
$-9,761
Cash flow
-15.9%
Cash-on-Cash Return
2.0%
Cap rate
0.2%
Rent to Value Ratio
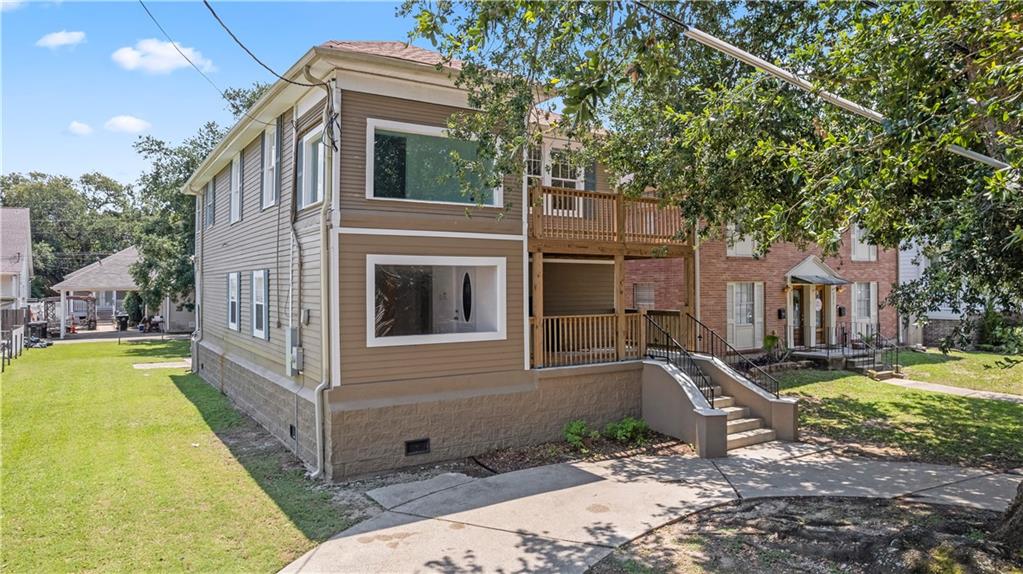
Active
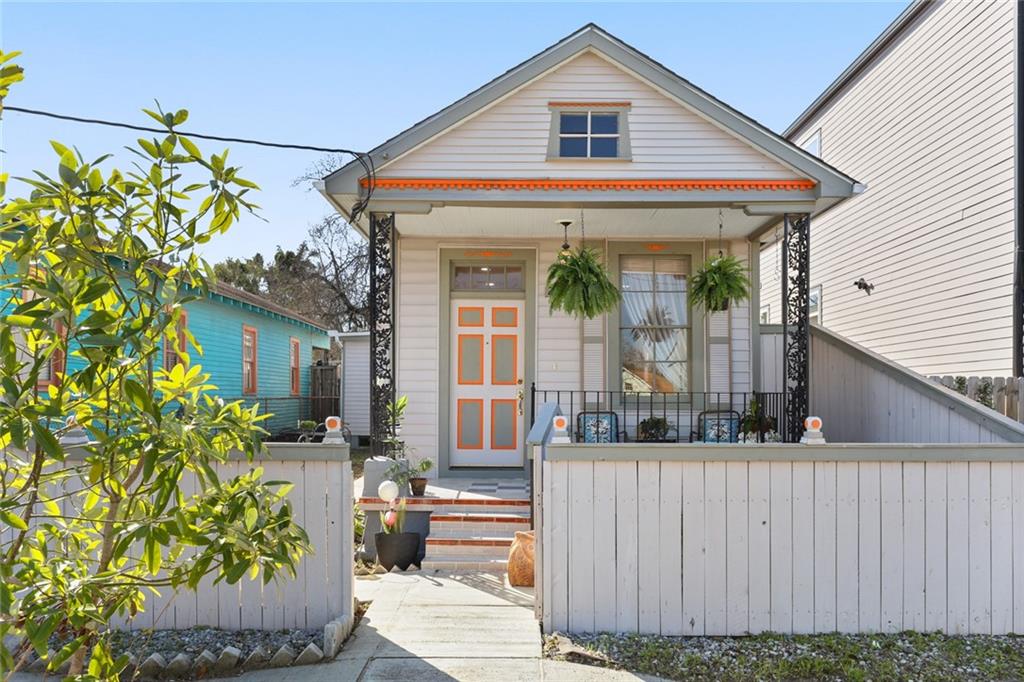
$265,000
3
bds
|
2
ba
|
1,490
sqft
|
built
1925
2720 New Orleans St, New Orleans, LA 70119
$264
Cash flow
5.2%
Cash-on-Cash Return
6.9%
Cap rate
0.8%
Rent to Value Ratio
Active
$239,000
1
bds
|
1
ba
|
700
sqft
|
built
1973
3201 Saint Charles Ave, New Orleans, LA 70115
$-96
Cash flow
-2.1%
Cash-on-Cash Return
5.2%
Cap rate
0.6%
Rent to Value Ratio
Active
$560,000
2
bds
|
2
ba
|
2,062
sqft
|
built
1860
1260 Esplanade Ave, New Orleans, LA 70116
$-511
Cash flow
-4.8%
Cash-on-Cash Return
4.6%
Cap rate
0.6%
Rent to Value Ratio

Active
$750,000
4
bds
|
4
ba
|
3,000
sqft
|
built
1996
6661 Colbert St, New Orleans, LA 70124
$-1,134
Cash flow
-7.9%
Cash-on-Cash Return
3.9%
Cap rate
0.5%
Rent to Value Ratio
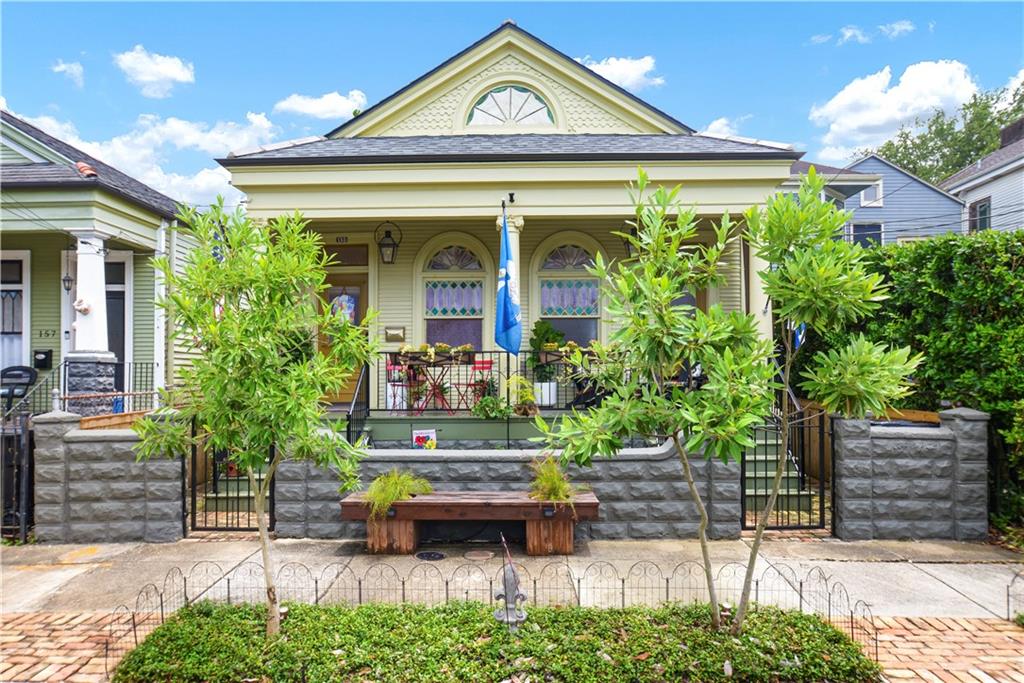
Active
$649,900
3
bds
|
3
ba
|
2,256
sqft
|
built
1902
155 Alix St, New Orleans, LA 70114
$-937
Cash flow
-7.5%
Cash-on-Cash Return
3.9%
Cap rate
0.5%
Rent to Value Ratio
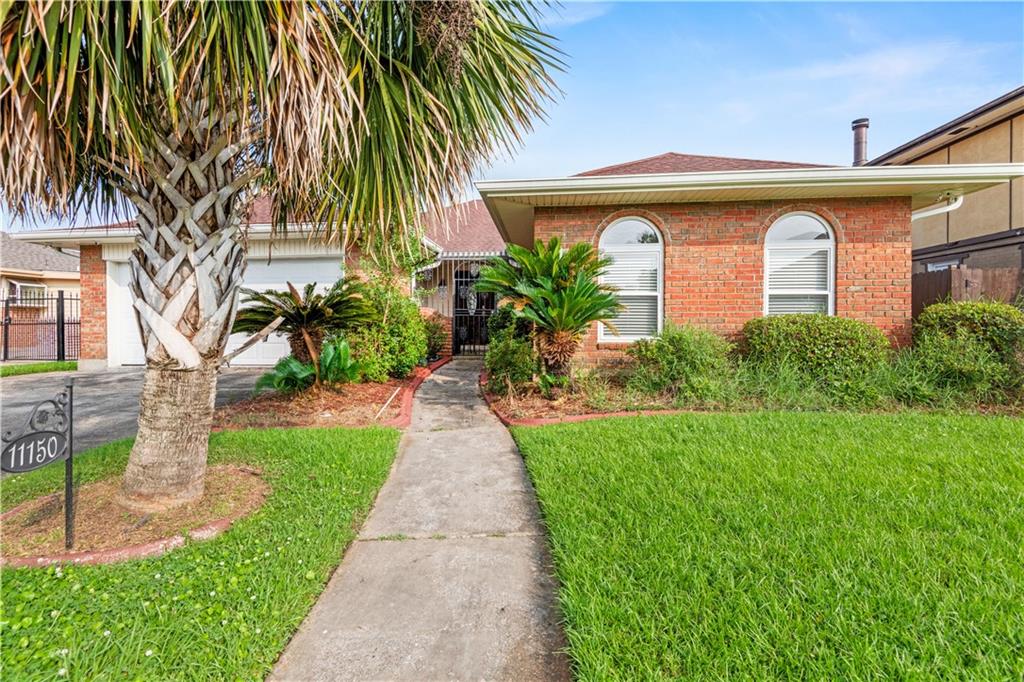
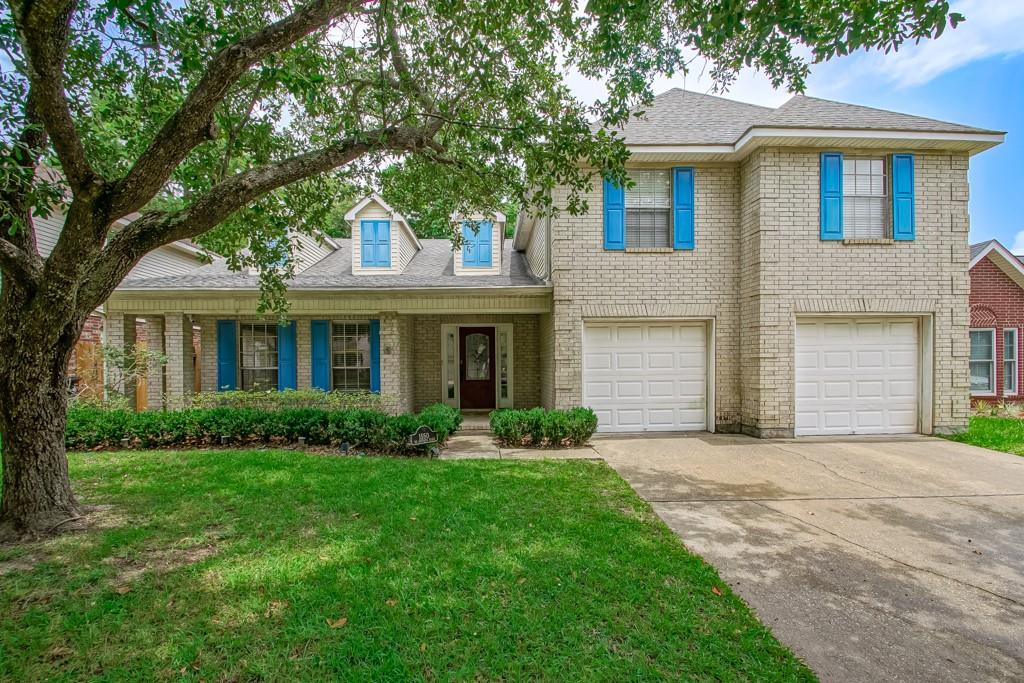
Active
$229,000
3
bds
|
3
ba
|
2,235
sqft
|
built
1980
11150 S Idlewood Ct, New Orleans, LA 70128
$503
Cash flow
11.5%
Cash-on-Cash Return
8.3%
Cap rate
1.0%
Rent to Value Ratio
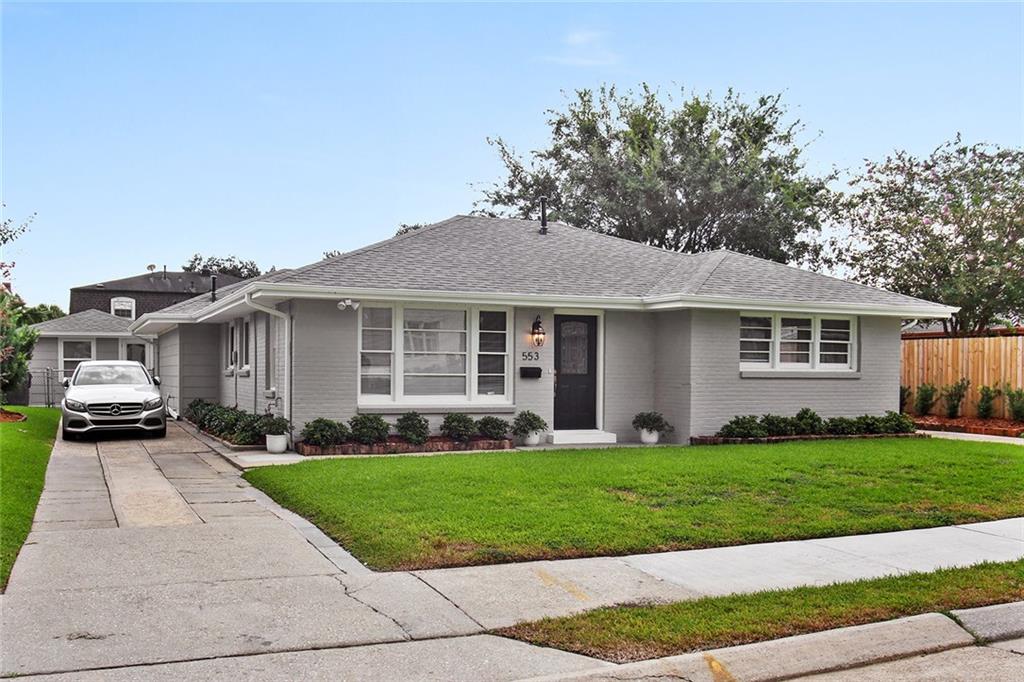
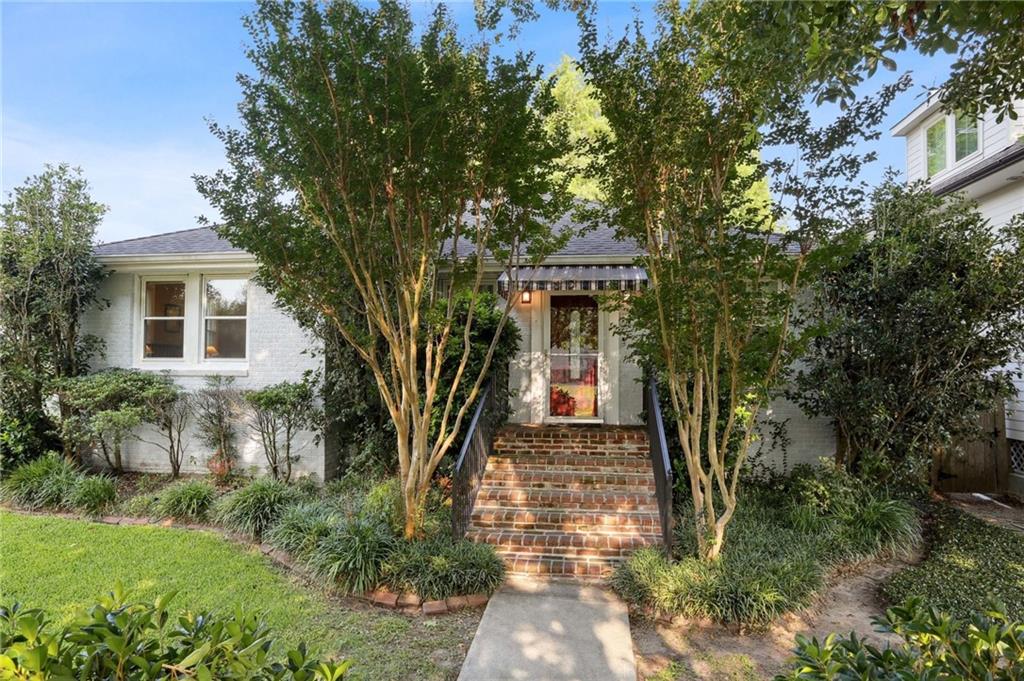
Active
$469,500
3
bds
|
2
ba
|
1,888
sqft
|
built
1958
553 Crystal St, New Orleans, LA 70124
$-497
Cash flow
-5.5%
Cash-on-Cash Return
4.4%
Cap rate
0.5%
Rent to Value Ratio
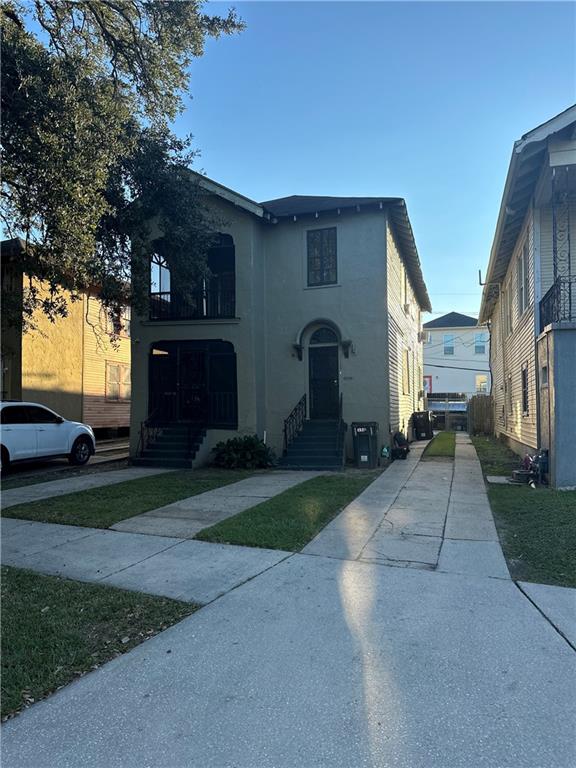
Active
$499,000
6
bds
|
0
ba
|
3,522
sqft
|
built
1933
5524 S Galvez St, New Orleans, LA 70125
$-636
Cash flow
-6.6%
Cash-on-Cash Return
4.1%
Cap rate
0.5%
Rent to Value Ratio
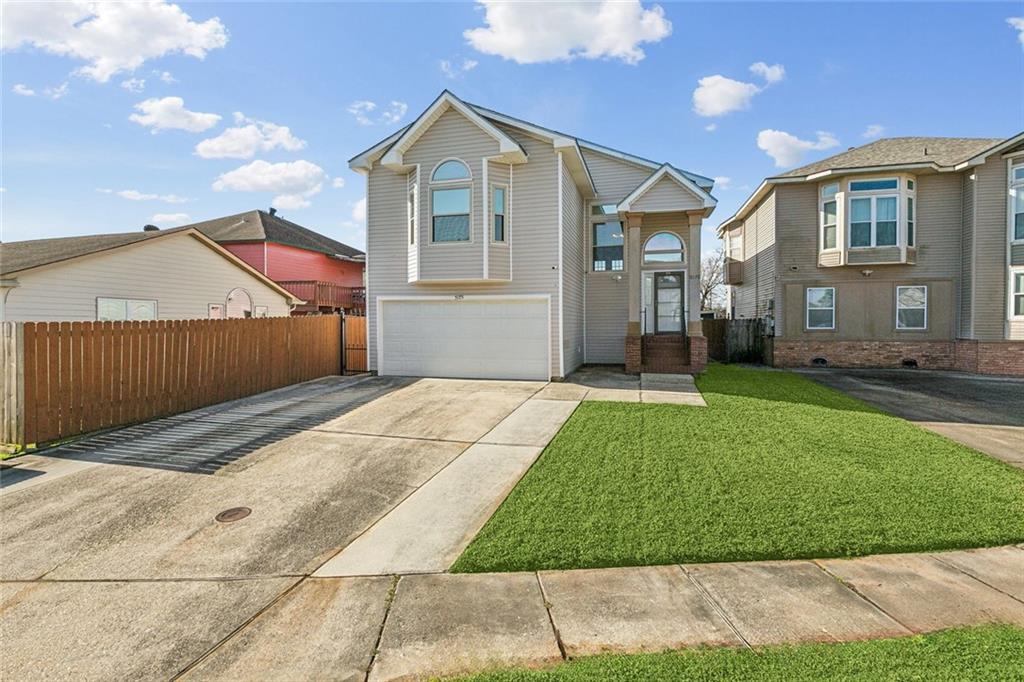
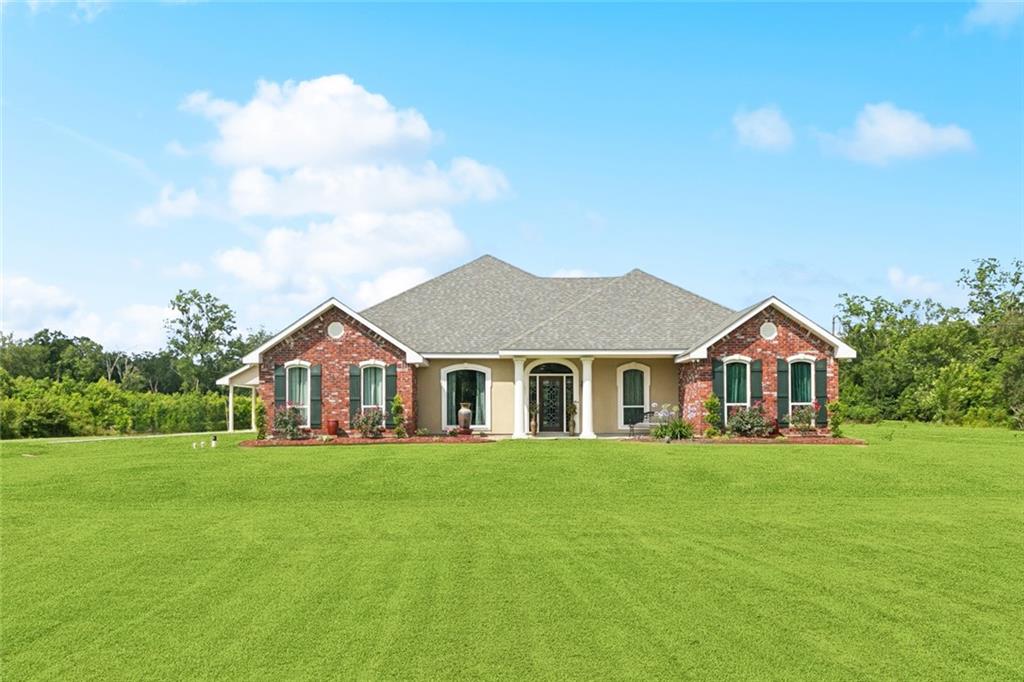
Active
$255,000
3
bds
|
3
ba
|
2,076
sqft
|
built
2000
5175 Westgrove Park, New Orleans, LA 70131
$311
Cash flow
6.4%
Cash-on-Cash Return
7.1%
Cap rate
0.9%
Rent to Value Ratio
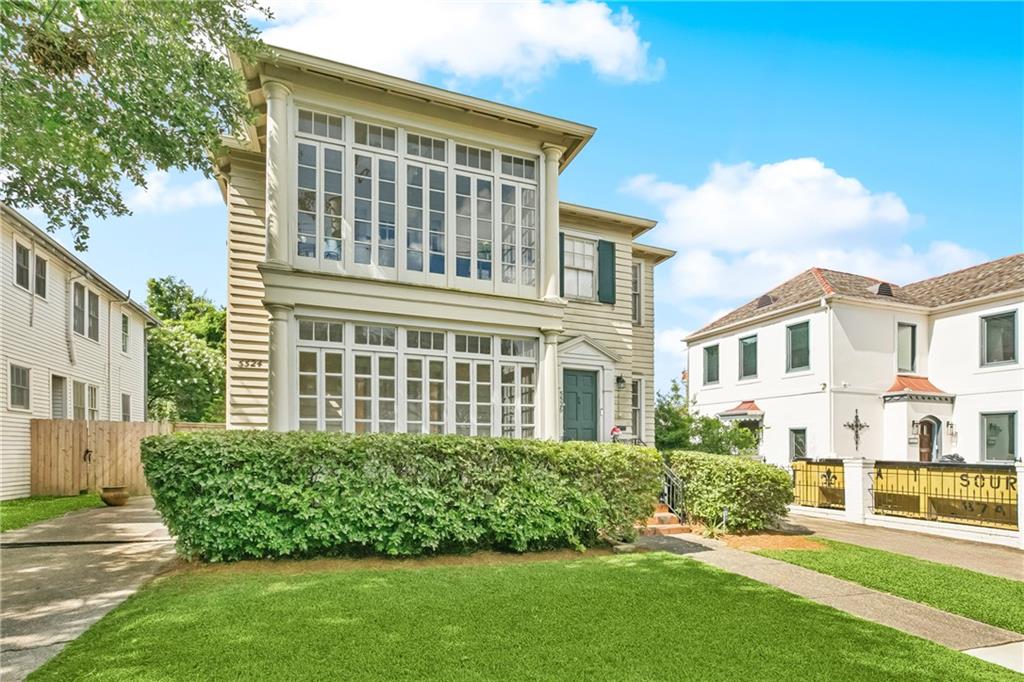
Active under contract
$169,000
4
bds
|
0
ba
|
2,200
sqft
|
built
1954
3526 Louisiana Avenue Pkwy, New Orleans, LA 70125
$166
Cash flow
5.1%
Cash-on-Cash Return
6.9%
Cap rate
0.8%
Rent to Value Ratio
Active
$699,000
3
bds
|
3
ba
|
2,527
sqft
|
built
1997
5830 Marshal Foch St, New Orleans, LA 70124
$-893
Cash flow
-6.7%
Cash-on-Cash Return
4.1%
Cap rate
0.5%
Rent to Value Ratio
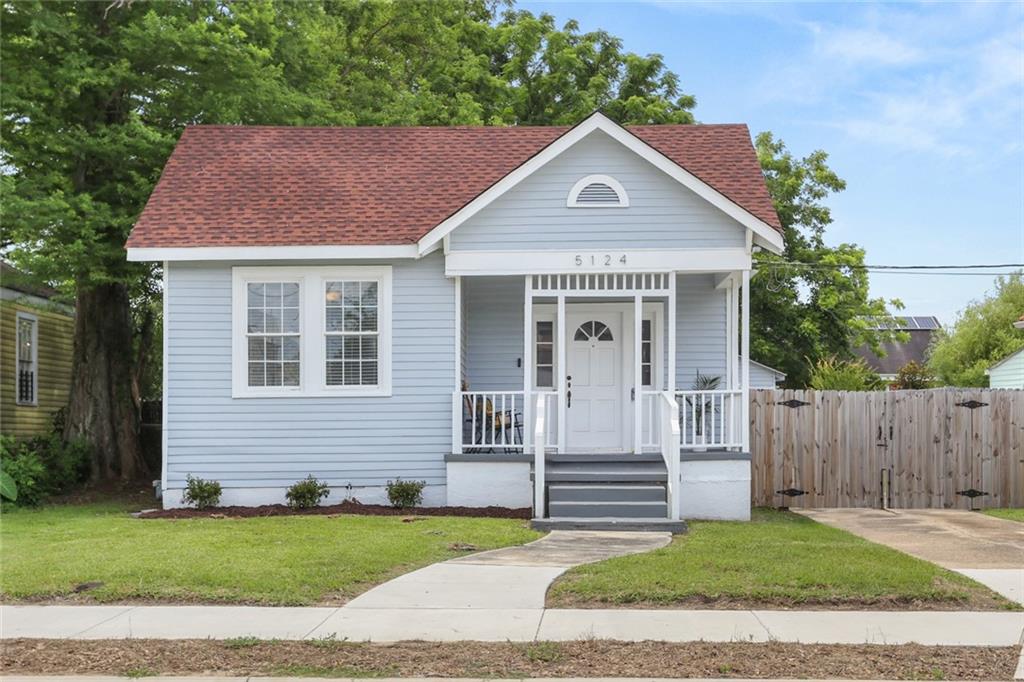
Active
$239,500
2
bds
|
1
ba
|
949
sqft
|
built
1977
5124 Painters St, New Orleans, LA 70122
$247
Cash flow
5.4%
Cash-on-Cash Return
6.9%
Cap rate
0.8%
Rent to Value Ratio
Active
$344,000
4
bds
|
3
ba
|
2,752
sqft
|
built
1980
41 Yellowstone Dr, New Orleans, LA 70131
$363
Cash flow
5.5%
Cash-on-Cash Return
6.9%
Cap rate
0.8%
Rent to Value Ratio
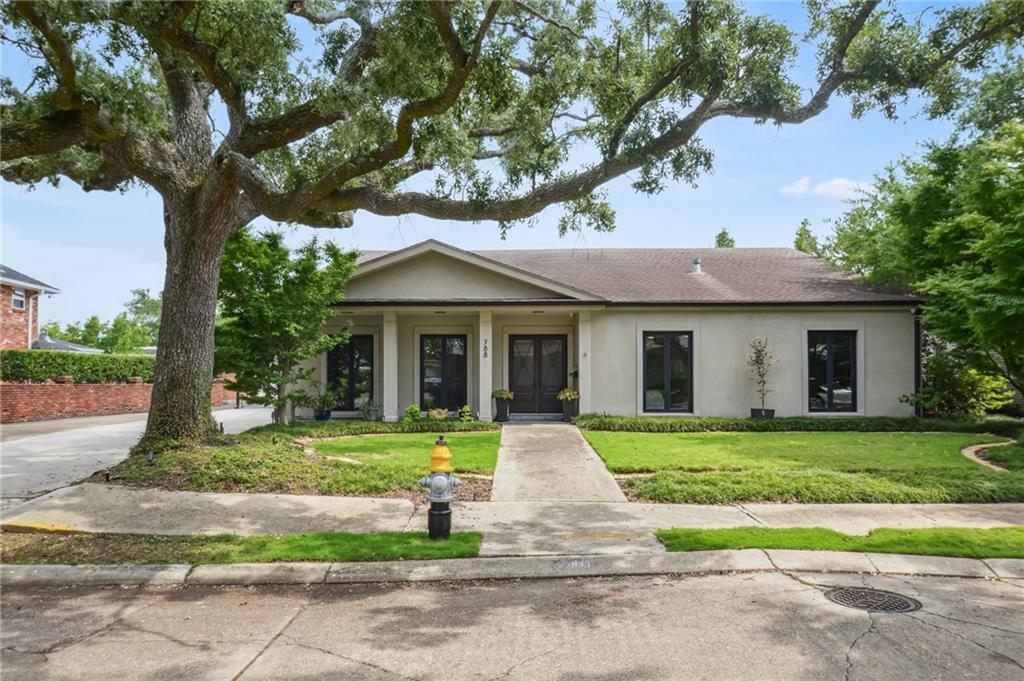
Active
$1,125,000
5
bds
|
5
ba
|
4,723
sqft
|
built
1968
788 Amethyst St, New Orleans, LA 70124
$-356
Cash flow
-1.7%
Cash-on-Cash Return
5.3%
Cap rate
0.6%
Rent to Value Ratio
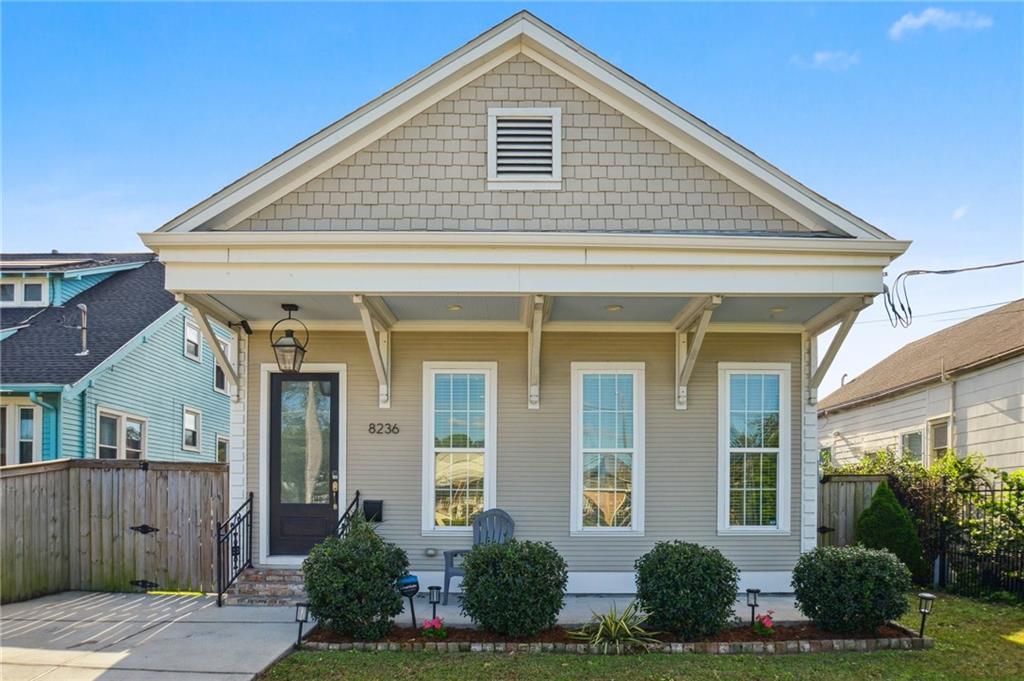
Active under contract
$325,000
3
bds
|
2
ba
|
1,327
sqft
|
built
1946
8236 S Claiborne Ave, New Orleans, LA 70118
$394
Cash flow
6.3%
Cash-on-Cash Return
7.1%
Cap rate
0.9%
Rent to Value Ratio
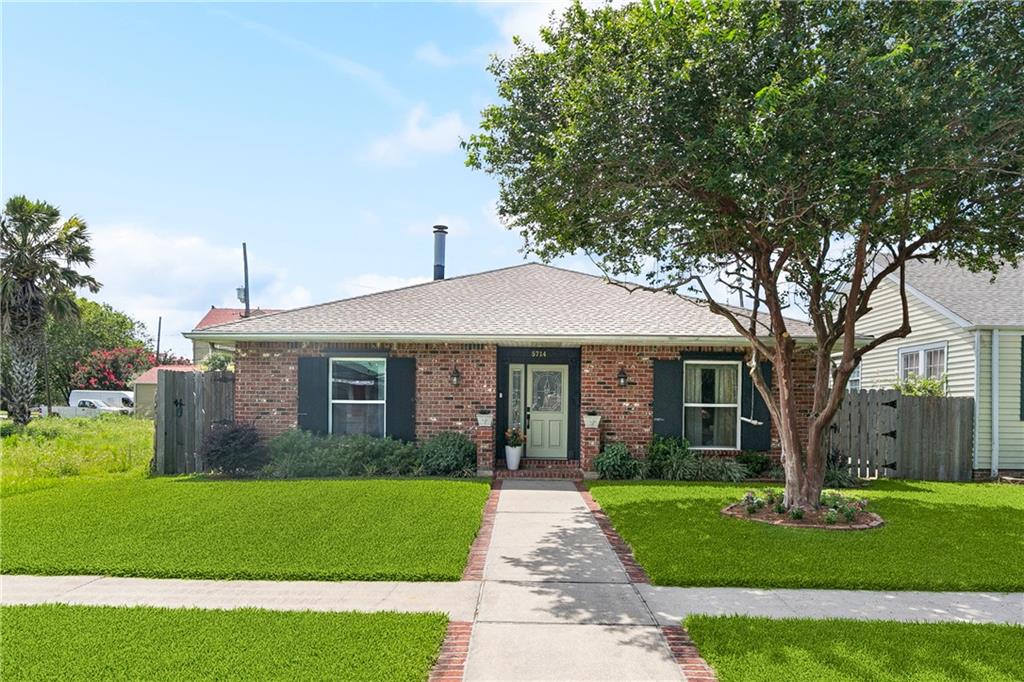
Active
$450,000
4
bds
|
3
ba
|
2,301
sqft
|
built
1999
5714 Vicksburg St, New Orleans, LA 70124
$9
Cash flow
0.1%
Cash-on-Cash Return
5.7%
Cap rate
0.7%
Rent to Value Ratio
Active
$399,000
3
bds
|
2
ba
|
2,148
sqft
|
built
1930
4017 Elba St, New Orleans, LA 70125
$-370
Cash flow
-4.8%
Cash-on-Cash Return
4.6%
Cap rate
0.6%
Rent to Value Ratio
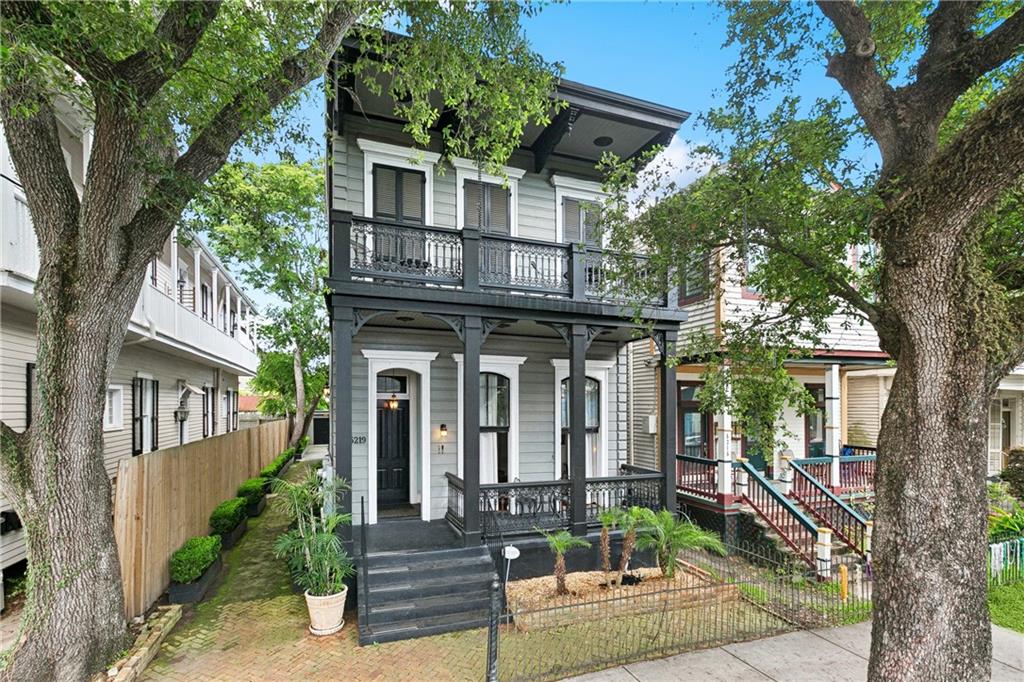
Pending
$275,000
1
bds
|
1
ba
|
645
sqft
|
built
2007
5219 Magazine St, New Orleans, LA 70115
$-59
Cash flow
-1.1%
Cash-on-Cash Return
5.4%
Cap rate
0.7%
Rent to Value Ratio
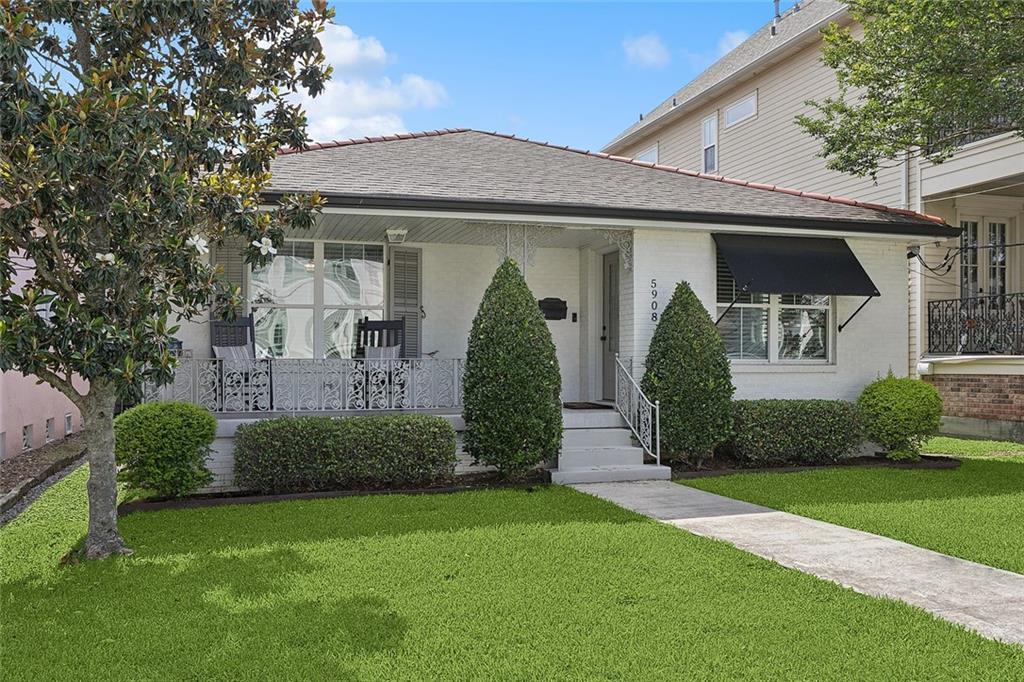
Active
$635,000
4
bds
|
3
ba
|
2,256
sqft
|
built
1975
5908 Louisville St, New Orleans, LA 70124
$-245
Cash flow
-2.0%
Cash-on-Cash Return
5.2%
Cap rate
0.6%
Rent to Value Ratio
Active
$295,000
3
bds
|
2
ba
|
1,408
sqft
|
built
1920
3019 Burdette St, New Orleans, LA 70125
$329
Cash flow
5.8%
Cash-on-Cash Return
7.0%
Cap rate
0.8%
Rent to Value Ratio
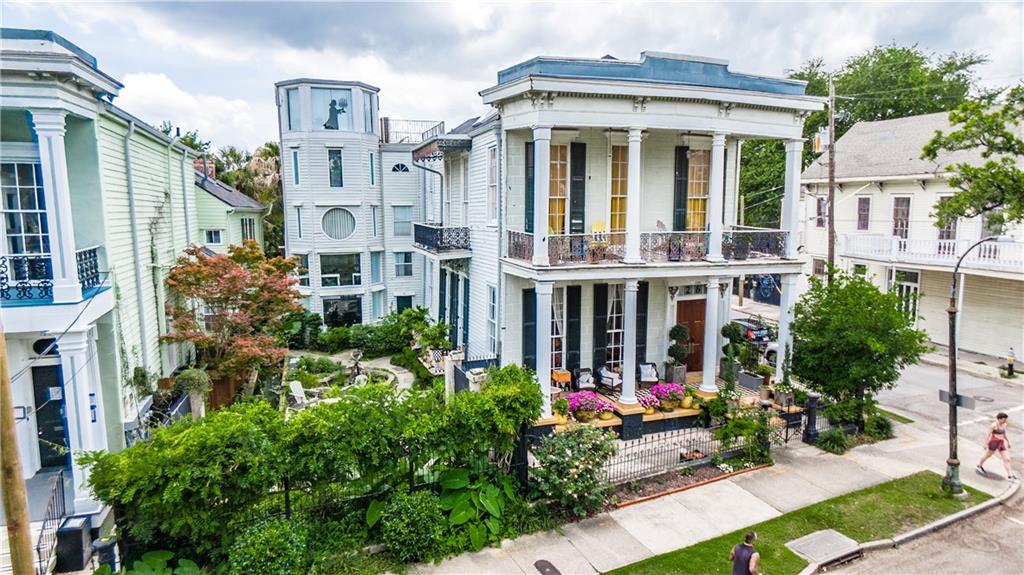
Active
$670,000
4
bds
|
4
ba
|
1,874
sqft
|
built
1910
1322 Prytania St, New Orleans, LA 70130
$-963
Cash flow
-7.5%
Cash-on-Cash Return
4.0%
Cap rate
0.5%
Rent to Value Ratio
Active
$50,000
2
bds
|
2
ba
|
1,428
sqft
|
built
1968
1717 Egania St, New Orleans, LA 70117
$966
Cash flow
22.5%
Cash-on-Cash Return
23.2%
Cap rate
2.8%
Rent to Value Ratio
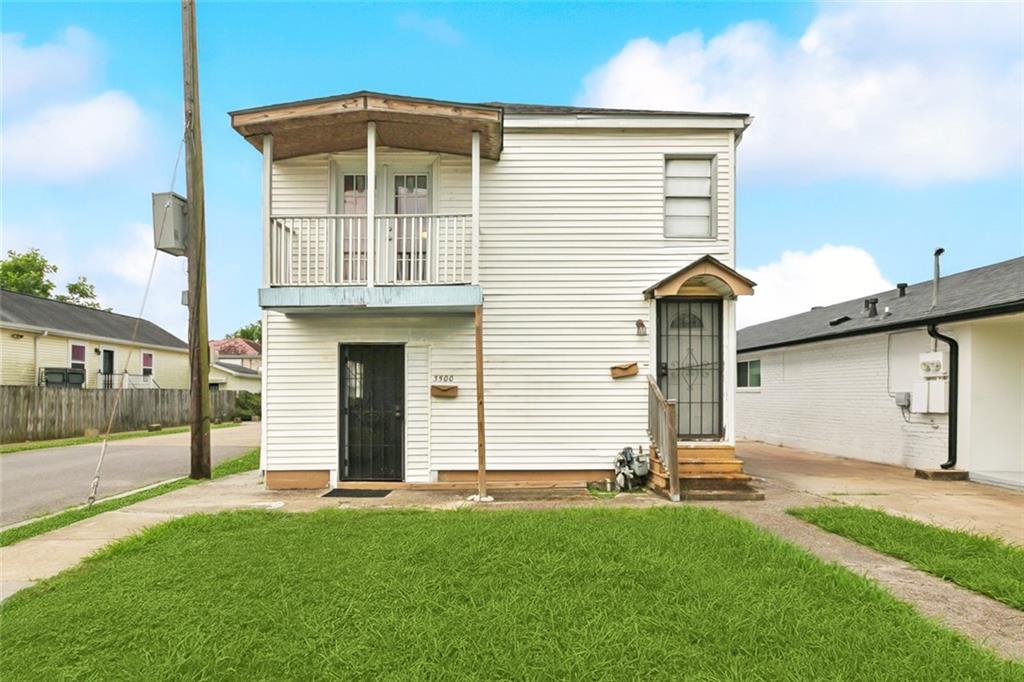
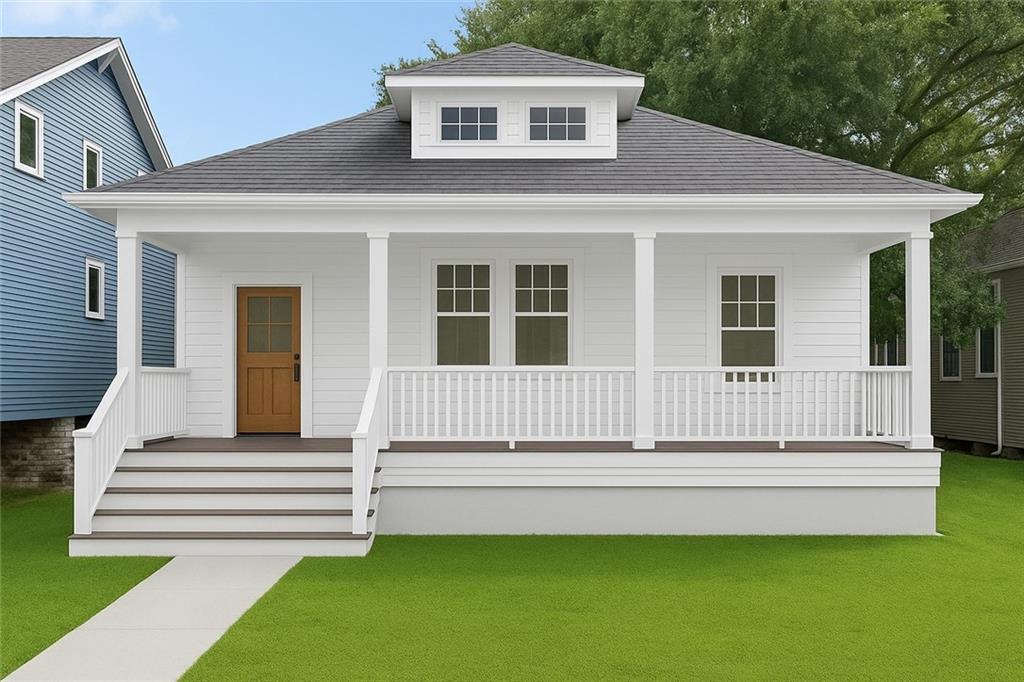
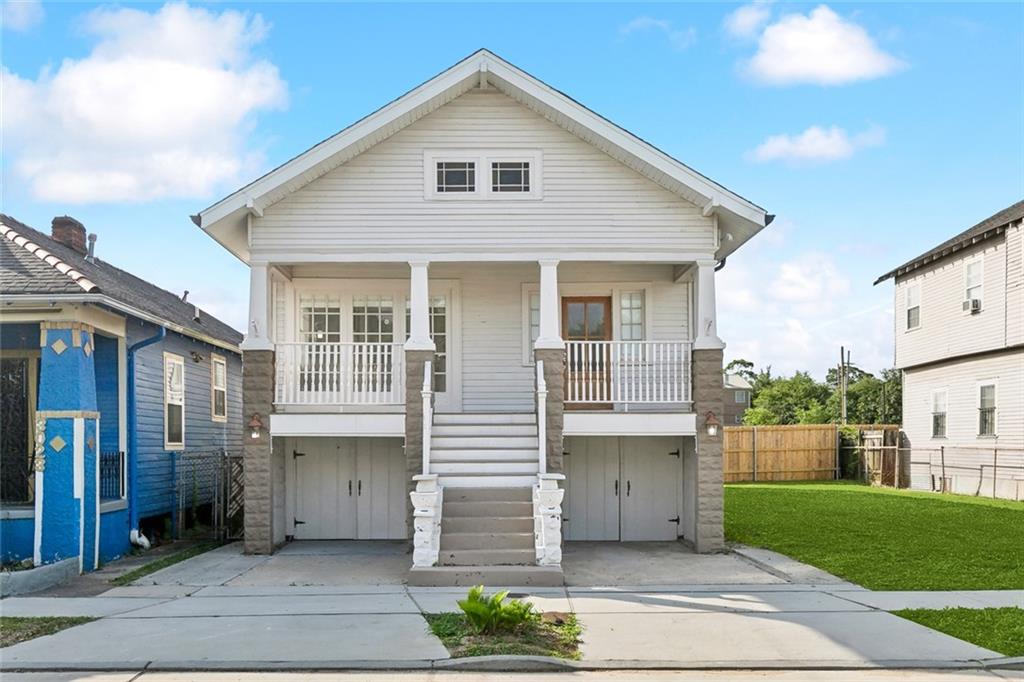
Active
$179,000
4
bds
|
0
ba
|
2,346
sqft
|
built
1950
3500 Clematis St, New Orleans, LA 70122
$257
Cash flow
7.5%
Cash-on-Cash Return
7.4%
Cap rate
0.9%
Rent to Value Ratio
Active
$617,500
3
bds
|
4
ba
|
2,633
sqft
|
built
1983
7300 Lakeshore Dr, New Orleans, LA 70124
$114
Cash flow
1.0%
Cash-on-Cash Return
5.9%
Cap rate
0.7%
Rent to Value Ratio
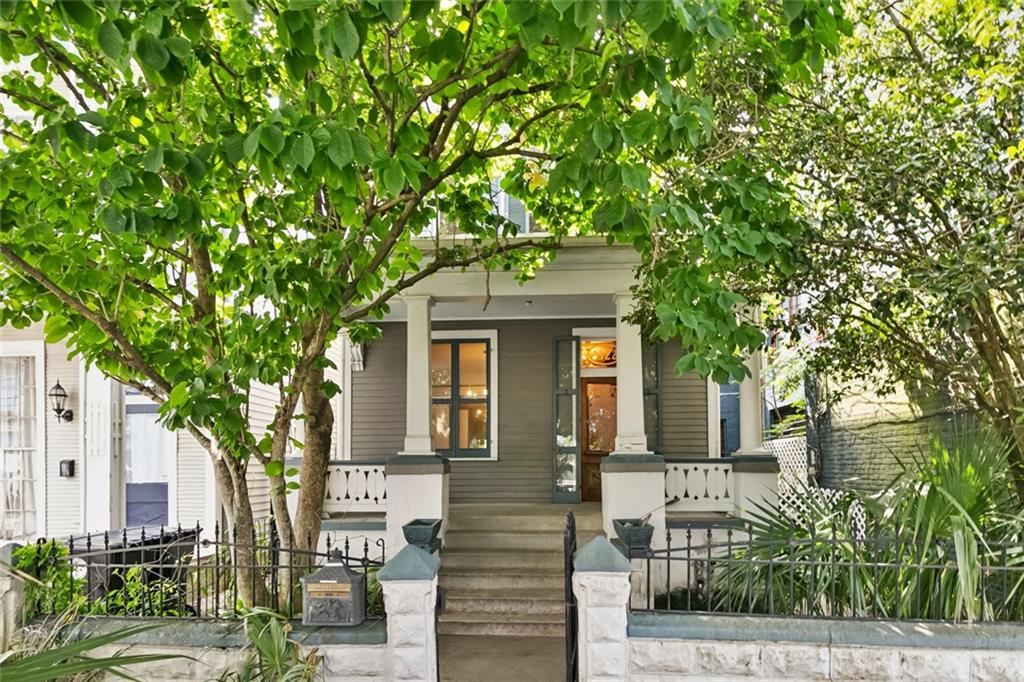
Active
$249,000
4
bds
|
0
ba
|
1,605
sqft
|
built
1920
3717 S Johnson St, New Orleans, LA 70125
$-74
Cash flow
-1.6%
Cash-on-Cash Return
5.3%
Cap rate
0.6%
Rent to Value Ratio
Active
$369,200
4
bds
|
3
ba
|
2,542
sqft
|
built
1986
1550 De Battista Pl, New Orleans, LA 70131
$-22
Cash flow
-0.3%
Cash-on-Cash Return
5.6%
Cap rate
0.7%
Rent to Value Ratio
Active
$749,000
3
bds
|
2
ba
|
2,735
sqft
|
built
2000
11339 Willow Dr, New Orleans, LA 70131
$-1,612
Cash flow
-11.2%
Cash-on-Cash Return
3.1%
Cap rate
0.4%
Rent to Value Ratio
Active
$249,000
3
bds
|
2
ba
|
1,496
sqft
|
built
1916
640 Lizardi St, New Orleans, LA 70117
$-212
Cash flow
-4.4%
Cash-on-Cash Return
4.7%
Cap rate
0.6%
Rent to Value Ratio
Active
$250,000
4
bds
|
0
ba
|
1,634
sqft
|
built
1980
321 Diana St, New Orleans, LA 70114
$-217
Cash flow
-4.5%
Cash-on-Cash Return
4.6%
Cap rate
0.6%
Rent to Value Ratio
Active
$259,900
3
bds
|
3
ba
|
1,326
sqft
|
built
1920
2419 Chippewa St, New Orleans, LA 70130
$12
Cash flow
0.2%
Cash-on-Cash Return
5.7%
Cap rate
0.7%
Rent to Value Ratio
Active
$190,000
3
bds
|
2
ba
|
2,120
sqft
|
built
1965
7401 Poitevent St, New Orleans, LA 70127
$481
Cash flow
13.2%
Cash-on-Cash Return
8.7%
Cap rate
1.1%
Rent to Value Ratio
Active
$449,000
3
bds
|
3
ba
|
1,070
sqft
|
built
1867
1020 Esplanade Ave, New Orleans, LA 70116
$-745
Cash flow
-8.7%
Cash-on-Cash Return
3.7%
Cap rate
0.4%
Rent to Value Ratio
Active
$550,000
4
bds
|
3
ba
|
2,610
sqft
|
built
1941
7033 Wuerpel St, New Orleans, LA 70124
$-119
Cash flow
-1.1%
Cash-on-Cash Return
5.4%
Cap rate
0.7%
Rent to Value Ratio
Active
$475,000
3
bds
|
2
ba
|
1,430
sqft
|
built
1955
6550 General Diaz St, New Orleans, LA 70124
$-247
Cash flow
-2.7%
Cash-on-Cash Return
5.1%
Cap rate
0.6%
Rent to Value Ratio
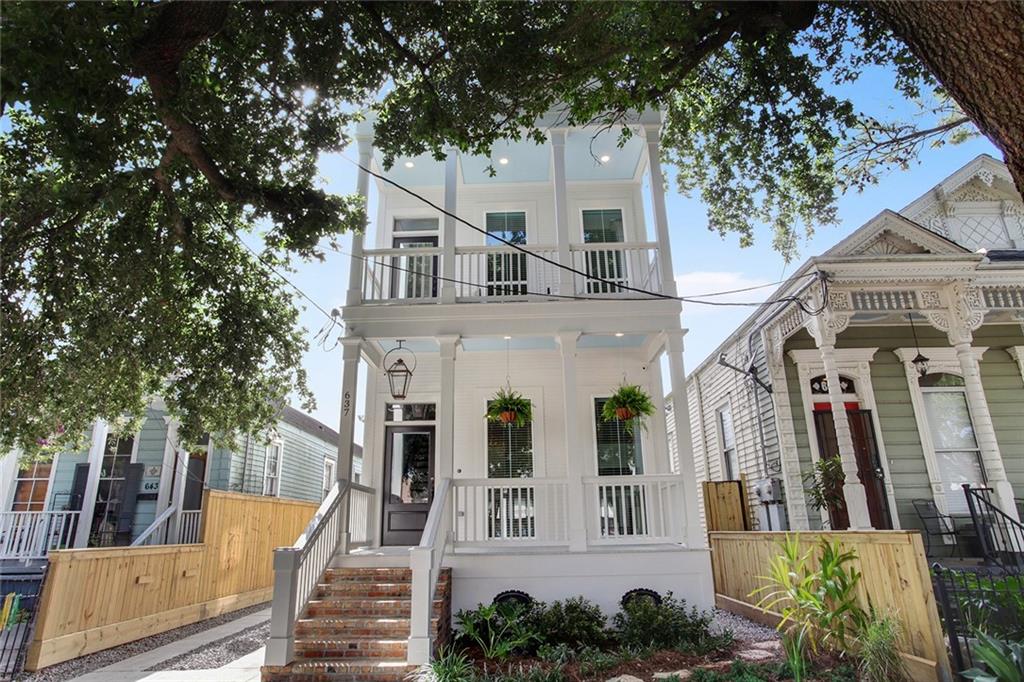
Active
$624,900
5
bds
|
4
ba
|
2,720
sqft
|
built
2019
637 S Dupre St, New Orleans, LA 70119
$-1,232
Cash flow
-10.3%
Cash-on-Cash Return
3.3%
Cap rate
0.4%
Rent to Value Ratio
Active
$1,850,000
5
bds
|
7
ba
|
3,378
sqft
|
built
2018
2538 N Rampart St, New Orleans, LA 70117
$-4,822
Cash flow
-13.6%
Cash-on-Cash Return
2.6%
Cap rate
0.3%
Rent to Value Ratio
Active
$315,000
3
bds
|
2
ba
|
1,670
sqft
|
built
2022
2828 Mistletoe St, New Orleans, LA 70118
$-732
Cash flow
-12.1%
Cash-on-Cash Return
2.9%
Cap rate
0.3%
Rent to Value Ratio
Active
$399,000
3
bds
|
2
ba
|
1,200
sqft
|
built
1925
5621 Tchoupitoulas St, New Orleans, LA 70115
$-508
Cash flow
-6.6%
Cash-on-Cash Return
4.2%
Cap rate
0.5%
Rent to Value Ratio
Active
$659,000
5
bds
|
5
ba
|
5,371
sqft
|
built
1995
6011 Eastover Dr, New Orleans, LA 70128
$952
Cash flow
7.5%
Cash-on-Cash Return
7.4%
Cap rate
0.9%
Rent to Value Ratio