Orleans Parish County Investment Properties for Sale
Browse homes for sale and investment properties in Orleans Parish County. Refine your search by price, property type, or more.
Best cash flowing properties in Orleans Parish County

Active
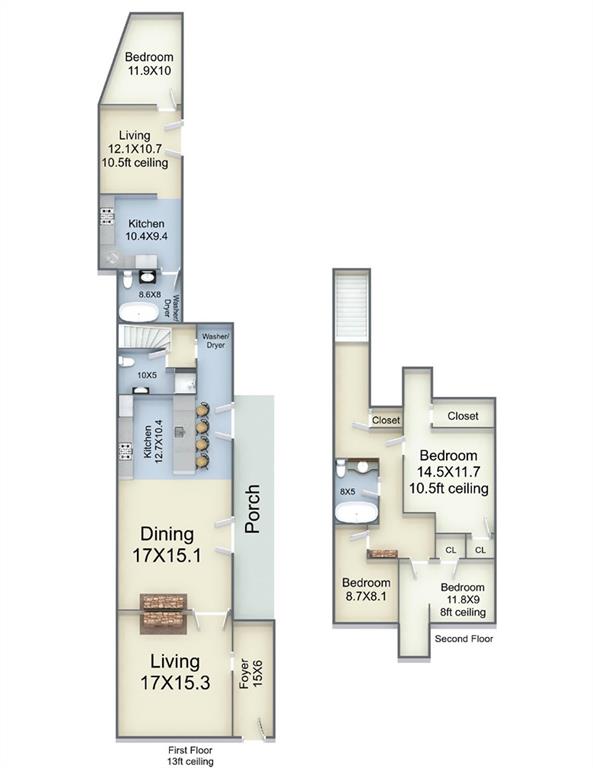
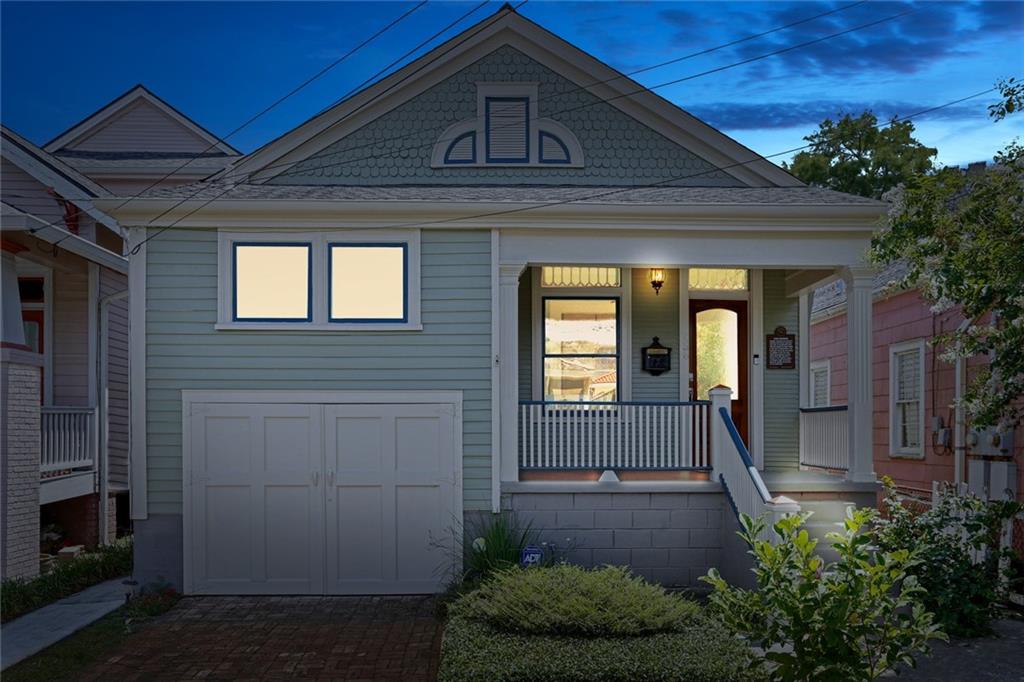
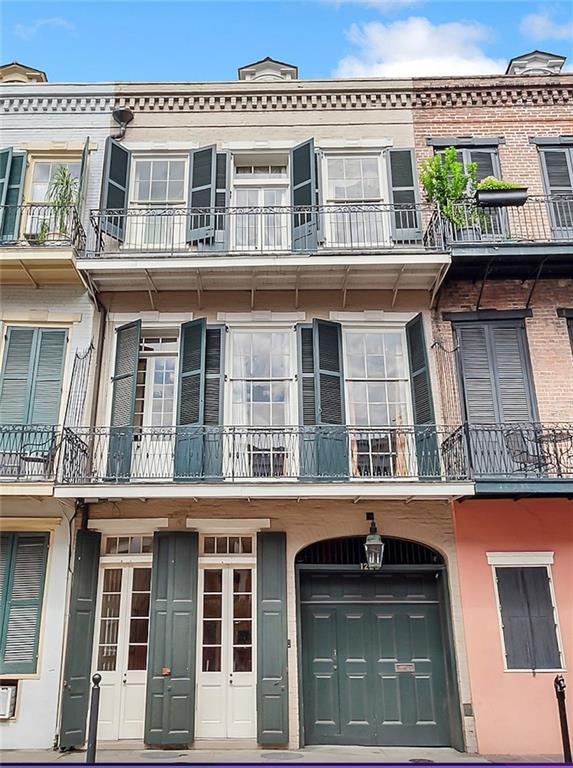
$125,000
1
bds
|
1
ba
|
841
sqft
|
built
1893
620 Decatur St, New Orleans, LA 70130
$995
Cash flow
41.5%
Cash-on-Cash Return
15.2%
Cap rate
1.8%
Rent to Value Ratio
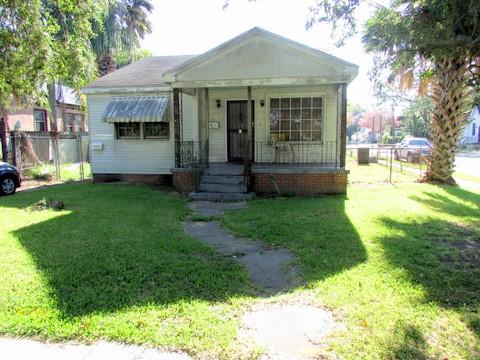
Active
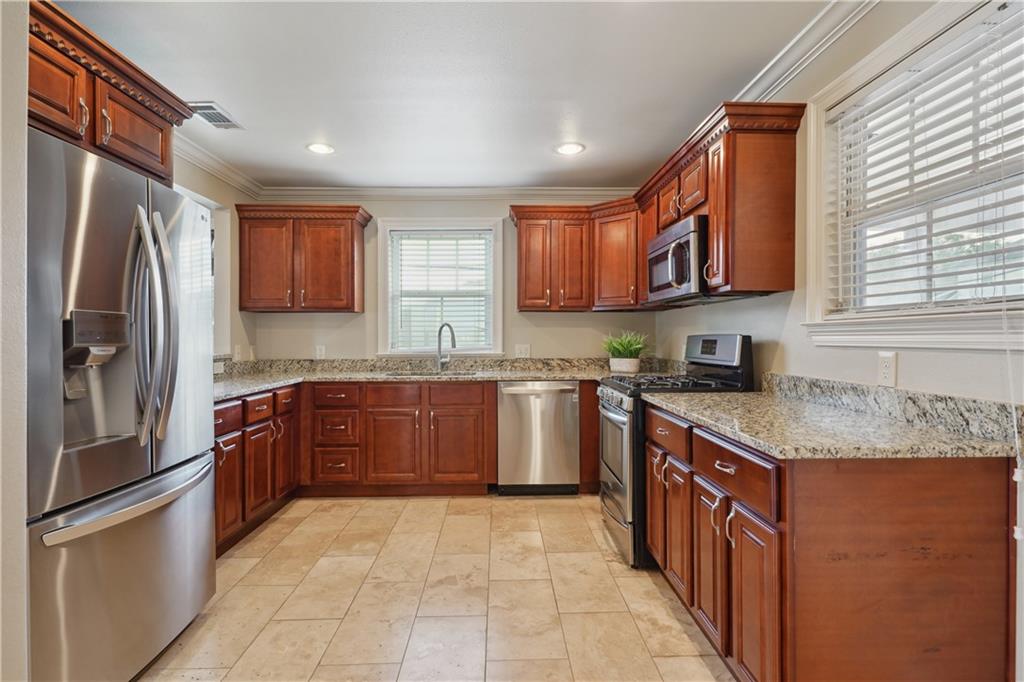
$227,500
3
bds
|
2
ba
|
2,420
sqft
|
built
1959
5942 Warwick Ct, New Orleans, LA 70131
$648
Cash flow
14.9%
Cash-on-Cash Return
9.1%
Cap rate
1.1%
Rent to Value Ratio
1,790 out of 1,797 properties for sale in Orleans Parish County
Limited Results Shown
Create a free account, or log in to reveal all property listings and enjoy the complete experience.
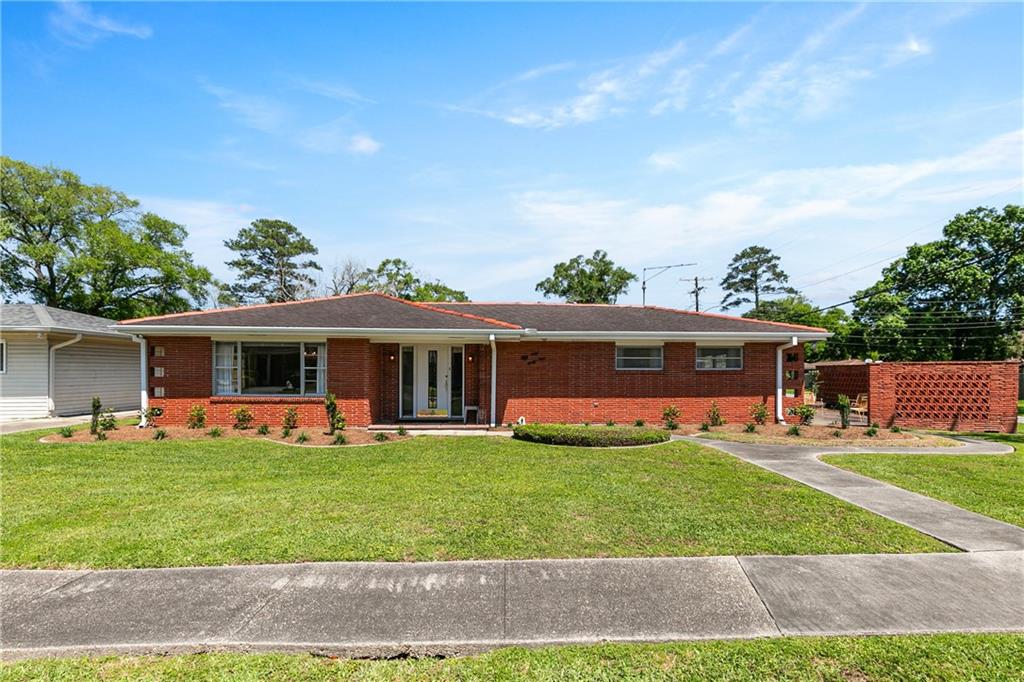
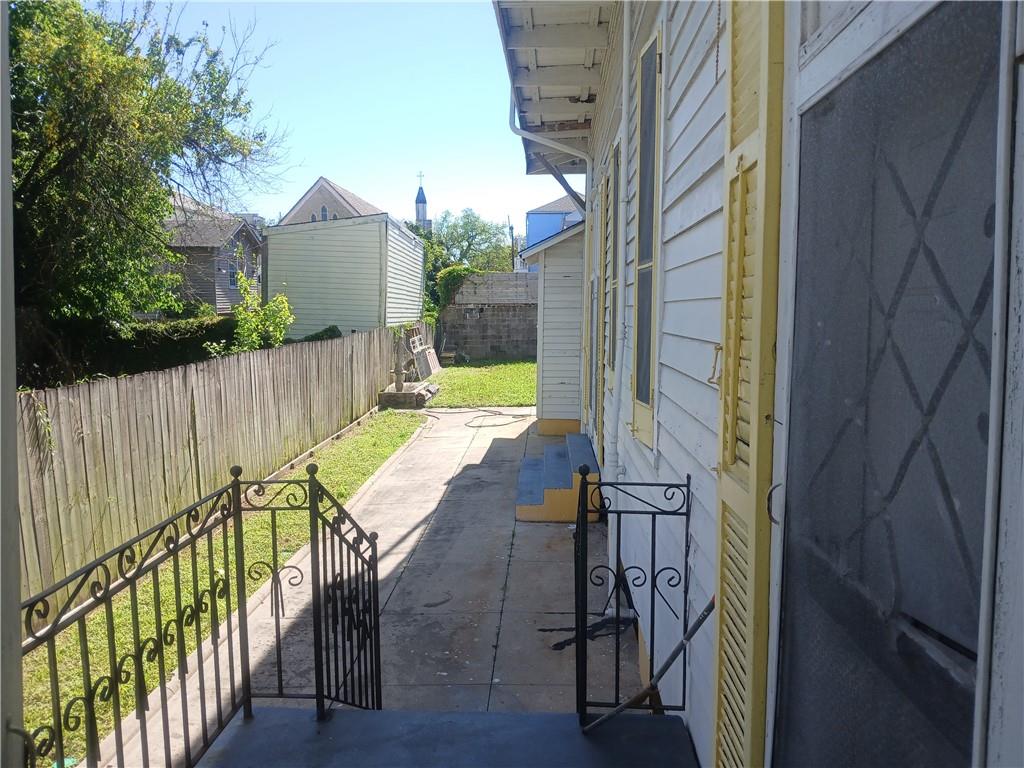
Active
$340,000
2
bds
|
3
ba
|
1,100
sqft
|
built
1946
606 N Murat St, New Orleans, LA 70119
$-91
Cash flow
-1.4%
Cash-on-Cash Return
5.4%
Cap rate
0.6%
Rent to Value Ratio
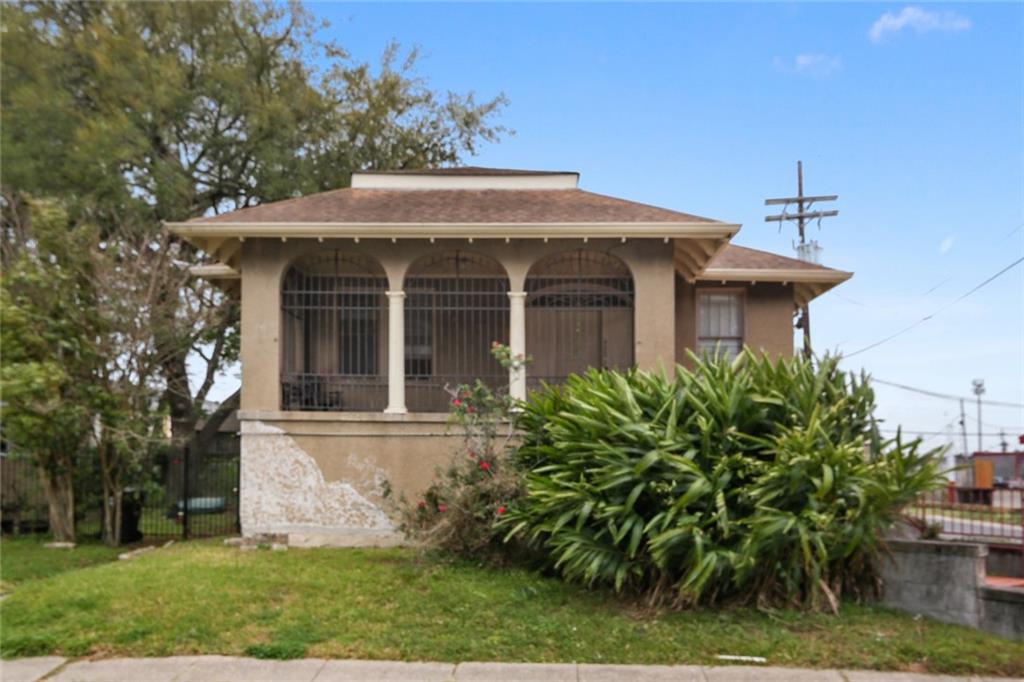
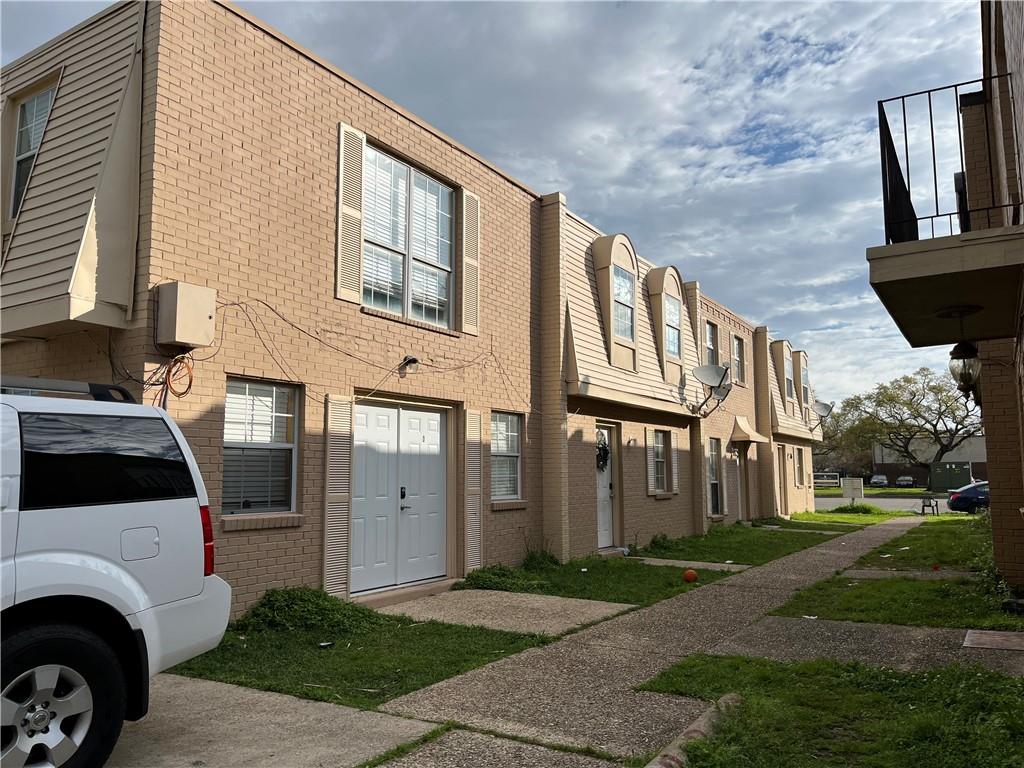
Active under contract
$269,000
6
bds
|
0
ba
|
3,864
sqft
|
built
1950
4001 Elba St, New Orleans, LA 70125
$-31
Cash flow
-0.6%
Cash-on-Cash Return
5.5%
Cap rate
0.7%
Rent to Value Ratio
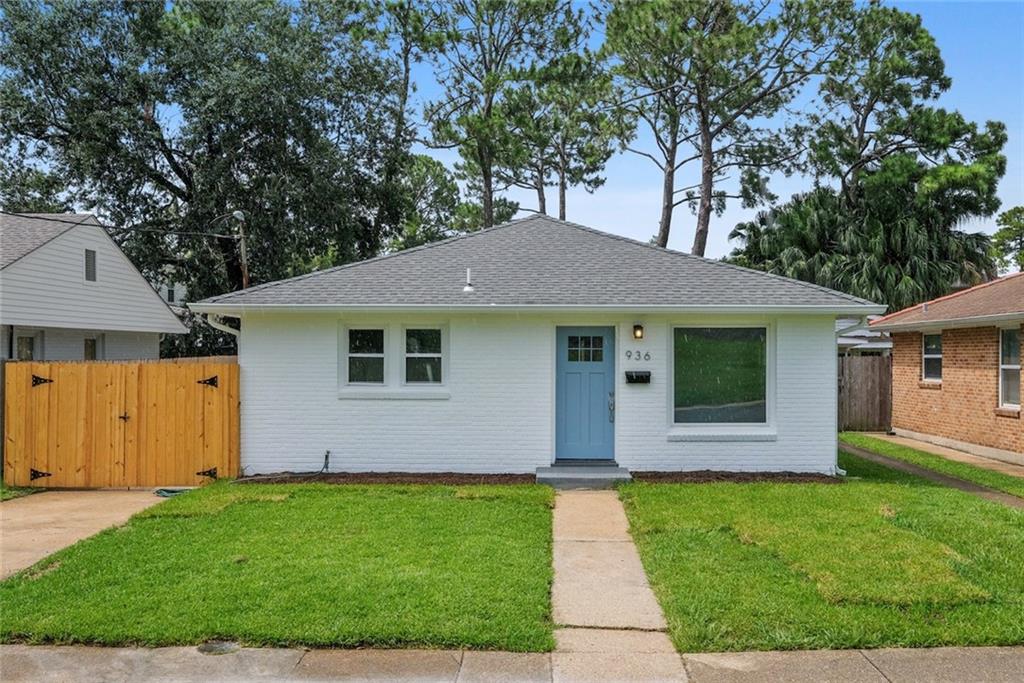
Active
$329,000
2
bds
|
1
ba
|
986
sqft
|
built
1959
936 Florida Blvd, New Orleans, LA 70124
$-39
Cash flow
-0.6%
Cash-on-Cash Return
5.5%
Cap rate
0.7%
Rent to Value Ratio
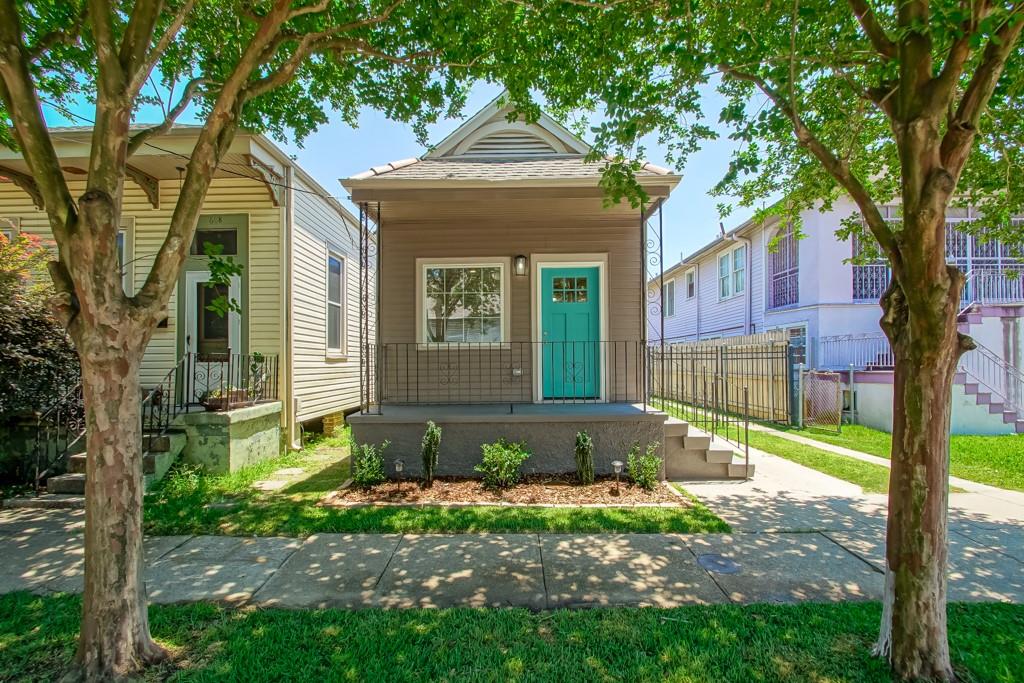
Active
$249,000
3
bds
|
3
ba
|
1,305
sqft
|
built
1924
2410 Freret St, New Orleans, LA 70113
$64
Cash flow
1.3%
Cash-on-Cash Return
6.0%
Cap rate
0.7%
Rent to Value Ratio
Active
$525,000
2
bds
|
3
ba
|
1,222
sqft
|
built
1773
633 Tchoupitoulas St, New Orleans, LA 70130
$-345
Cash flow
-3.4%
Cash-on-Cash Return
4.9%
Cap rate
0.6%
Rent to Value Ratio
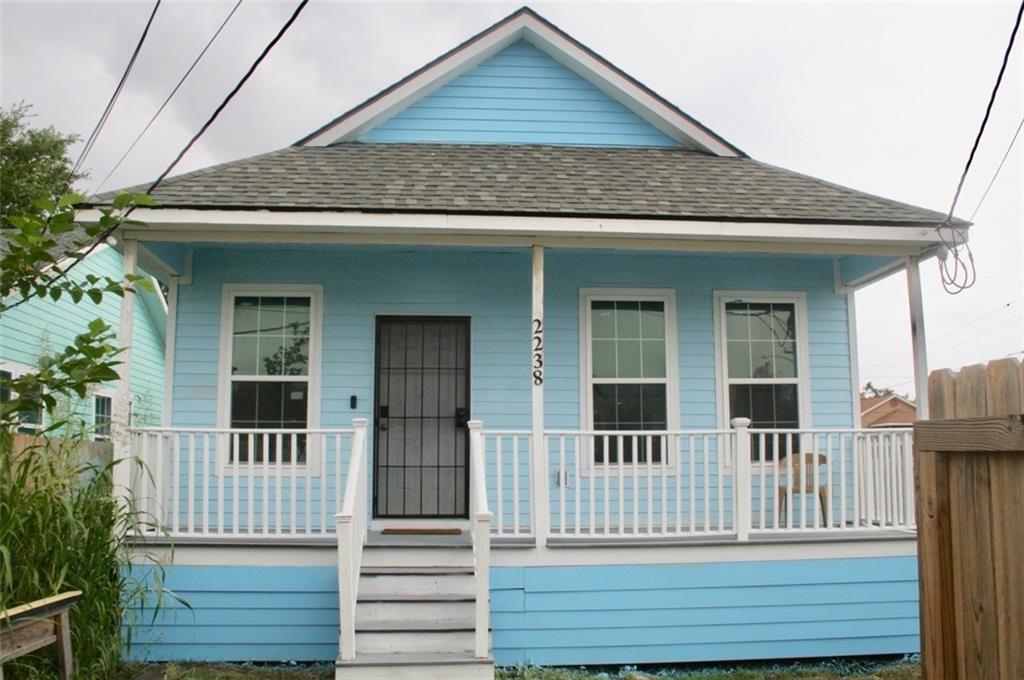
Active
$190,000
3
bds
|
2
ba
|
1,428
sqft
|
built
2022
2238 Bartholomew St, New Orleans, LA 70117
$481
Cash flow
13.2%
Cash-on-Cash Return
8.7%
Cap rate
1.1%
Rent to Value Ratio
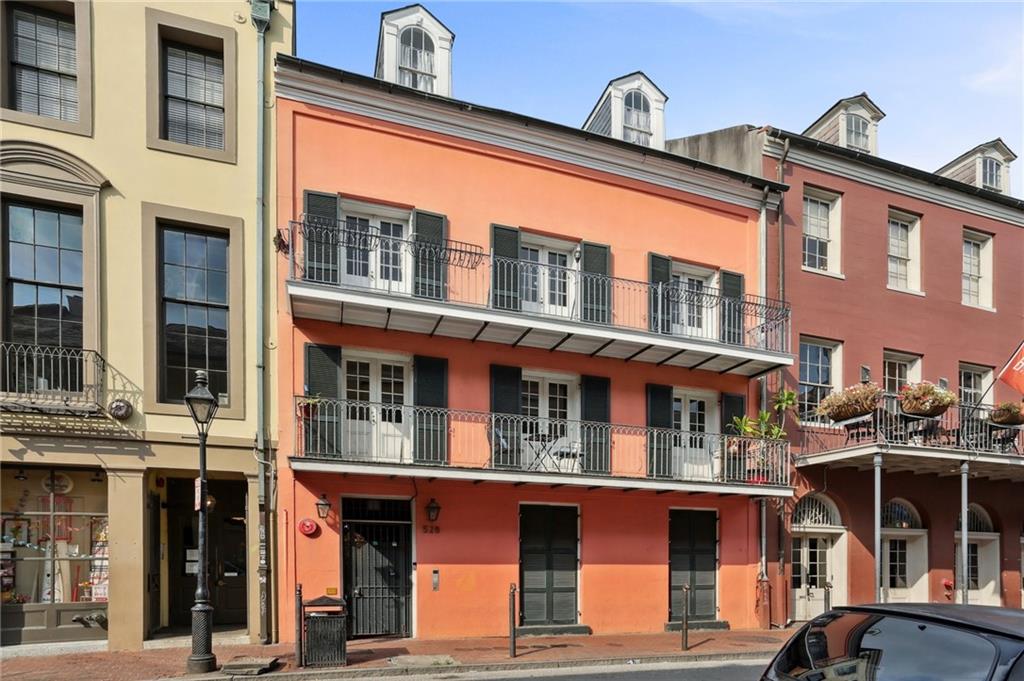
Active
$695,000
3
bds
|
3
ba
|
1,519
sqft
|
built
1919
528 Saint Louis St, New Orleans, LA 70130
$-805
Cash flow
-6.0%
Cash-on-Cash Return
4.3%
Cap rate
0.5%
Rent to Value Ratio
Active
$565,000
2
bds
|
2
ba
|
2,365
sqft
|
built
2001
7038 Milne Blvd, New Orleans, LA 70124
$-190
Cash flow
-1.8%
Cash-on-Cash Return
5.3%
Cap rate
0.6%
Rent to Value Ratio
Active
$225,000
4
bds
|
2
ba
|
1,757
sqft
|
built
1980
11120 Woodvine Ln, New Orleans, LA 70128
$315
Cash flow
7.3%
Cash-on-Cash Return
7.4%
Cap rate
0.9%
Rent to Value Ratio
Active
$345,900
2
bds
|
2
ba
|
965
sqft
|
built
1910
760 Magazine St, New Orleans, LA 70130
$88
Cash flow
1.3%
Cash-on-Cash Return
6.0%
Cap rate
0.7%
Rent to Value Ratio
Active
$1,295,000
7
bds
|
0
ba
|
12,500
sqft
|
built
1920
3037 Royal St, New Orleans, LA 70117
$-4,196
Cash flow
-16.9%
Cash-on-Cash Return
1.8%
Cap rate
0.2%
Rent to Value Ratio
Active
$227,500
3
bds
|
2
ba
|
2,420
sqft
|
built
1959
5942 Warwick Ct, New Orleans, LA 70131
$648
Cash flow
14.9%
Cash-on-Cash Return
9.1%
Cap rate
1.1%
Rent to Value Ratio
Active
$169,900
2
bds
|
1
ba
|
768
sqft
|
built
1951
1633 N Prieur St, New Orleans, LA 70116
$162
Cash flow
5.0%
Cash-on-Cash Return
6.8%
Cap rate
0.8%
Rent to Value Ratio
Active
$299,000
2
bds
|
1
ba
|
1,152
sqft
|
built
1932
2104 Lowerline St, New Orleans, LA 70118
$-35
Cash flow
-0.6%
Cash-on-Cash Return
5.5%
Cap rate
0.7%
Rent to Value Ratio
Active
$729,000
2
bds
|
2
ba
|
1,420
sqft
|
built
1922
620 Decatur St, New Orleans, LA 70130
$-759
Cash flow
-5.4%
Cash-on-Cash Return
4.4%
Cap rate
0.5%
Rent to Value Ratio
Active
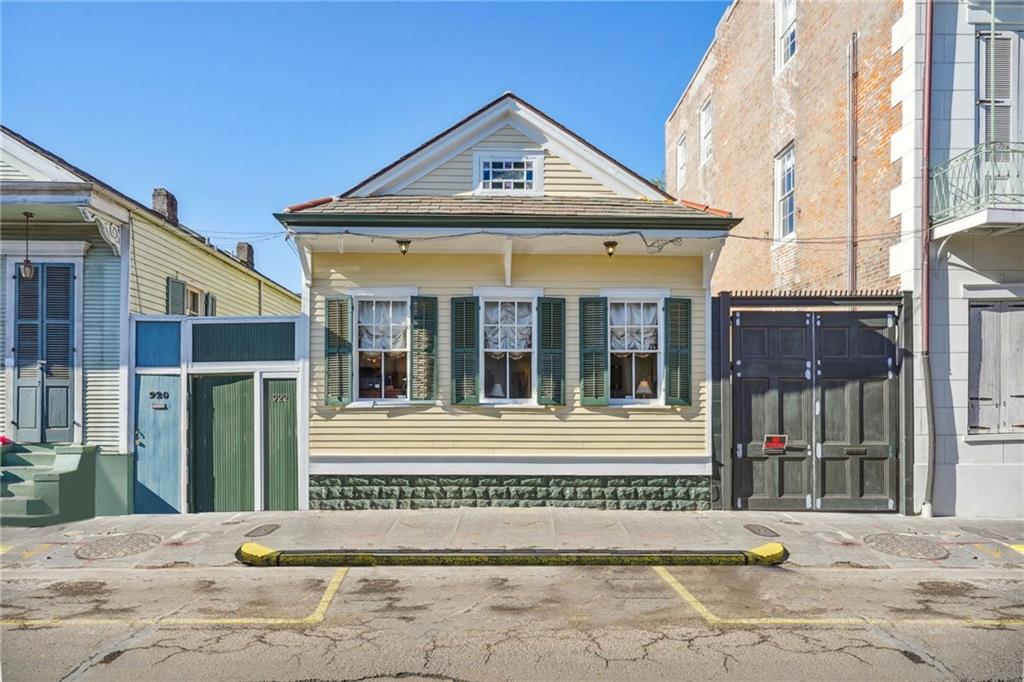
$185,000
1
bds
|
1
ba
|
438
sqft
|
built
1871
920 Saint Louis St, New Orleans, LA 70112
$436
Cash flow
12.3%
Cash-on-Cash Return
8.5%
Cap rate
1.0%
Rent to Value Ratio
Active
$399,000
4
bds
|
3
ba
|
2,248
sqft
|
built
1840
1915 Governor Nicholls St, New Orleans, LA 70116
$-301
Cash flow
-3.9%
Cash-on-Cash Return
4.8%
Cap rate
0.6%
Rent to Value Ratio
Active
$307,500
2
bds
|
1
ba
|
853
sqft
|
built
2009
1201 Canal St, New Orleans, LA 70112
$-213
Cash flow
-3.6%
Cash-on-Cash Return
4.8%
Cap rate
0.6%
Rent to Value Ratio

Active
$105,000
2
bds
|
1
ba
|
1,120
sqft
|
built
1920
9308 Colapissa St, New Orleans, LA 70118
$331
Cash flow
16.4%
Cash-on-Cash Return
9.5%
Cap rate
1.1%
Rent to Value Ratio
Active
$540,000
1
bds
|
1
ba
|
947
sqft
|
built
2017
1001 Julia St, New Orleans, LA 70113
$-278
Cash flow
-2.7%
Cash-on-Cash Return
5.1%
Cap rate
0.6%
Rent to Value Ratio
Active
$79,500
2
bds
|
2
ba
|
1,100
sqft
|
built
1980
10701 Roger Dr, New Orleans, LA 70127
$383
Cash flow
25.1%
Cash-on-Cash Return
11.5%
Cap rate
1.4%
Rent to Value Ratio
Active
$125,000
1
bds
|
1
ba
|
841
sqft
|
built
1893
620 Decatur St, New Orleans, LA 70130
$995
Cash flow
41.5%
Cash-on-Cash Return
15.2%
Cap rate
1.8%
Rent to Value Ratio
Active
$549,900
3
bds
|
3
ba
|
1,910
sqft
|
built
1895
436 Bermuda St, New Orleans, LA 70114
$-1,222
Cash flow
-11.6%
Cash-on-Cash Return
3.0%
Cap rate
0.4%
Rent to Value Ratio
Active under contract
$320,000
3
bds
|
4
ba
|
2,067
sqft
|
built
1953
1498 Pressburg St, New Orleans, LA 70122
$418
Cash flow
6.8%
Cash-on-Cash Return
7.2%
Cap rate
0.9%
Rent to Value Ratio
Active
$365,000
7
bds
|
0
ba
|
3,497
sqft
|
built
1940
1322 Kerlerec St, New Orleans, LA 70116
$-623
Cash flow
-8.9%
Cash-on-Cash Return
3.6%
Cap rate
0.4%
Rent to Value Ratio
Active
$375,000
8
bds
|
0
ba
|
4,648
sqft
|
built
1977
7040 Crowder Blvd, New Orleans, LA 70127
$-188
Cash flow
-2.6%
Cash-on-Cash Return
5.1%
Cap rate
0.6%
Rent to Value Ratio
Active
$210,000
3
bds
|
2
ba
|
1,758
sqft
|
built
1970
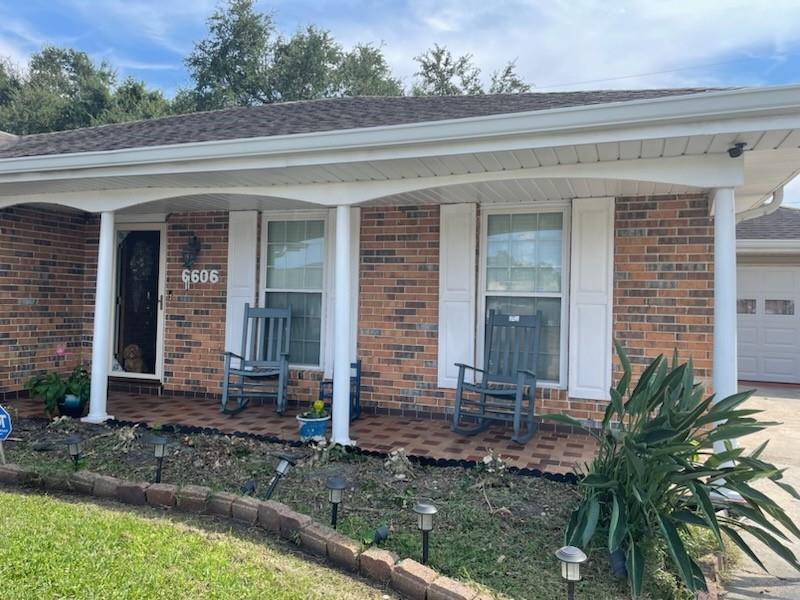
6606 Bamberry St, New Orleans, LA 70126
$248
Cash flow
6.2%
Cash-on-Cash Return
7.1%
Cap rate
0.9%
Rent to Value Ratio
Active
$195,000
3
bds
|
1
ba
|
1,250
sqft
|
built
1947
4229 Eden St, New Orleans, LA 70125
$250
Cash flow
6.7%
Cash-on-Cash Return
7.2%
Cap rate
0.9%
Rent to Value Ratio
Active
$550,000
1
bds
|
1
ba
|
901
sqft
|
built
1890
620 Decatur St, New Orleans, LA 70130
$-878
Cash flow
-8.3%
Cash-on-Cash Return
3.8%
Cap rate
0.5%
Rent to Value Ratio
Active
$918,000
3
bds
|
3
ba
|
1,996
sqft
|
built
1829
626 Burgundy St, New Orleans, LA 70112
$-894
Cash flow
-5.1%
Cash-on-Cash Return
4.5%
Cap rate
0.5%
Rent to Value Ratio
Active
$874,900
4
bds
|
4
ba
|
3,950
sqft
|
built
2018
620 Delacroix Rd, New Orleans, LA 70131
$-1,035
Cash flow
-6.2%
Cash-on-Cash Return
4.3%
Cap rate
0.5%
Rent to Value Ratio
Active
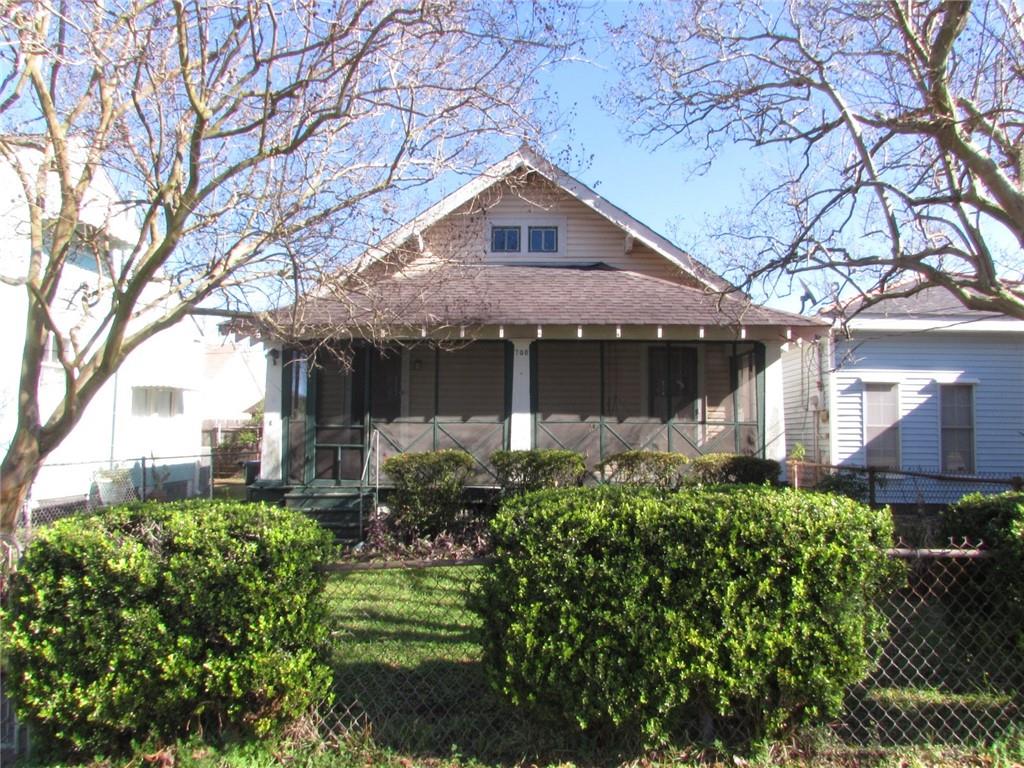
$89,500
2
bds
|
1
ba
|
975
sqft
|
built
1925
708 Sumner St, New Orleans, LA 70114
$473
Cash flow
27.6%
Cash-on-Cash Return
12.0%
Cap rate
1.5%
Rent to Value Ratio
Active
$548,000
4
bds
|
3
ba
|
2,700
sqft
|
built
1923
1019 Opelousas Ave, New Orleans, LA 70114
$-178
Cash flow
-1.7%
Cash-on-Cash Return
5.3%
Cap rate
0.6%
Rent to Value Ratio
Active
$680,000
3
bds
|
2
ba
|
1,350
sqft
|
built
1863
922 Saint Ann St, New Orleans, LA 70116
$-1,079
Cash flow
-8.3%
Cash-on-Cash Return
3.8%
Cap rate
0.5%
Rent to Value Ratio
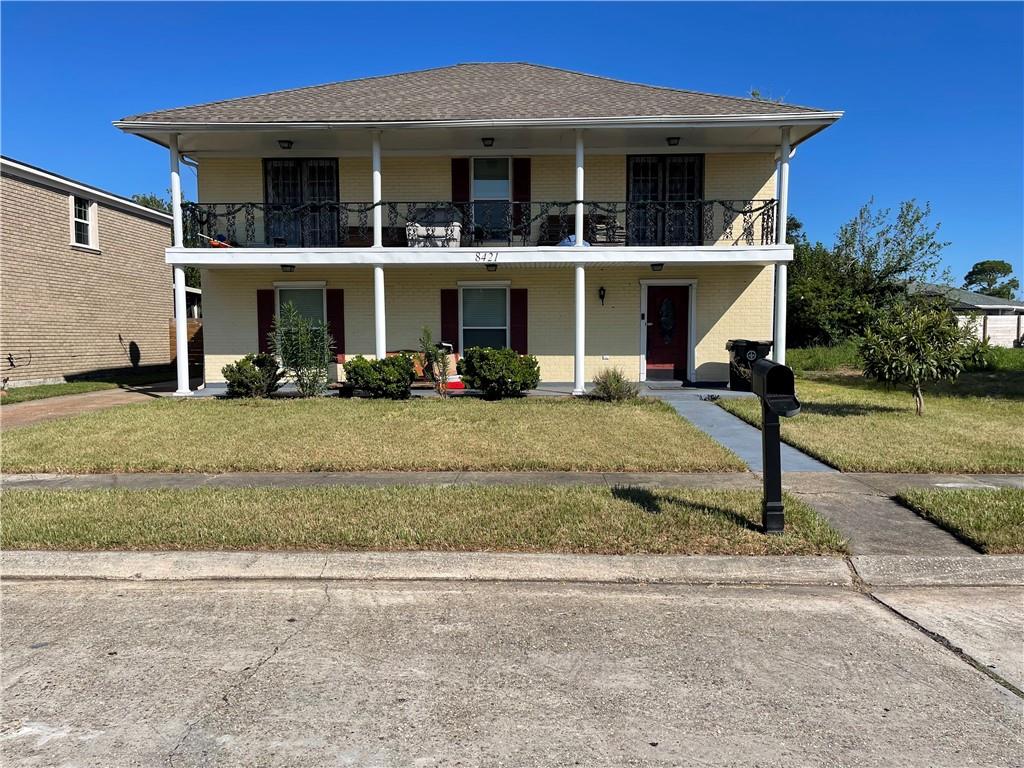
Active
$210,000
4
bds
|
3
ba
|
2,400
sqft
|
built
1979
8421 Aberdeen Rd, New Orleans, LA 70127
$593
Cash flow
14.7%
Cash-on-Cash Return
9.1%
Cap rate
1.1%
Rent to Value Ratio
Active
$224,000
4
bds
|
0
ba
|
1,684
sqft
|
built
1988
5215 Arts St, New Orleans, LA 70122
$-94
Cash flow
-2.2%
Cash-on-Cash Return
5.2%
Cap rate
0.6%
Rent to Value Ratio
Active
$120,000
5
bds
|
0
ba
|
1,385
sqft
|
built
1973
1620 Rev John Raphael Jr Way, New Orleans, LA 70113
$329
Cash flow
14.3%
Cash-on-Cash Return
9.0%
Cap rate
1.1%
Rent to Value Ratio
Active
$360,000
3
bds
|
2
ba
|
1,790
sqft
|
built
1898
8209 Green St, New Orleans, LA 70118
$90
Cash flow
1.3%
Cash-on-Cash Return
6.0%
Cap rate
0.7%
Rent to Value Ratio
Active
$2,100,000
5
bds
|
6
ba
|
4,828
sqft
|
built
1830
1229 Chartres St, New Orleans, LA 70116
$-4,418
Cash flow
-11.0%
Cash-on-Cash Return
3.2%
Cap rate
0.4%
Rent to Value Ratio
Active
$175,000
5
bds
|
2
ba
|
2,109
sqft
|
built
1950
3701 Elysian Fields Ave, New Orleans, LA 70122
$552
Cash flow
16.5%
Cash-on-Cash Return
9.5%
Cap rate
1.1%
Rent to Value Ratio