Orleans Parish County Investment Properties for Sale
Browse homes for sale and investment properties in Orleans Parish County. Refine your search by price, property type, or more.
Best cash flowing properties in Orleans Parish County
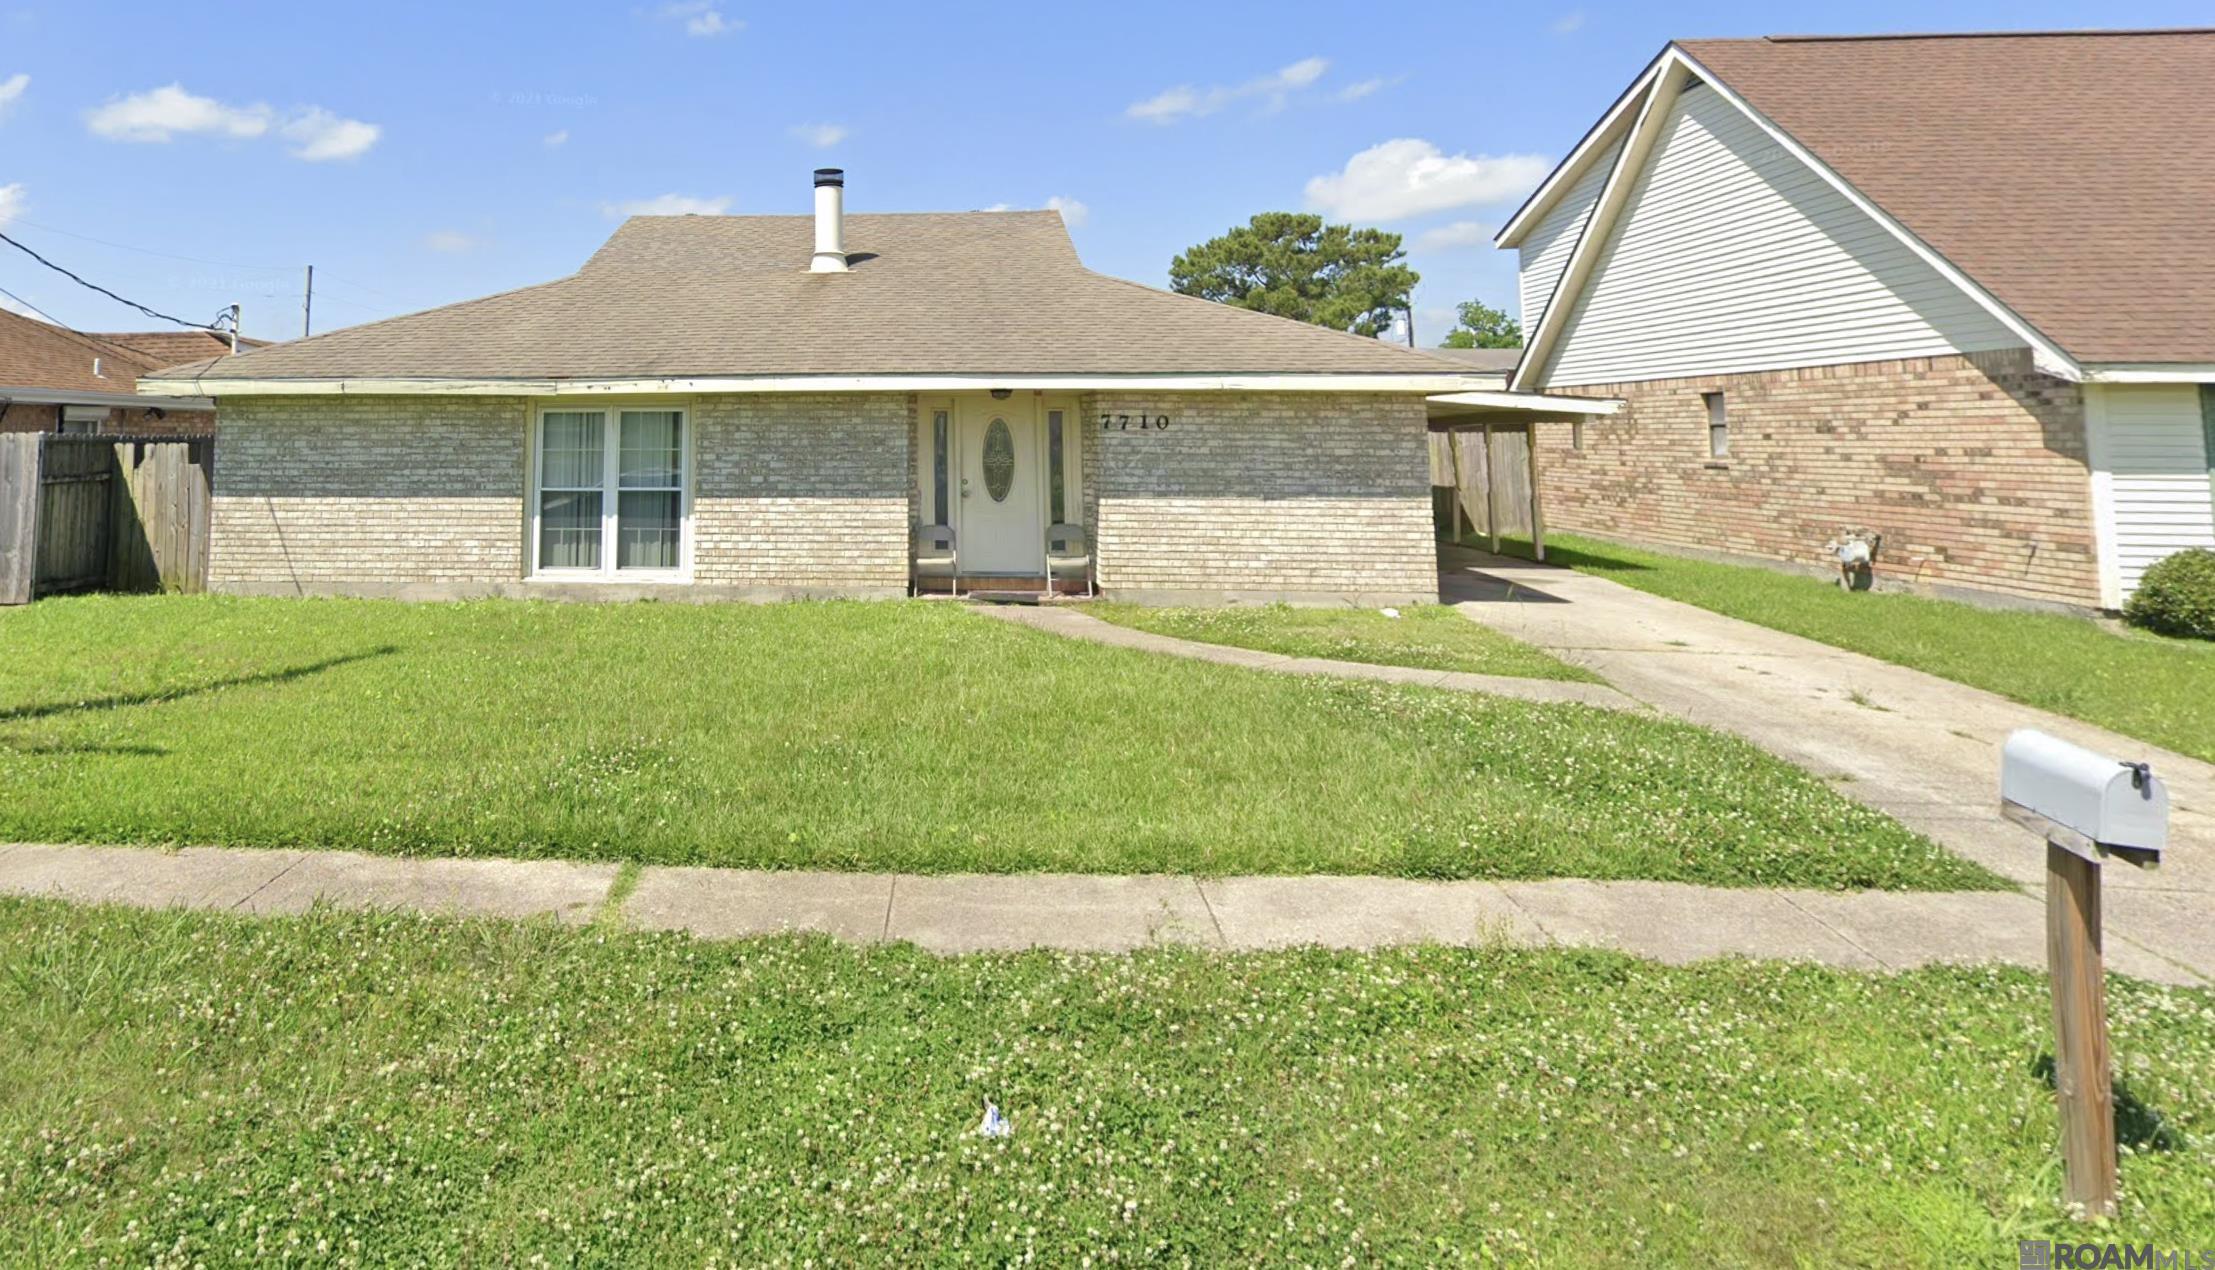
Active
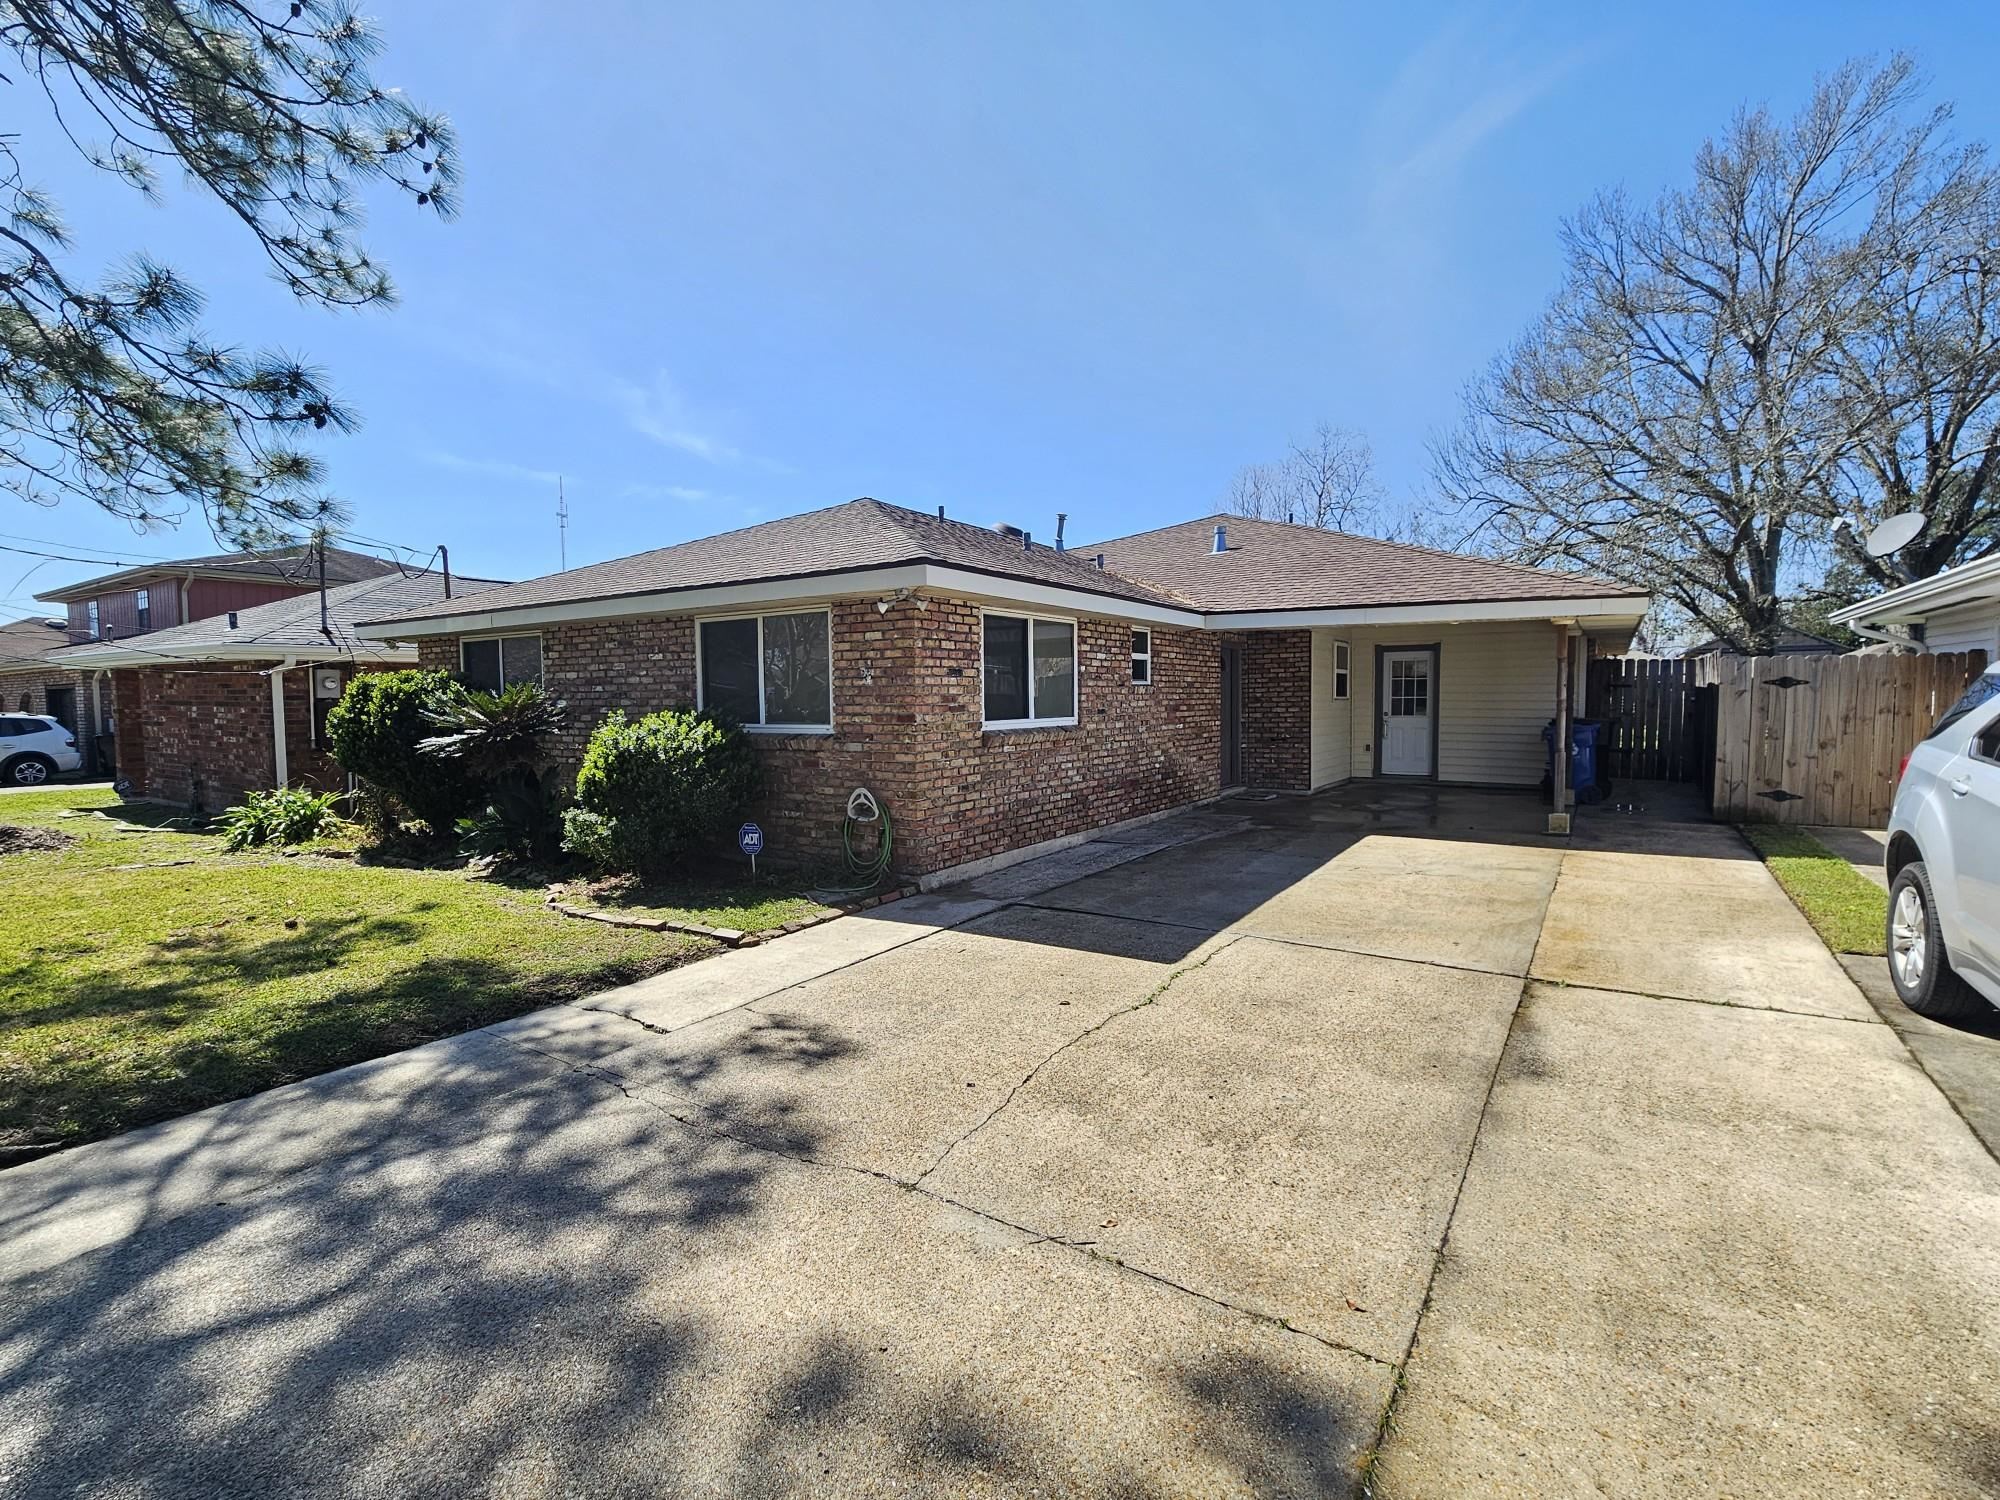
$115,000
3
bds
|
2
ba
|
2,021
sqft
|
built
1980
7710 Shubrick Ave, New Orleans, LA 70127
$836
Cash flow
37.9%
Cash-on-Cash Return
14.4%
Cap rate
1.7%
Rent to Value Ratio
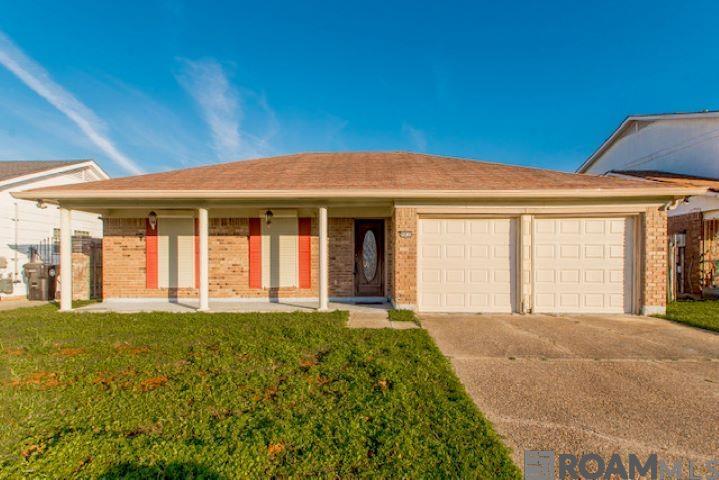
Active
$140,000
4
bds
|
2
ba
|
1,746
sqft
|
built
1970
10831 Guildford Rd, New Orleans, LA 70127
$717
Cash flow
26.7%
Cash-on-Cash Return
11.8%
Cap rate
1.4%
Rent to Value Ratio
1,790 out of 1,797 properties for sale in Orleans Parish County
Limited Results Shown
Create a free account, or log in to reveal all property listings and enjoy the complete experience.
Active
$240,000
4
bds
|
3
ba
|
2,638
sqft
|
built
2001
5042 W Saint Andrews Cir, New Orleans, LA 70128
$340
Cash flow
7.4%
Cash-on-Cash Return
7.4%
Cap rate
0.9%
Rent to Value Ratio
Active
$329,000
3
bds
|
2
ba
|
1,100
sqft
|
built
1923
1411 Saint Bernard Ave, New Orleans, LA 70116
$30
Cash flow
0.5%
Cash-on-Cash Return
5.8%
Cap rate
0.7%
Rent to Value Ratio
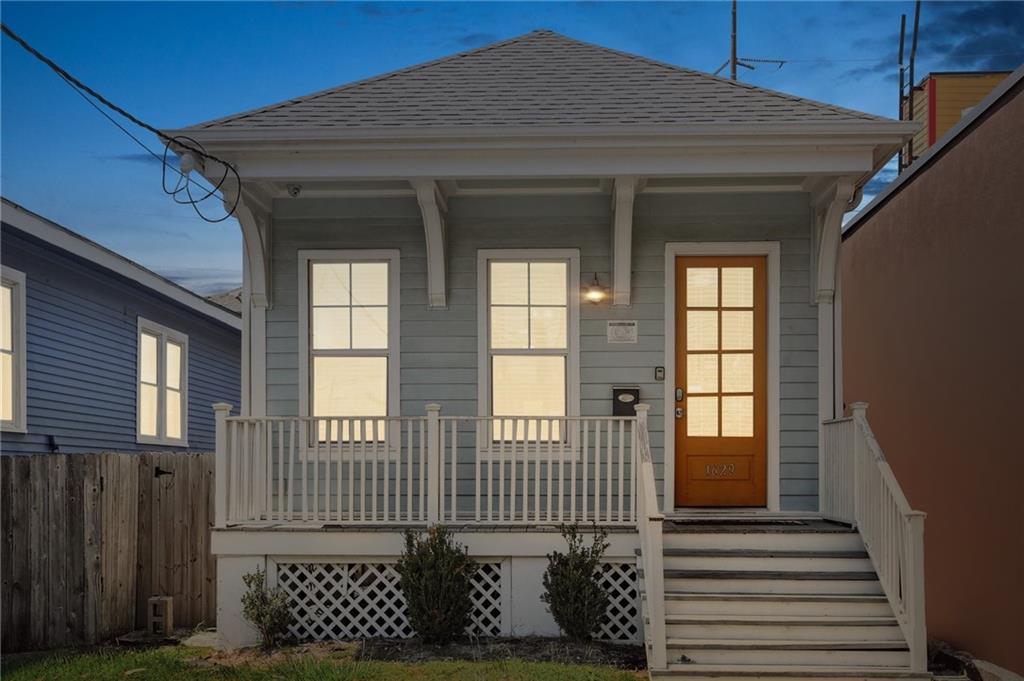
Active
$375,000
3
bds
|
2
ba
|
1,104
sqft
|
built
1958
1629 N Roman St, New Orleans, LA 70116
$-395
Cash flow
-5.5%
Cash-on-Cash Return
4.4%
Cap rate
0.5%
Rent to Value Ratio
Active
$429,900
2
bds
|
3
ba
|
1,950
sqft
|
built
1998
330 Morgan St, New Orleans, LA 70114
$105
Cash flow
1.3%
Cash-on-Cash Return
6.0%
Cap rate
0.7%
Rent to Value Ratio
Active under contract
$950,000
3
bds
|
4
ba
|
3,479
sqft
|
built
1910
3416 Upperline St, New Orleans, LA 70125
$-701
Cash flow
-3.8%
Cash-on-Cash Return
4.8%
Cap rate
0.6%
Rent to Value Ratio
Active
$199,000
3
bds
|
2
ba
|
1,453
sqft
|
built
1948
313 Wallace Dr, New Orleans, LA 70122
$162
Cash flow
4.2%
Cash-on-Cash Return
6.7%
Cap rate
0.8%
Rent to Value Ratio

Active
$489,000
2
bds
|
3
ba
|
1,348
sqft
|
built
1834
604 Esplanade Ave, New Orleans, LA 70116
$-589
Cash flow
-6.3%
Cash-on-Cash Return
4.2%
Cap rate
0.5%
Rent to Value Ratio
Active
$215,000
2
bds
|
2
ba
|
1,254
sqft
|
built
1952
2500 Dreux Ave, New Orleans, LA 70122
$225
Cash flow
5.5%
Cash-on-Cash Return
6.9%
Cap rate
0.8%
Rent to Value Ratio
Active
$325,000
3
bds
|
2
ba
|
1,675
sqft
|
built
1947
3729 Annunciation St, New Orleans, LA 70115
$-572
Cash flow
-9.2%
Cash-on-Cash Return
3.6%
Cap rate
0.4%
Rent to Value Ratio
Active
$520,000
4
bds
|
4
ba
|
2,512
sqft
|
built
1950
818 Homedale St, New Orleans, LA 70124
$-460
Cash flow
-4.6%
Cash-on-Cash Return
4.6%
Cap rate
0.6%
Rent to Value Ratio
Active
$475,000
bds
|
0
ba
|
2,132
sqft
|
built
2839 Dabadie St, New Orleans, LA 70119
$-730
Cash flow
-8.0%
Cash-on-Cash Return
3.8%
Cap rate
0.5%
Rent to Value Ratio
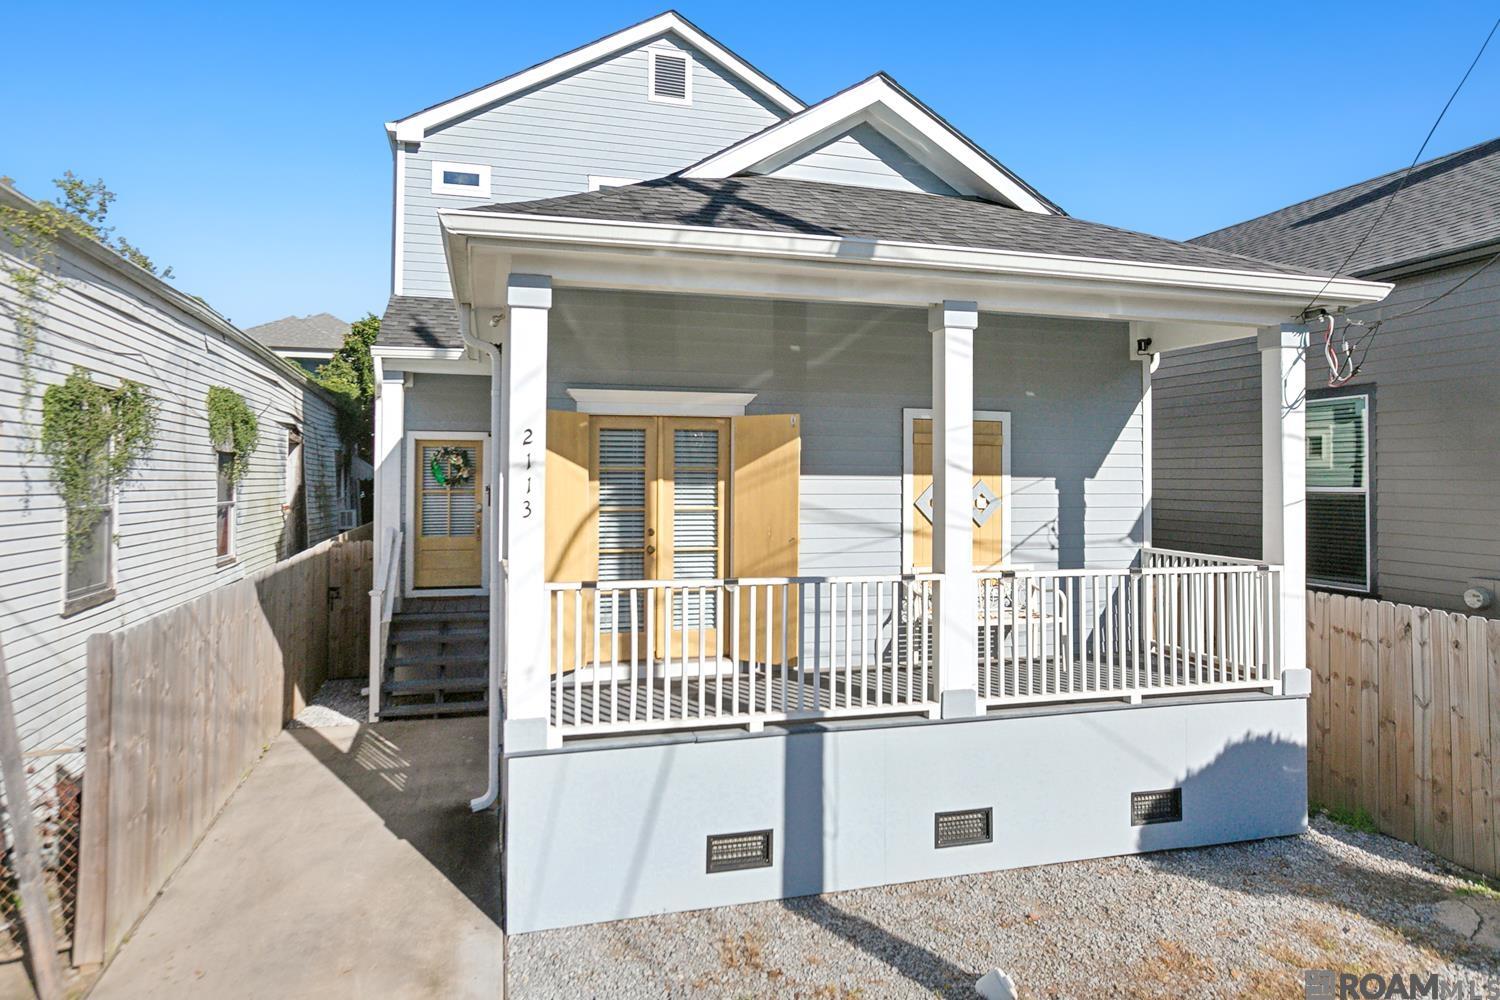
Active
$390,000
3
bds
|
3
ba
|
1,657
sqft
|
built
2020
2113 1st St, New Orleans, LA 70113
$155
Cash flow
2.1%
Cash-on-Cash Return
6.2%
Cap rate
0.7%
Rent to Value Ratio
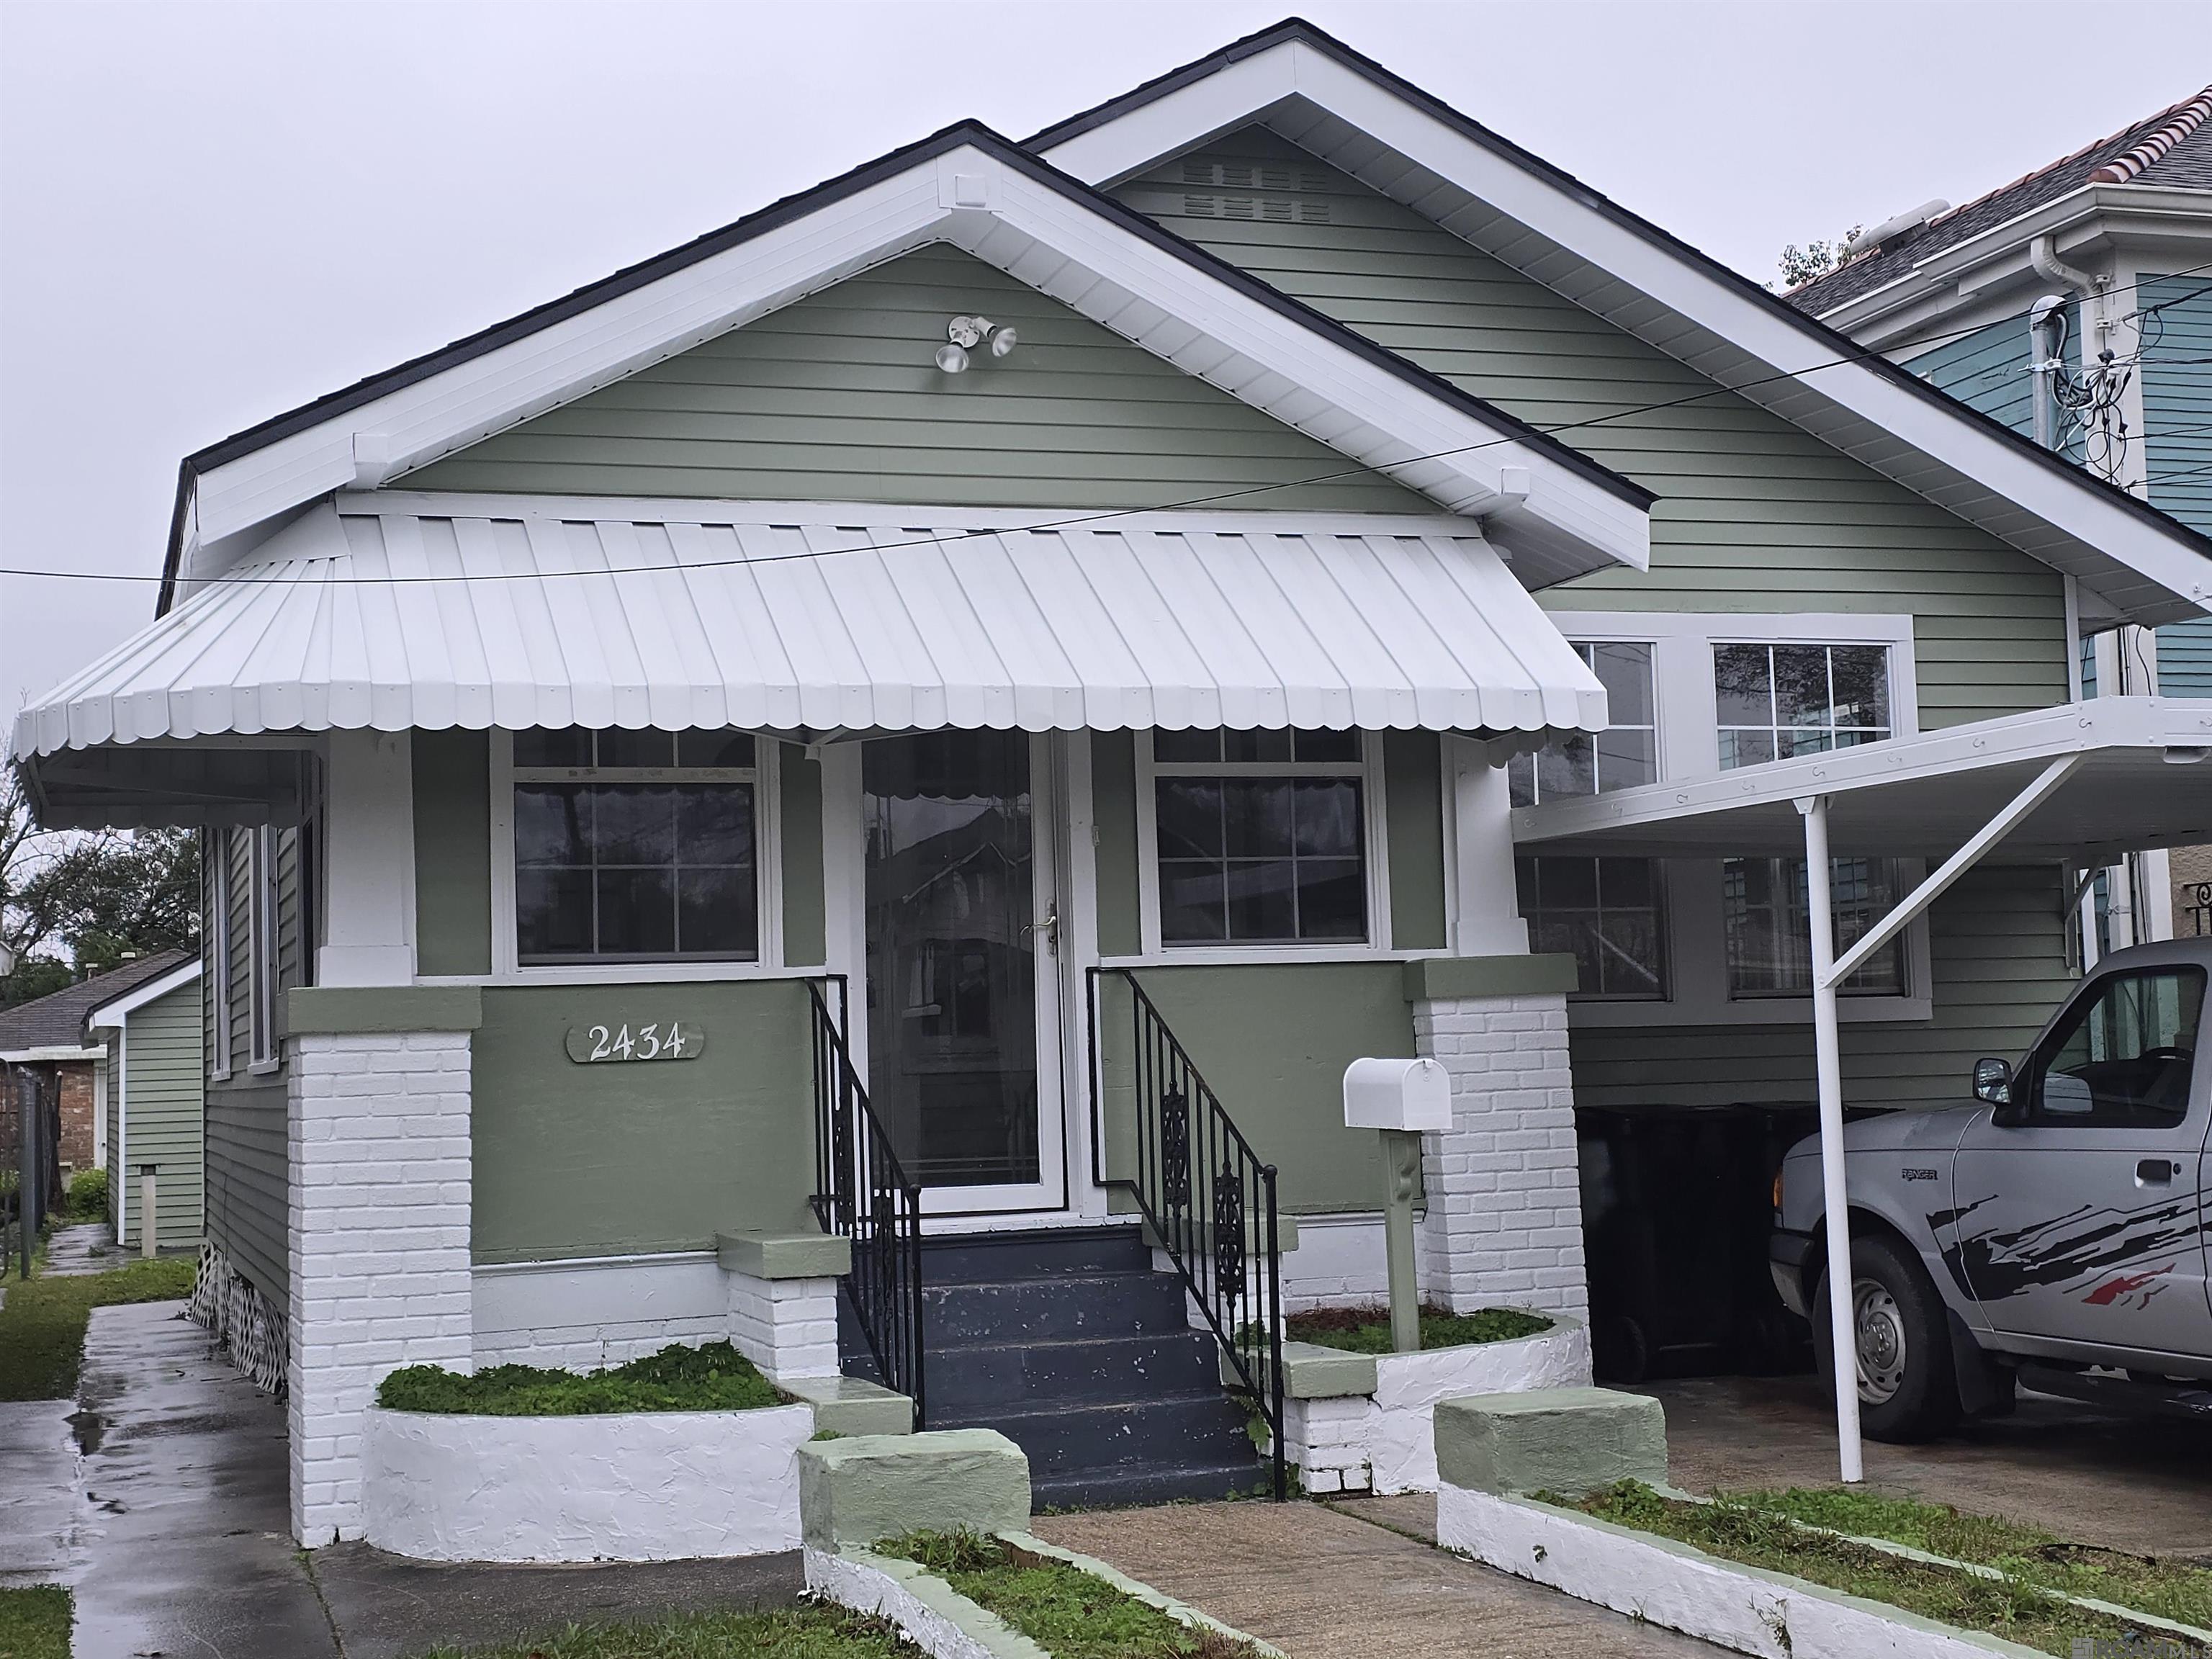
Active
$205,000
2
bds
|
2
ba
|
1,114
sqft
|
built
1984
2434 Wisteria St, New Orleans, LA 70122
$272
Cash flow
6.9%
Cash-on-Cash Return
7.3%
Cap rate
0.9%
Rent to Value Ratio
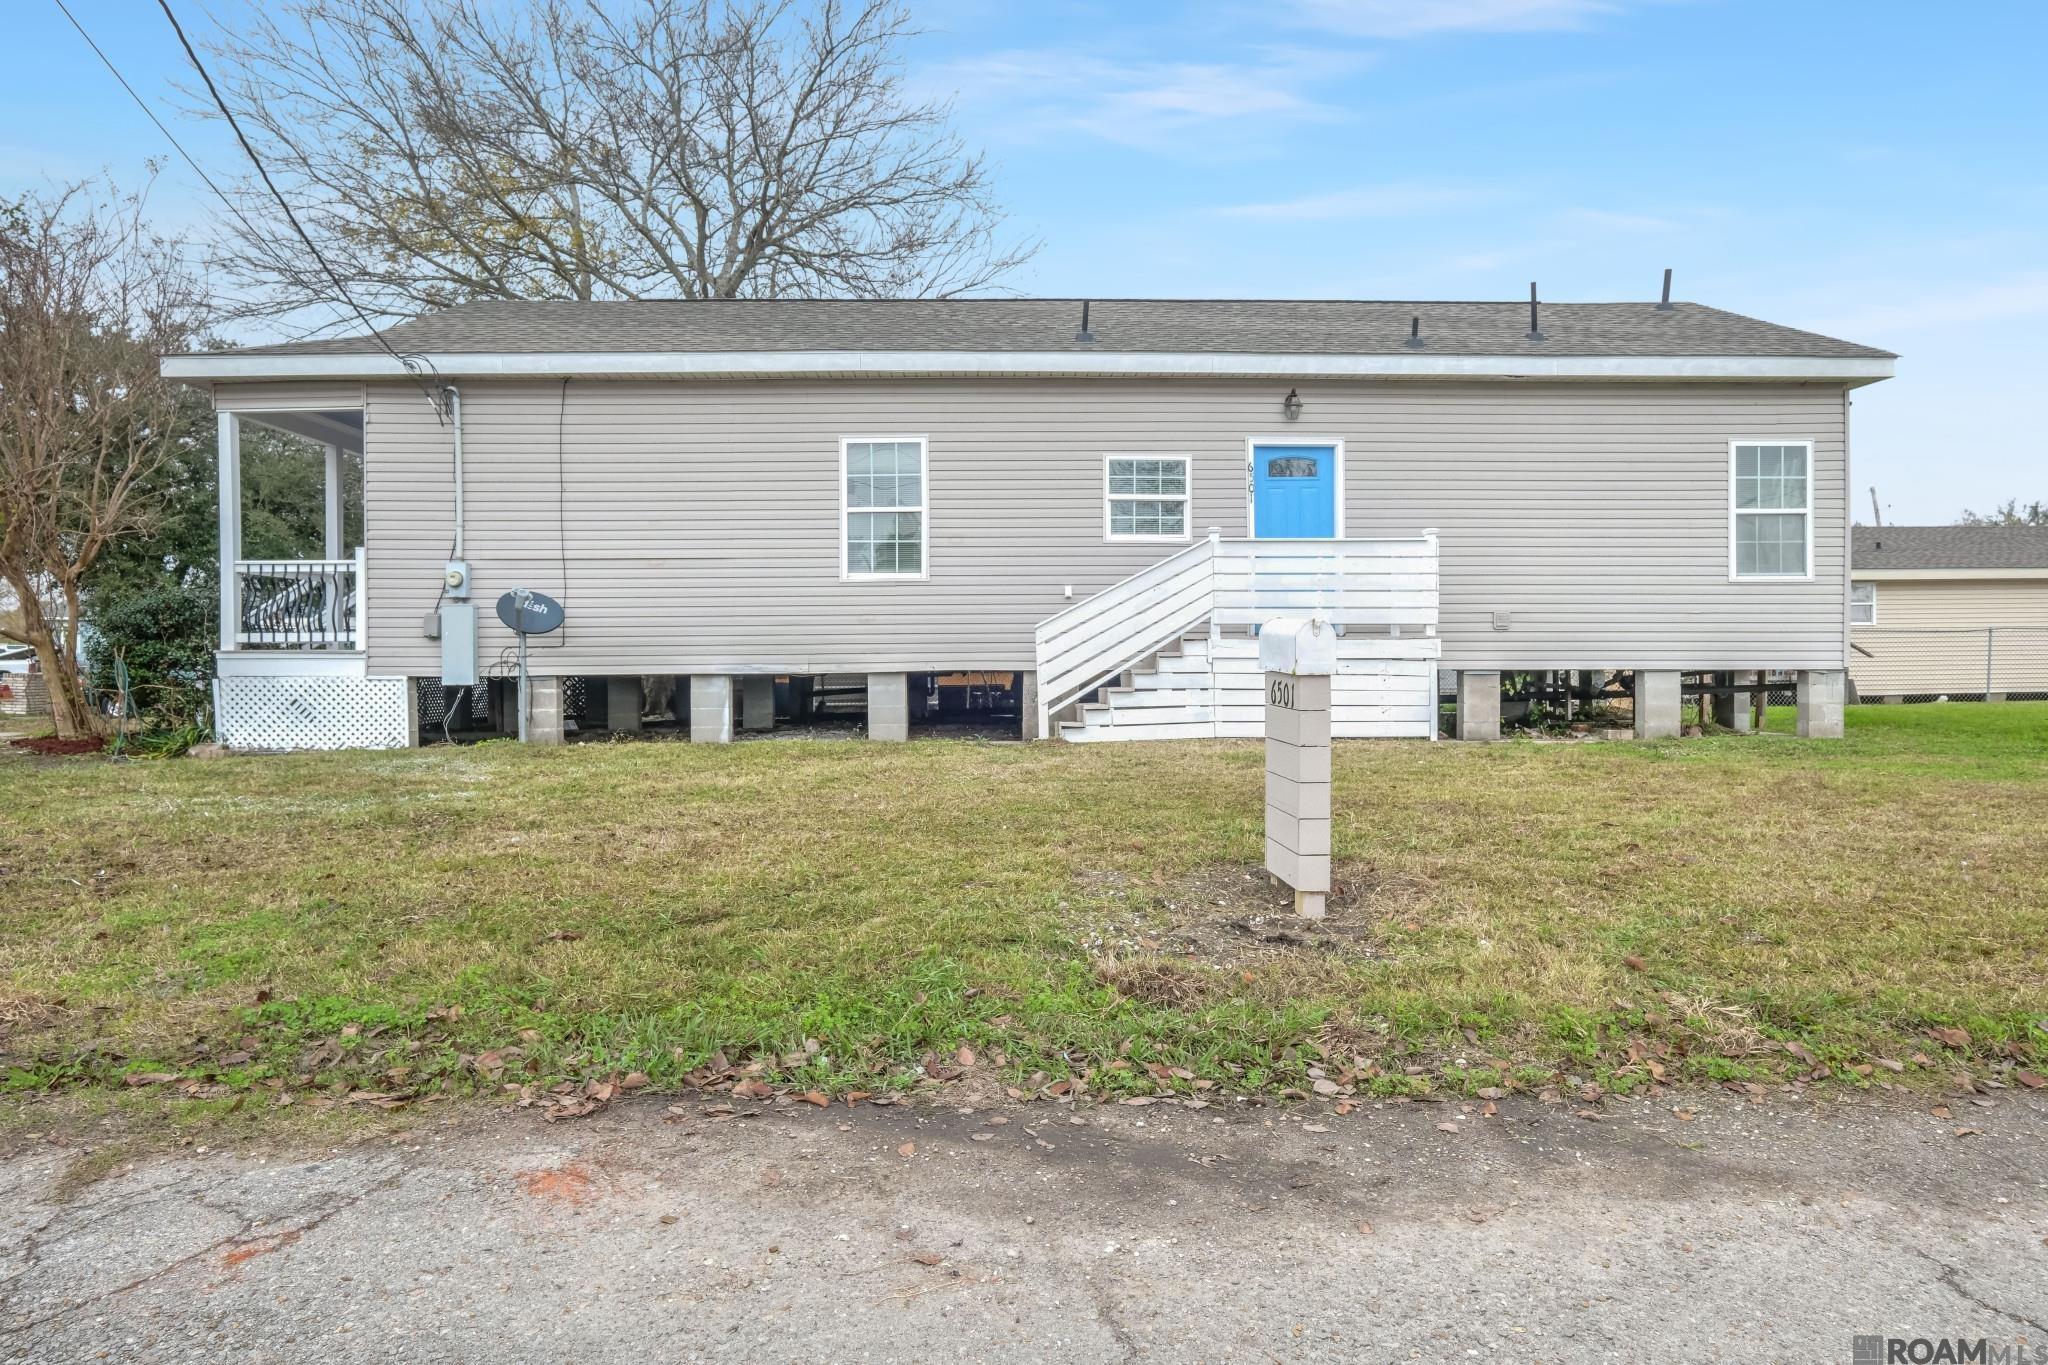
Active
$169,900
3
bds
|
2
ba
|
1,500
sqft
|
built
2013
6501 Selma St, New Orleans, LA 70126
$576
Cash flow
17.7%
Cash-on-Cash Return
9.7%
Cap rate
1.2%
Rent to Value Ratio
Active
$149,900
2
bds
|
2
ba
|
1,161
sqft
|
built
1943
2021 Piety St, New Orleans, LA 70117
$257
Cash flow
8.9%
Cash-on-Cash Return
7.7%
Cap rate
0.9%
Rent to Value Ratio
Active
$269,900
2
bds
|
2
ba
|
900
sqft
|
built
1920
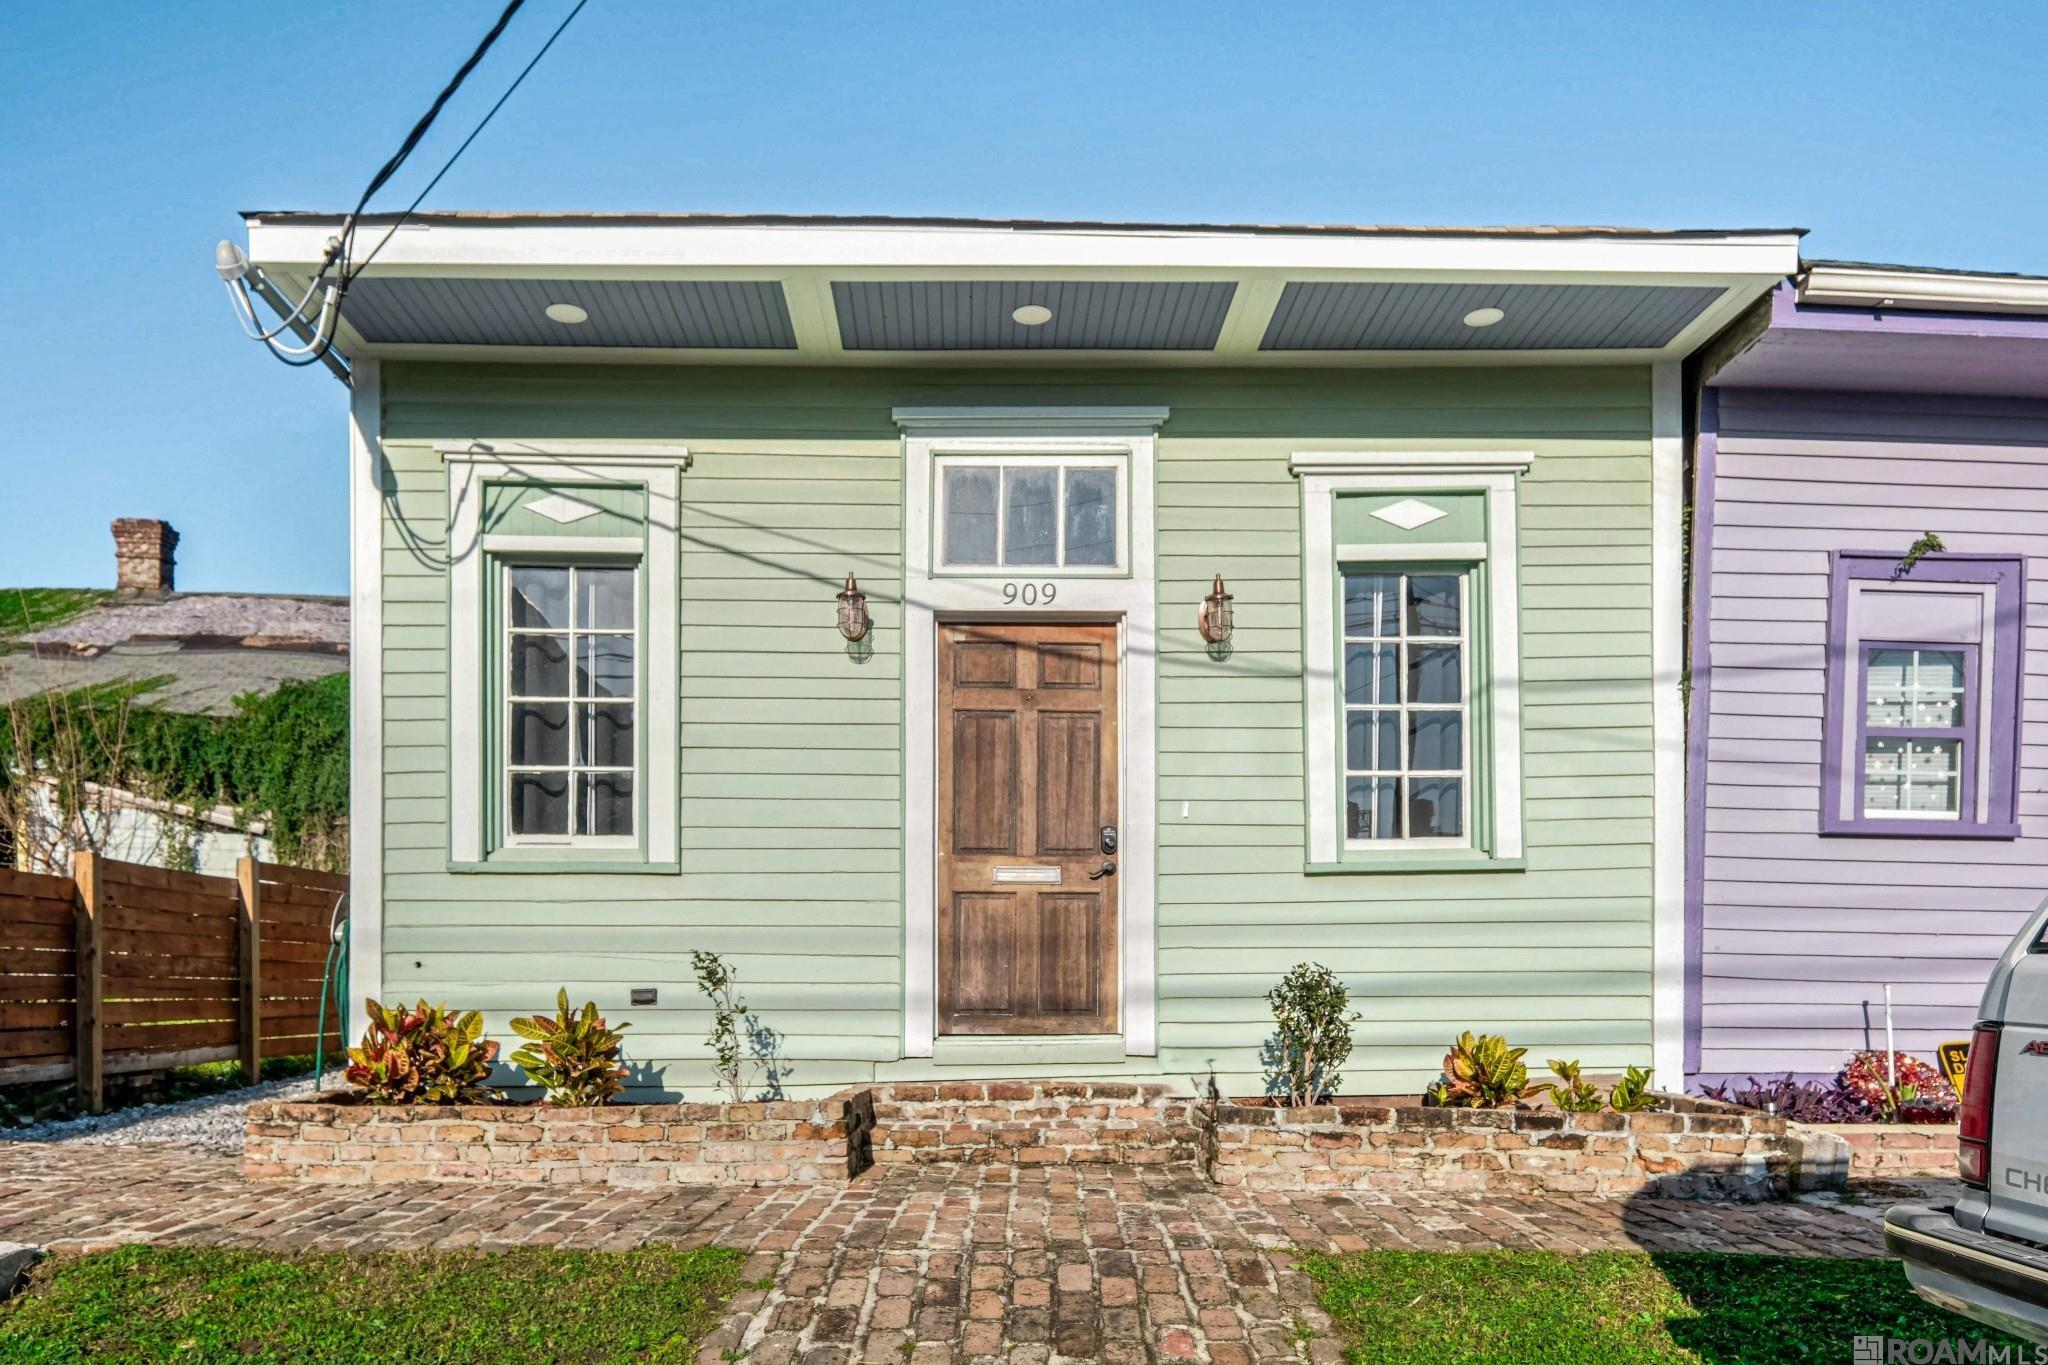
909 N Derbigny St, New Orleans, LA 70116
$241
Cash flow
4.7%
Cash-on-Cash Return
6.7%
Cap rate
0.8%
Rent to Value Ratio
Active
$115,000
3
bds
|
2
ba
|
2,021
sqft
|
built
1980
7710 Shubrick Ave, New Orleans, LA 70127
$836
Cash flow
37.9%
Cash-on-Cash Return
14.4%
Cap rate
1.7%
Rent to Value Ratio
Active
$475,000
bds
|
0
ba
|
3,016
sqft
|
built
2201 Annette St, New Orleans, LA 70119
$-1,144
Cash flow
-12.6%
Cash-on-Cash Return
2.8%
Cap rate
0.3%
Rent to Value Ratio

Active
$265,000
3
bds
|
2
ba
|
1,246
sqft
|
built
2020
5143 Cameron Blvd, New Orleans, LA 70122
$333
Cash flow
6.6%
Cash-on-Cash Return
7.2%
Cap rate
0.9%
Rent to Value Ratio
Pending
$150,000
3
bds
|
2
ba
|
1,792
sqft
|
built
1920
2223 Josephine St, New Orleans, LA 70113
$394
Cash flow
13.7%
Cash-on-Cash Return
8.8%
Cap rate
1.1%
Rent to Value Ratio
Active
$294,000
4
bds
|
3
ba
|
3,120
sqft
|
built
1973
2001 Congress St, New Orleans, LA 70117
$-11
Cash flow
-0.2%
Cash-on-Cash Return
5.6%
Cap rate
0.7%
Rent to Value Ratio
Active
$225,000
3
bds
|
2
ba
|
1,990
sqft
|
built
1975
2235 Mercedes Blvd, New Orleans, LA 70114
$177
Cash flow
4.1%
Cash-on-Cash Return
6.6%
Cap rate
0.8%
Rent to Value Ratio

Active
$234,900
2
bds
|
2
ba
|
1,242
sqft
|
built
1924
7814 Colapissa St, New Orleans, LA 70125
$-77
Cash flow
-1.7%
Cash-on-Cash Return
5.3%
Cap rate
0.6%
Rent to Value Ratio
Active
$789,999
4
bds
|
4
ba
|
2,948
sqft
|
built
1913
59 Fontainebleau Dr, New Orleans, LA 70125
$-910
Cash flow
-6.0%
Cash-on-Cash Return
4.3%
Cap rate
0.5%
Rent to Value Ratio
Active
$140,000
4
bds
|
2
ba
|
1,746
sqft
|
built
1970
10831 Guildford Rd, New Orleans, LA 70127
$717
Cash flow
26.7%
Cash-on-Cash Return
11.8%
Cap rate
1.4%
Rent to Value Ratio
Active
$499,900
3
bds
|
2
ba
|
1,896
sqft
|
built
2019
2444 Vienna St, New Orleans, LA 70122
$49
Cash flow
0.5%
Cash-on-Cash Return
5.8%
Cap rate
0.7%
Rent to Value Ratio

Active
$135,000
2
bds
|
2
ba
|
1,220
sqft
|
built
1972
1026 Gordon St, New Orleans, LA 70117
$603
Cash flow
23.3%
Cash-on-Cash Return
11.0%
Cap rate
1.3%
Rent to Value Ratio

Active
$151,000
1
bds
|
1
ba
|
863
sqft
|
built
1890
3110 Saint Ann St, New Orleans, LA 70119
$44
Cash flow
1.5%
Cash-on-Cash Return
6.0%
Cap rate
0.7%
Rent to Value Ratio
Active
$535,000
4
bds
|
2
ba
|
2,115
sqft
|
built
1955
432 Emerald St, New Orleans, LA 70124
$-395
Cash flow
-3.9%
Cash-on-Cash Return
4.8%
Cap rate
0.6%
Rent to Value Ratio
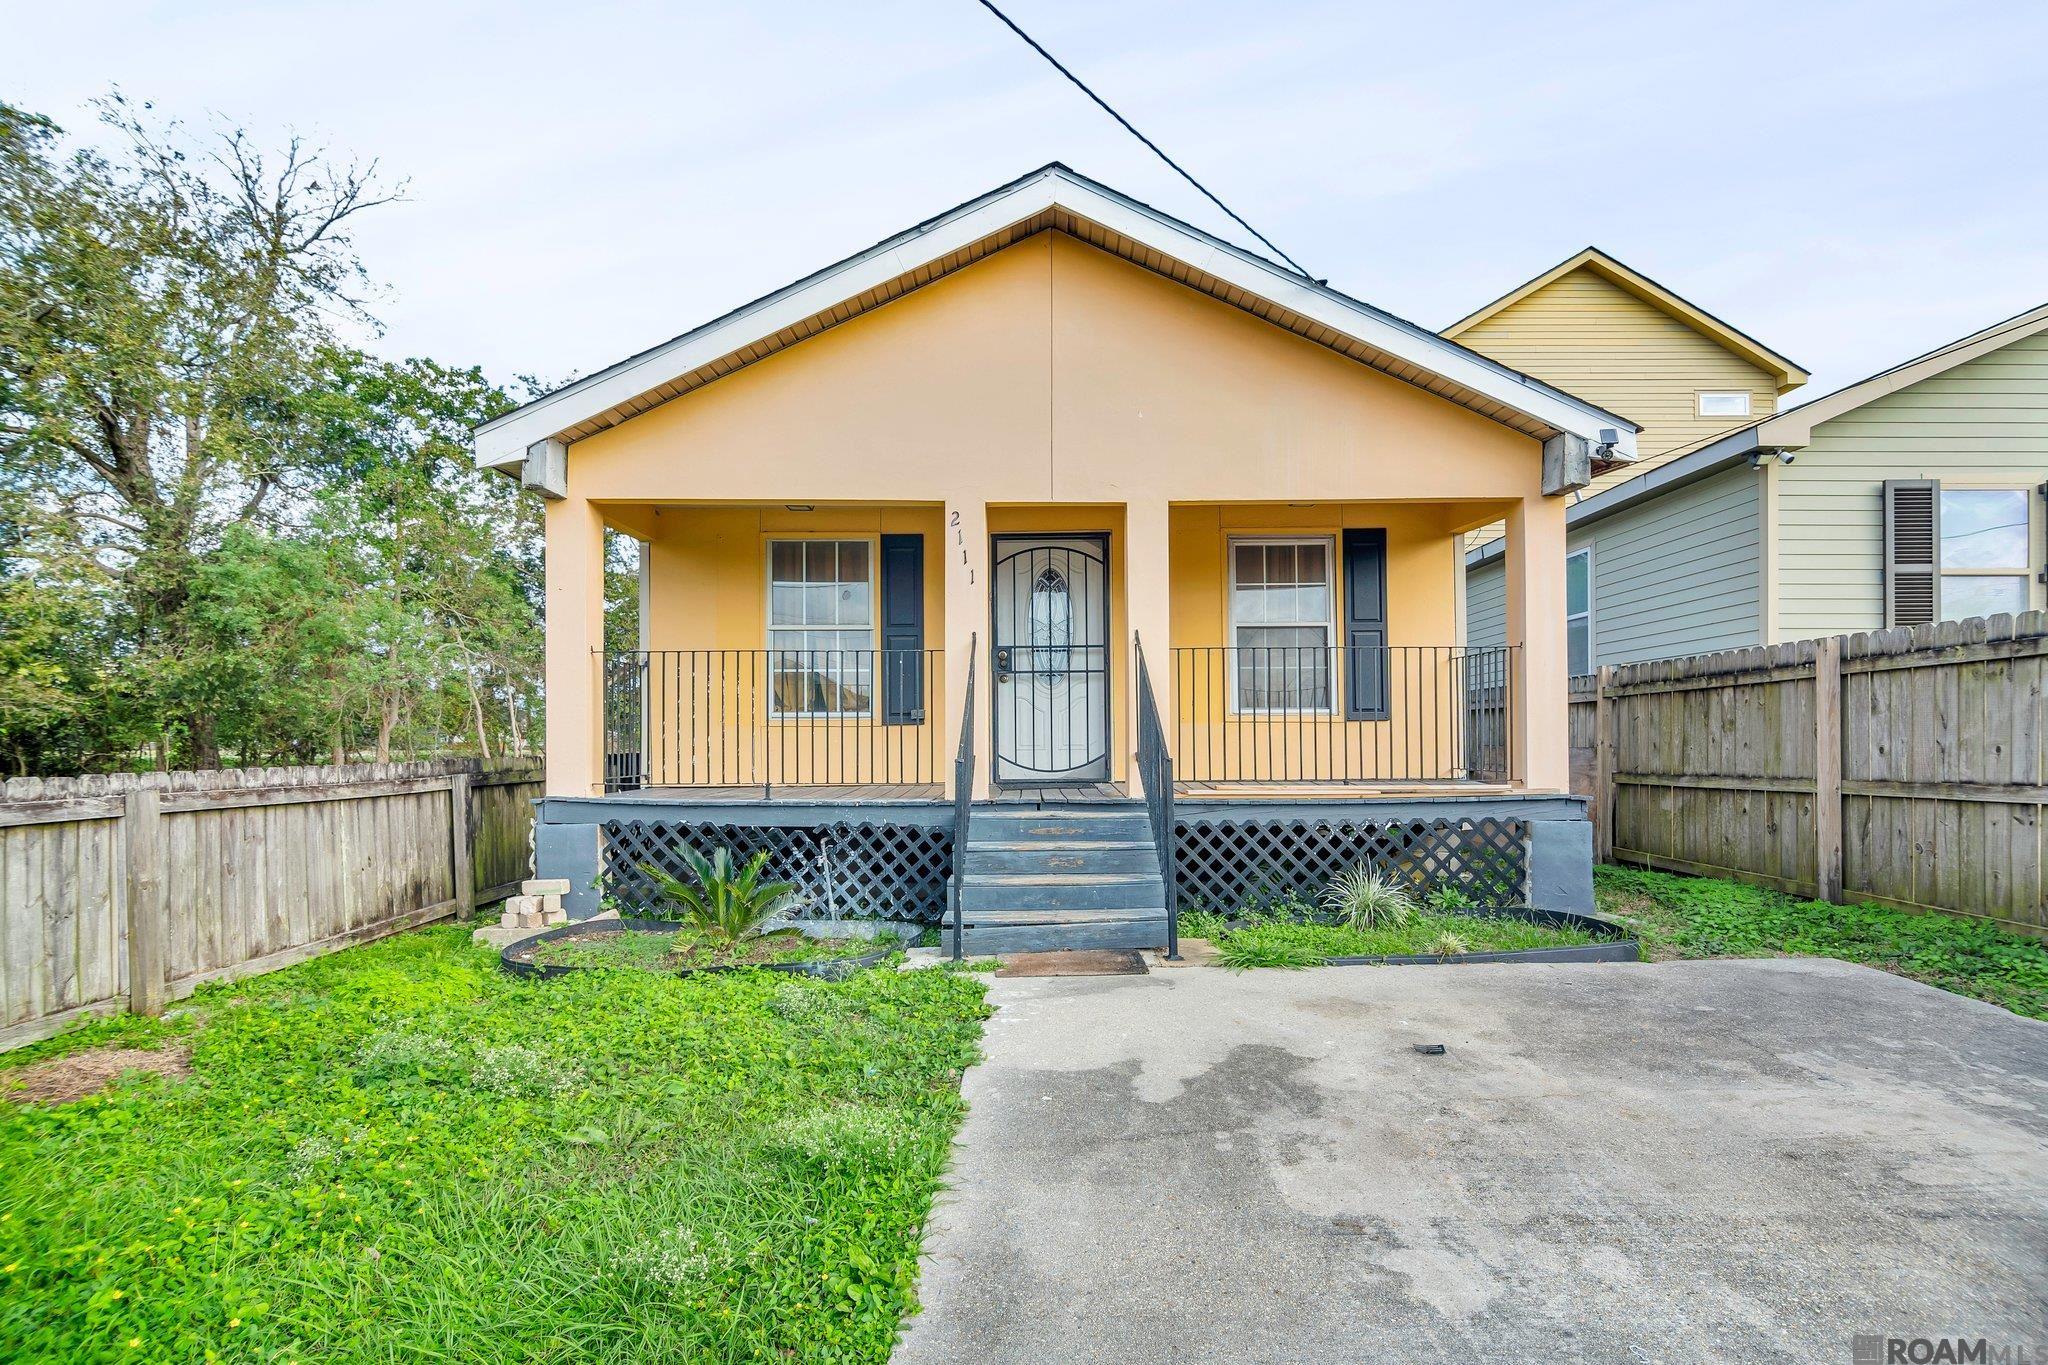
Active
$130,000
3
bds
|
2
ba
|
1,488
sqft
|
built
2004
2111 Lizardi St, New Orleans, LA 70117
$627
Cash flow
25.2%
Cash-on-Cash Return
11.5%
Cap rate
1.4%
Rent to Value Ratio