Orleans Parish County Investment Properties for Sale
Browse homes for sale and investment properties in Orleans Parish County. Refine your search by price, property type, or more.
Best cash flowing properties in Orleans Parish County

Active
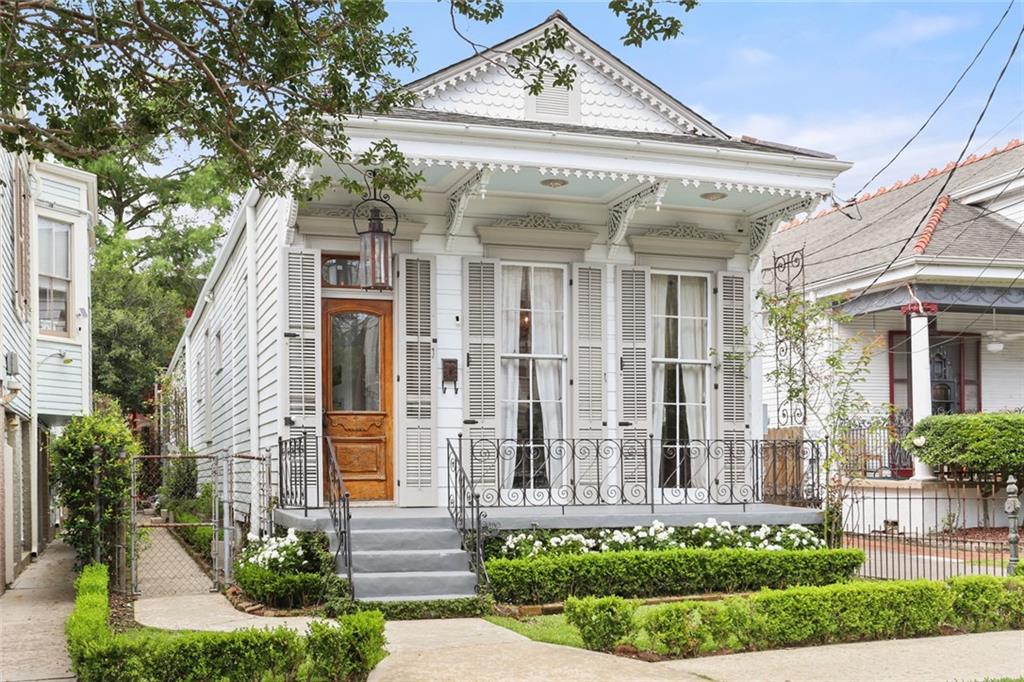
$950,000
3
bds
|
3
ba
|
2,855
sqft
|
built
1917
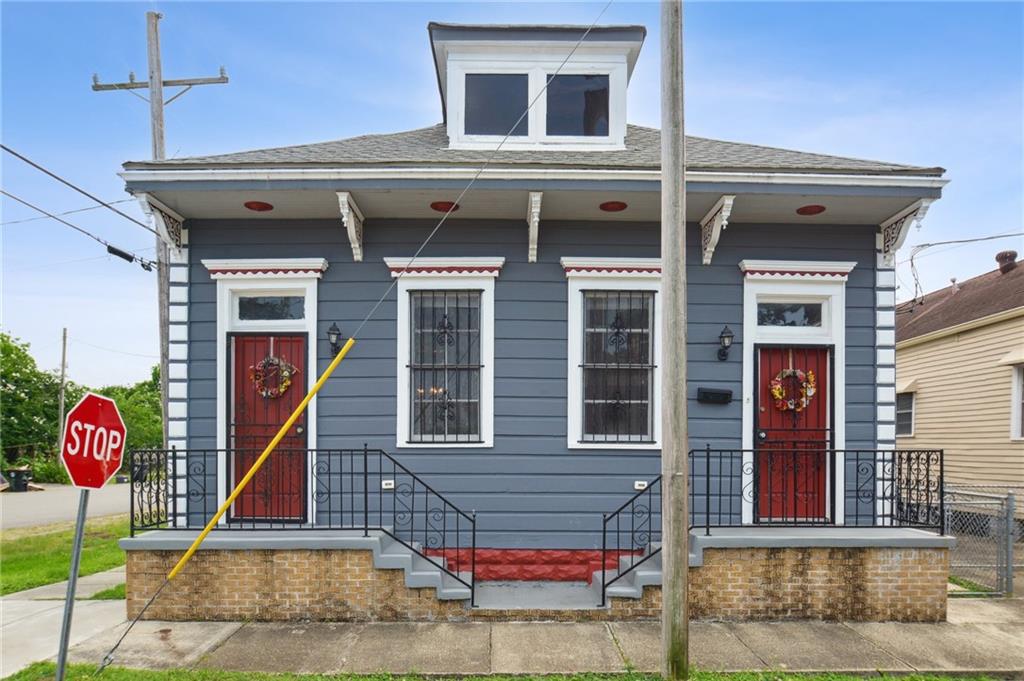
801 Saint Joseph St, New Orleans, LA 70113
$955
Cash flow
5.2%
Cash-on-Cash Return
6.9%
Cap rate
0.8%
Rent to Value Ratio
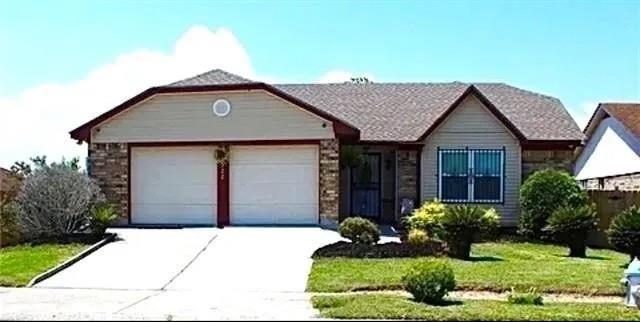
Active
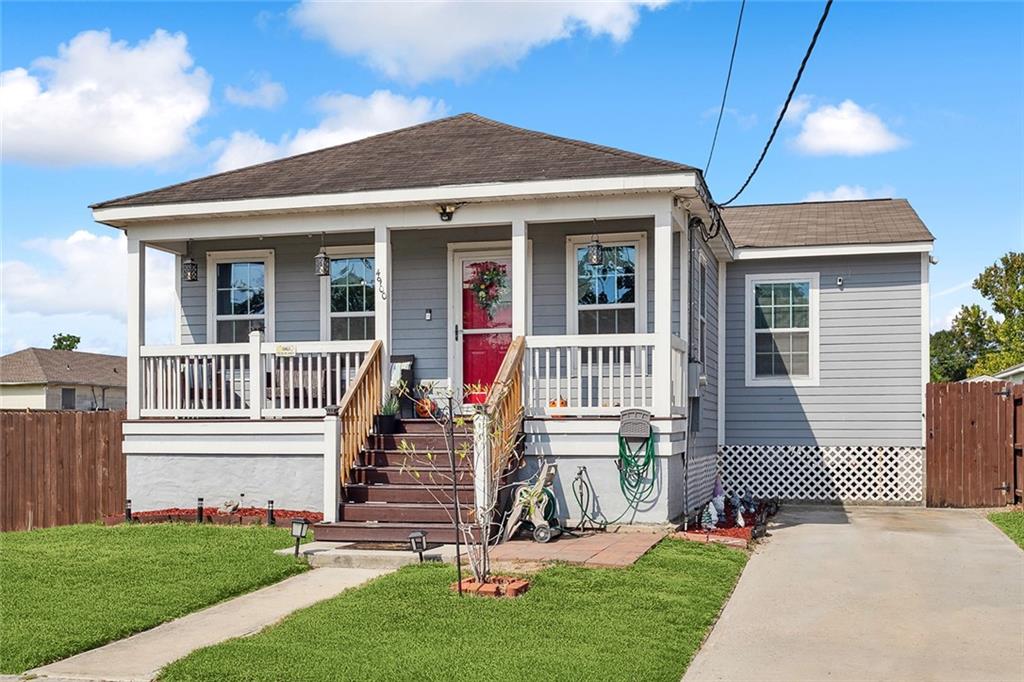
$225,000
4
bds
|
3
ba
|
2,920
sqft
|
built
1985
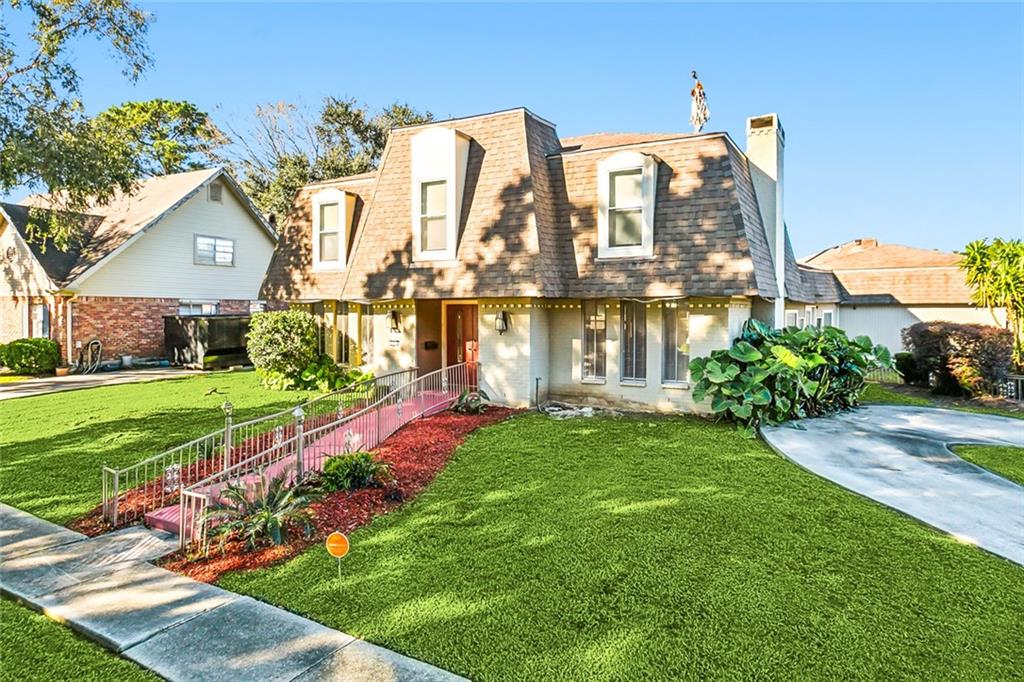
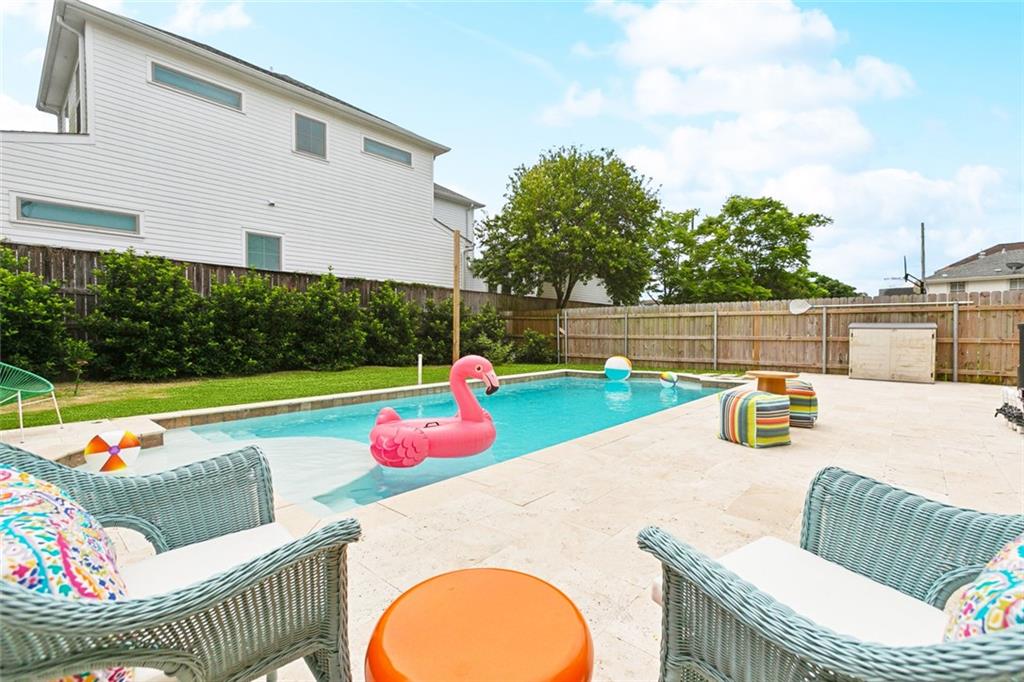
3500 Silver Maple Ct, New Orleans, LA 70131
$852
Cash flow
19.8%
Cash-on-Cash Return
10.2%
Cap rate
1.2%
Rent to Value Ratio
1,790 out of 1,797 properties for sale in Orleans Parish County
Limited Results Shown
Create a free account, or log in to reveal all property listings and enjoy the complete experience.
Active
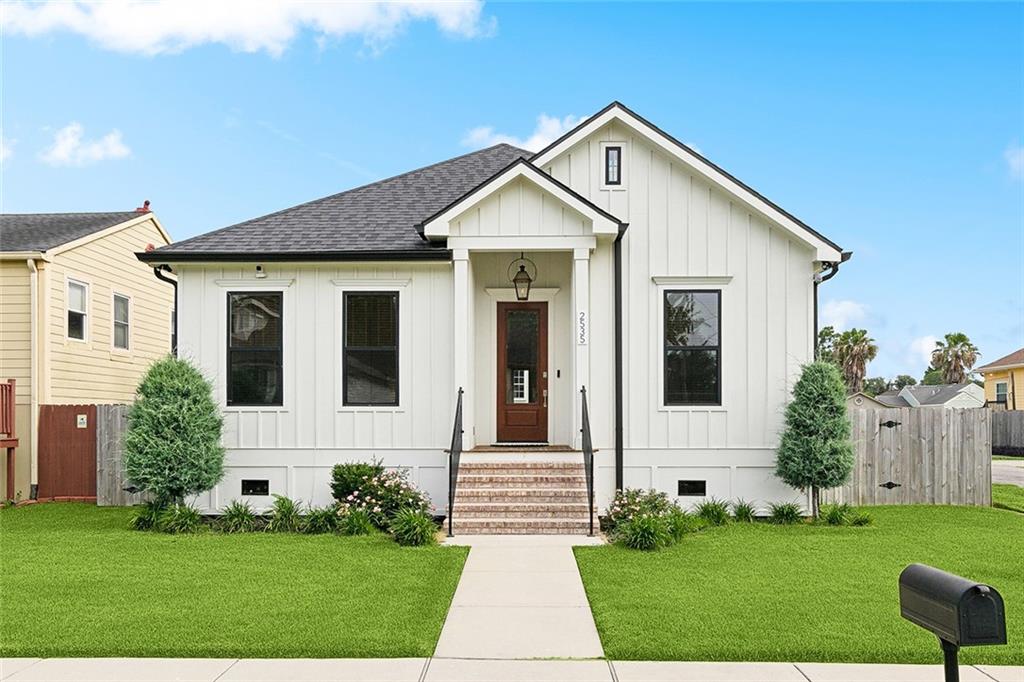
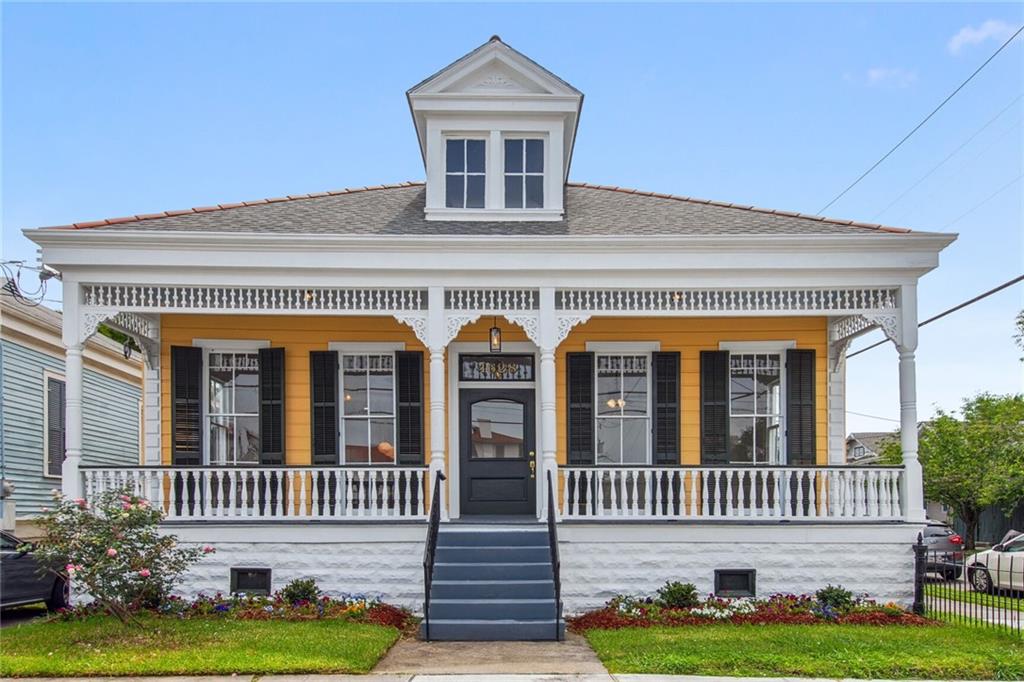
$405,000
4
bds
|
3
ba
|
1,930
sqft
|
built
2022
2535 Athis St, New Orleans, LA 70122
$291
Cash flow
3.7%
Cash-on-Cash Return
6.5%
Cap rate
0.8%
Rent to Value Ratio
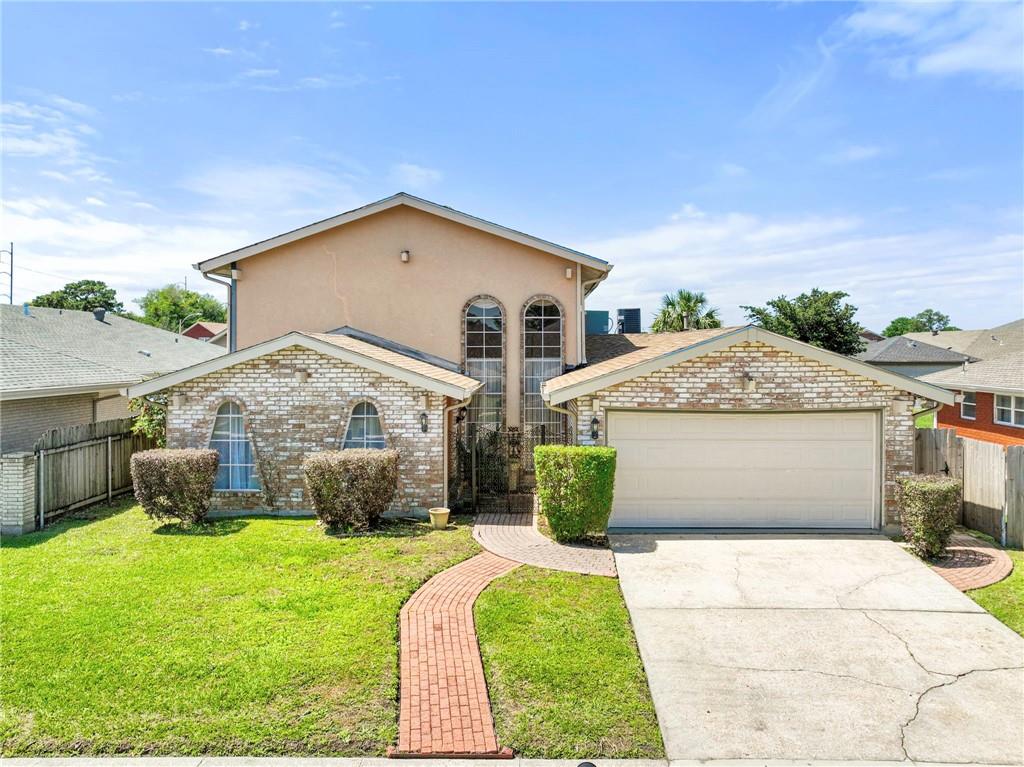
Active
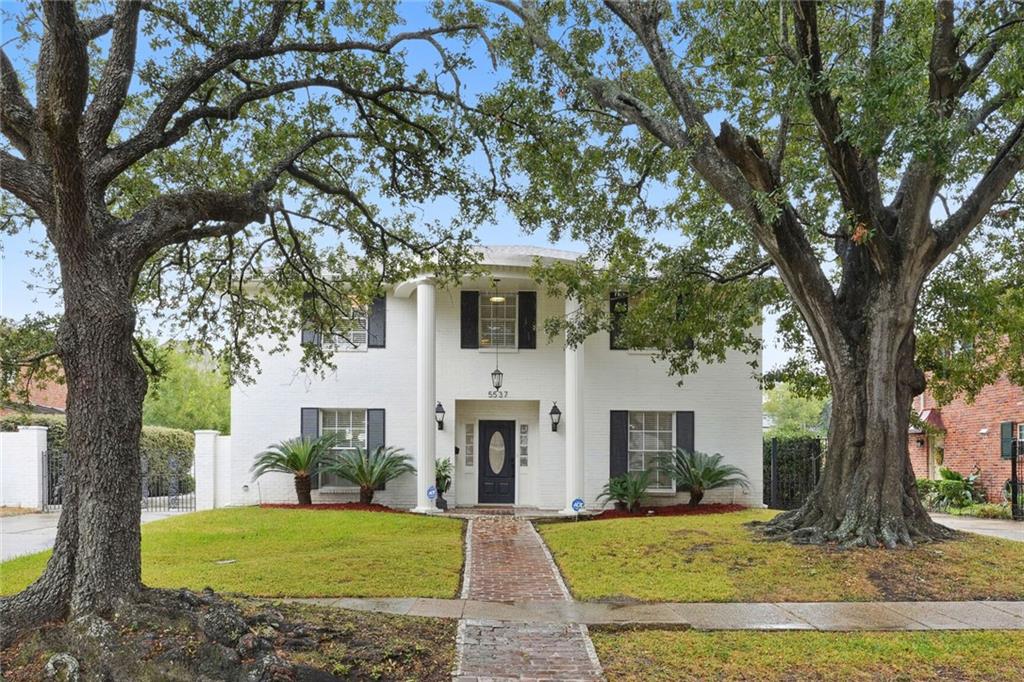
$825,000
4
bds
|
5
ba
|
4,015
sqft
|
built
1980
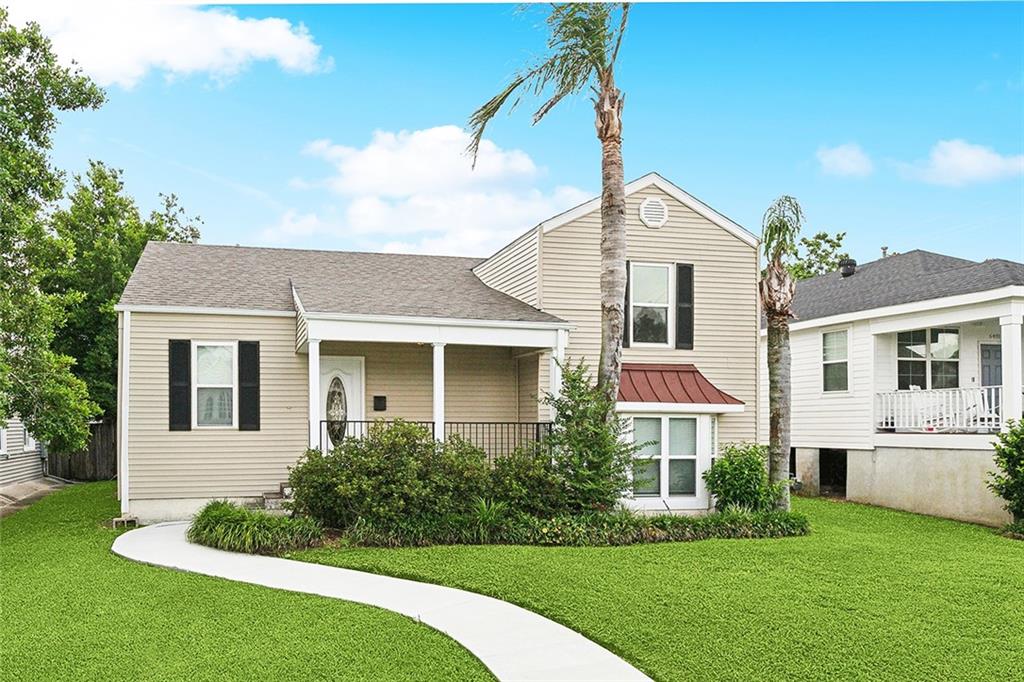
5537 Cherlyn Dr, New Orleans, LA 70124
$-385
Cash flow
-2.4%
Cash-on-Cash Return
5.1%
Cap rate
0.6%
Rent to Value Ratio
Active
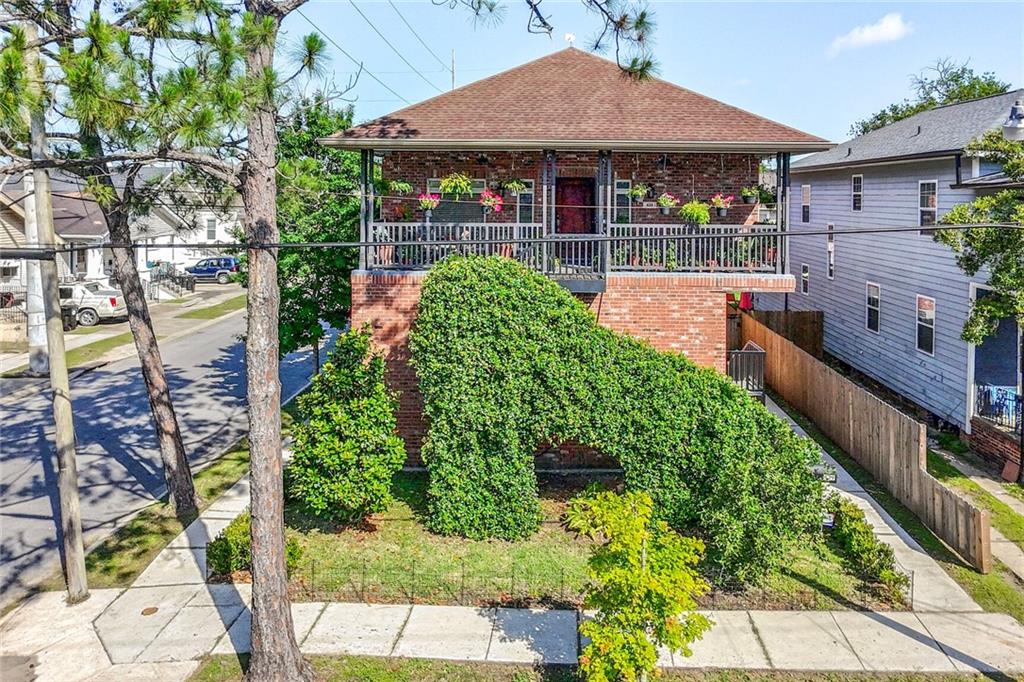
$634,000
4
bds
|
4
ba
|
3,800
sqft
|
built
2007
439 S Clark St, New Orleans, LA 70119
$-585
Cash flow
-4.8%
Cash-on-Cash Return
4.6%
Cap rate
0.6%
Rent to Value Ratio
Active
$479,000
4
bds
|
3
ba
|
2,904
sqft
|
built
1951
6409 Louis Xiv St, New Orleans, LA 70124
$148
Cash flow
1.6%
Cash-on-Cash Return
6.1%
Cap rate
0.7%
Rent to Value Ratio
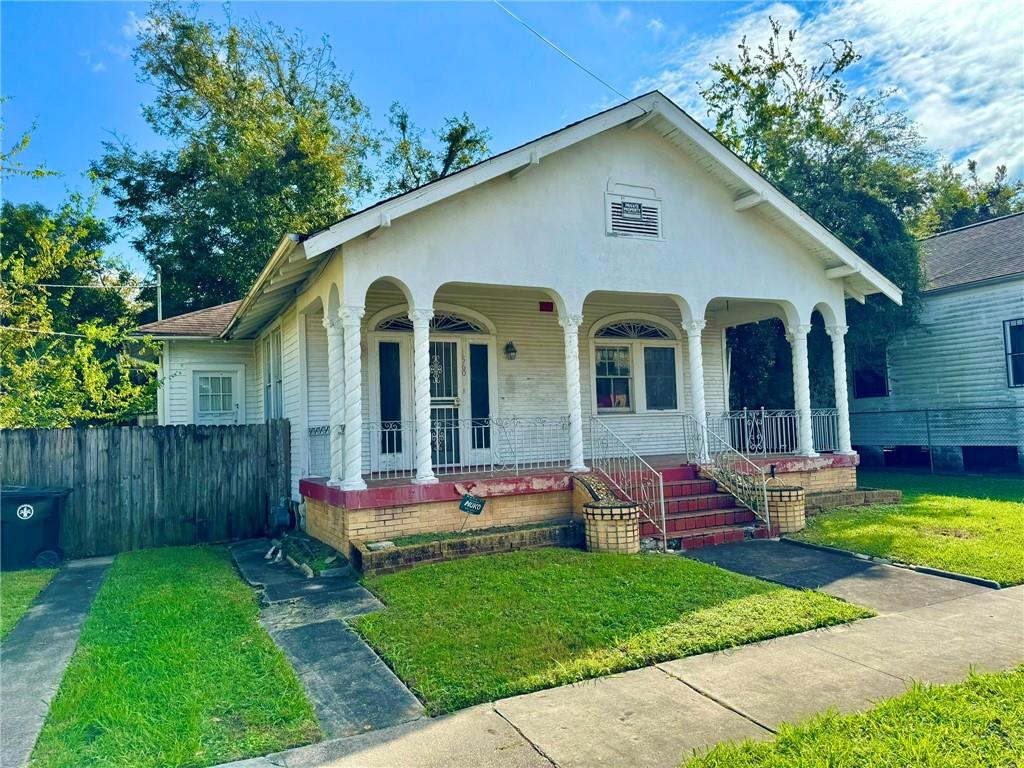
Active under contract
$397,000
3
bds
|
3
ba
|
2,296
sqft
|
built
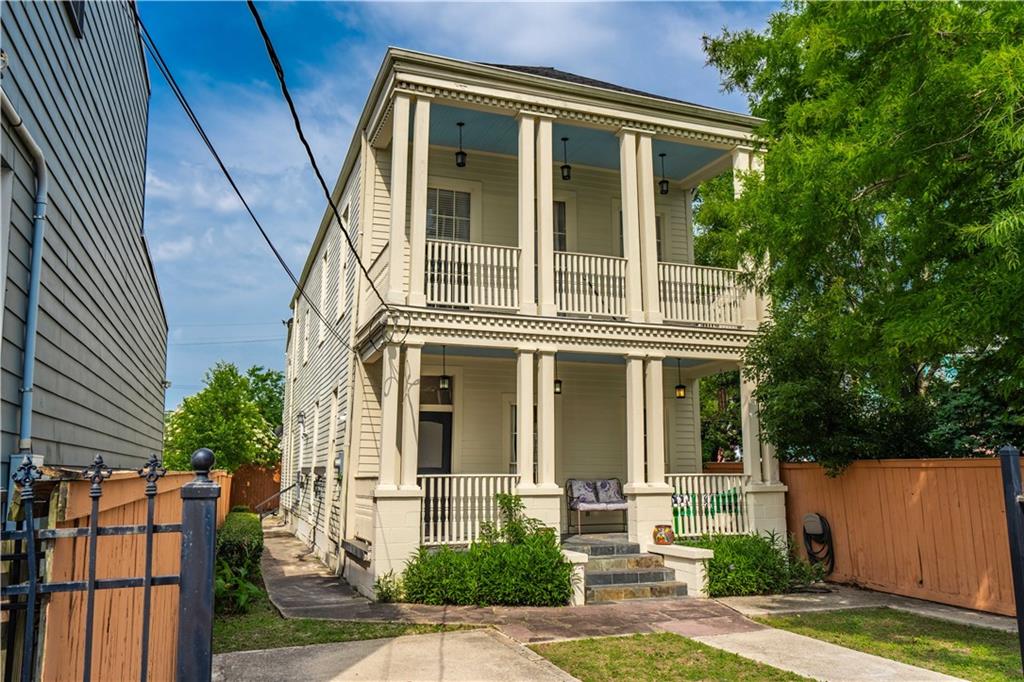
1837
518 Pacific Ave, New Orleans, LA 70114
$-85
Cash flow
-1.1%
Cash-on-Cash Return
5.4%
Cap rate
0.7%
Rent to Value Ratio
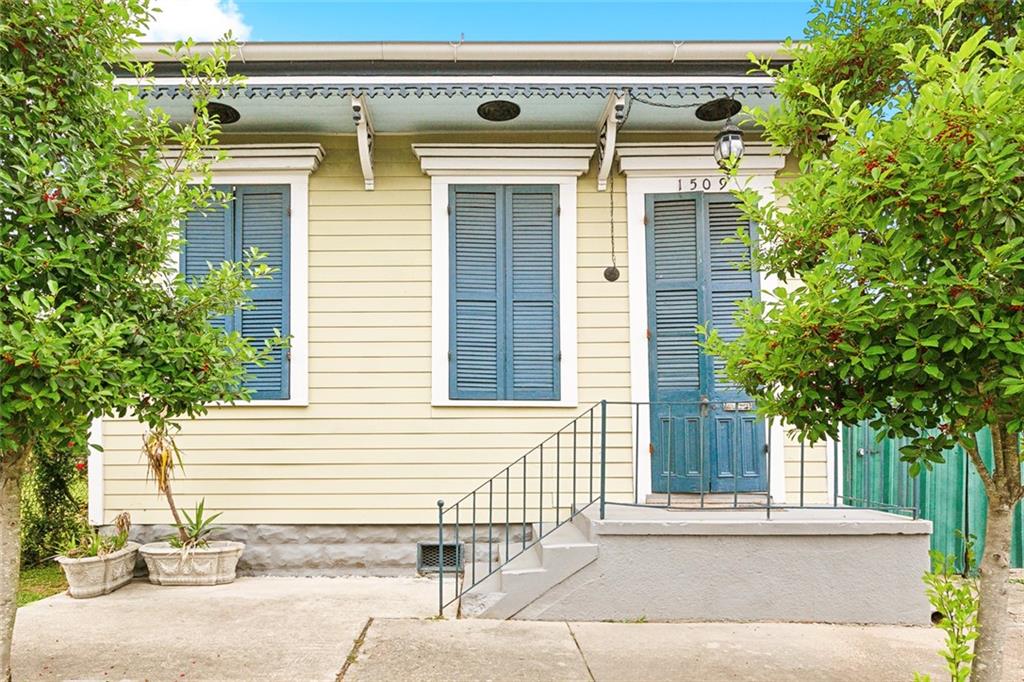
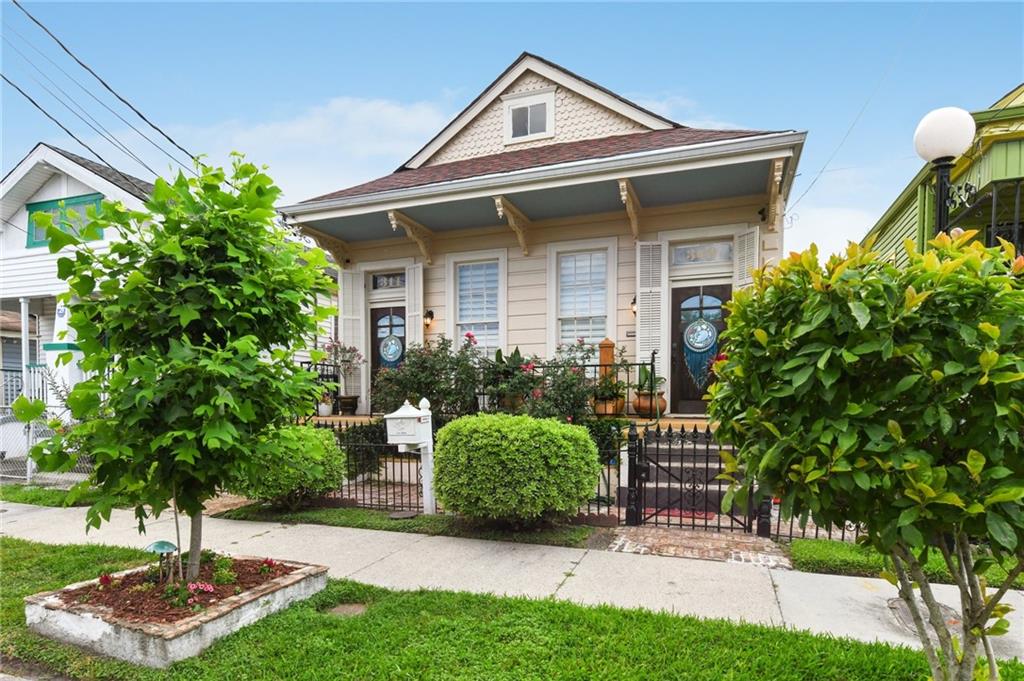
Active
$299,999
2
bds
|
2
ba
|
1,160
sqft
|
built
1860
1509 N Derbigny St, New Orleans, LA 70116
$-247
Cash flow
-4.3%
Cash-on-Cash Return
4.7%
Cap rate
0.6%
Rent to Value Ratio
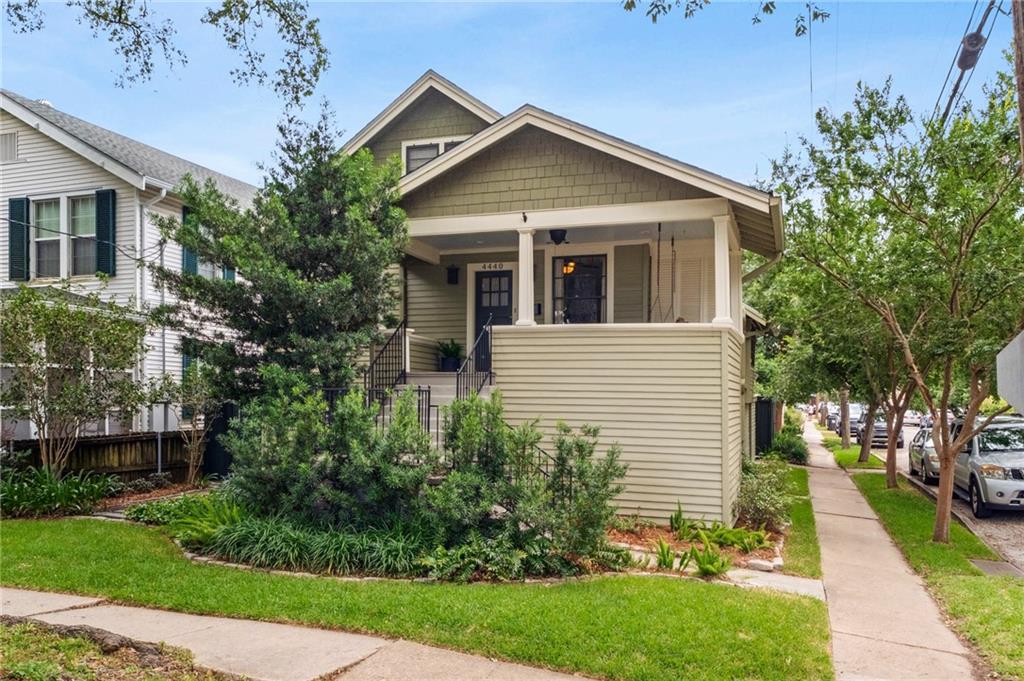
Active
$599,000
5
bds
|
3
ba
|
2,859
sqft
|
built
1932
4440 Bienville St, New Orleans, LA 70119
$-903
Cash flow
-7.9%
Cash-on-Cash Return
3.9%
Cap rate
0.5%
Rent to Value Ratio
Active
$160,000
2
bds
|
2
ba
|
1,300
sqft
|
built
1986
7522 Adventure Ave, New Orleans, LA 70129
$485
Cash flow
15.8%
Cash-on-Cash Return
9.3%
Cap rate
1.1%
Rent to Value Ratio
Active
$285,000
3
bds
|
2
ba
|
1,648
sqft
|
built
1913
1560 N Tonti St, New Orleans, LA 70119
$169
Cash flow
3.1%
Cash-on-Cash Return
6.4%
Cap rate
0.8%
Rent to Value Ratio
Active
$3,650,000
6
bds
|
8
ba
|
11,455
sqft
|
built
1856
2523 Prytania St, New Orleans, LA 70130
$-14,099
Cash flow
-20.2%
Cash-on-Cash Return
1.0%
Cap rate
0.1%
Rent to Value Ratio
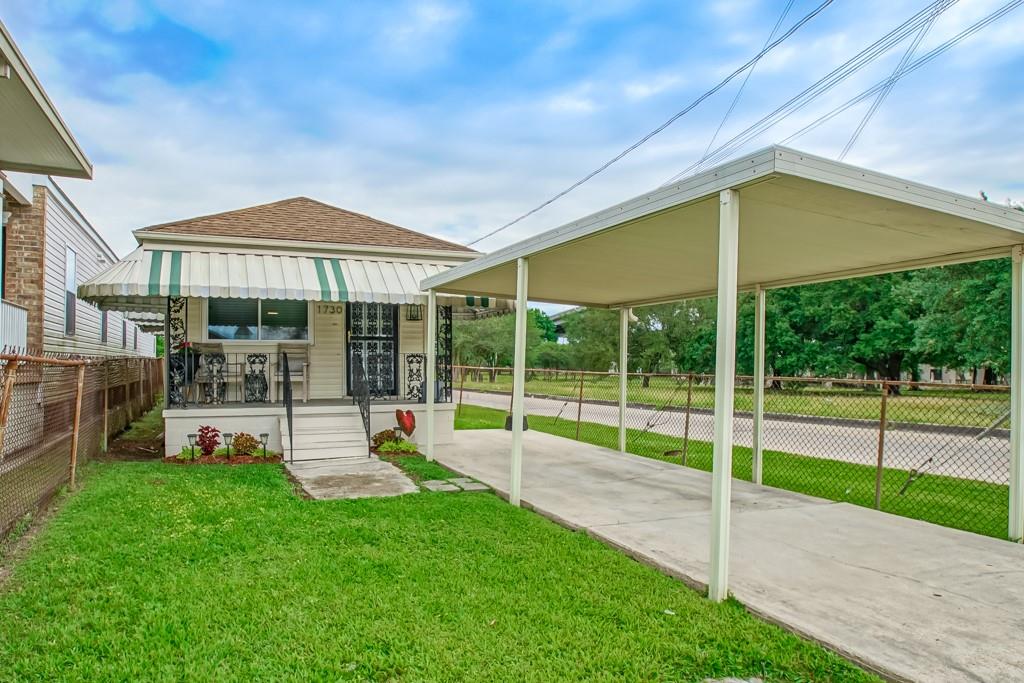
Active
$103,500
1
bds
|
1
ba
|
700
sqft
|
built
1983
1730 Erie St, New Orleans, LA 70114
$476
Cash flow
24.0%
Cash-on-Cash Return
11.2%
Cap rate
1.4%
Rent to Value Ratio
Active
$415,000
2
bds
|
2
ba
|
1,508
sqft
|
built
1927
2609 General Pershing St, New Orleans, LA 70115
$-239
Cash flow
-3.0%
Cash-on-Cash Return
5.0%
Cap rate
0.6%
Rent to Value Ratio
Active
$214,000
4
bds
|
2
ba
|
2,091
sqft
|
built
1890
5530 Dauphine St, New Orleans, LA 70117
$367
Cash flow
8.9%
Cash-on-Cash Return
7.7%
Cap rate
0.9%
Rent to Value Ratio
Active
$299,000
4
bds
|
0
ba
|
1,952
sqft
|
built
1982
1740 Abundance St, New Orleans, LA 70119
$-449
Cash flow
-7.8%
Cash-on-Cash Return
3.9%
Cap rate
0.5%
Rent to Value Ratio
Active
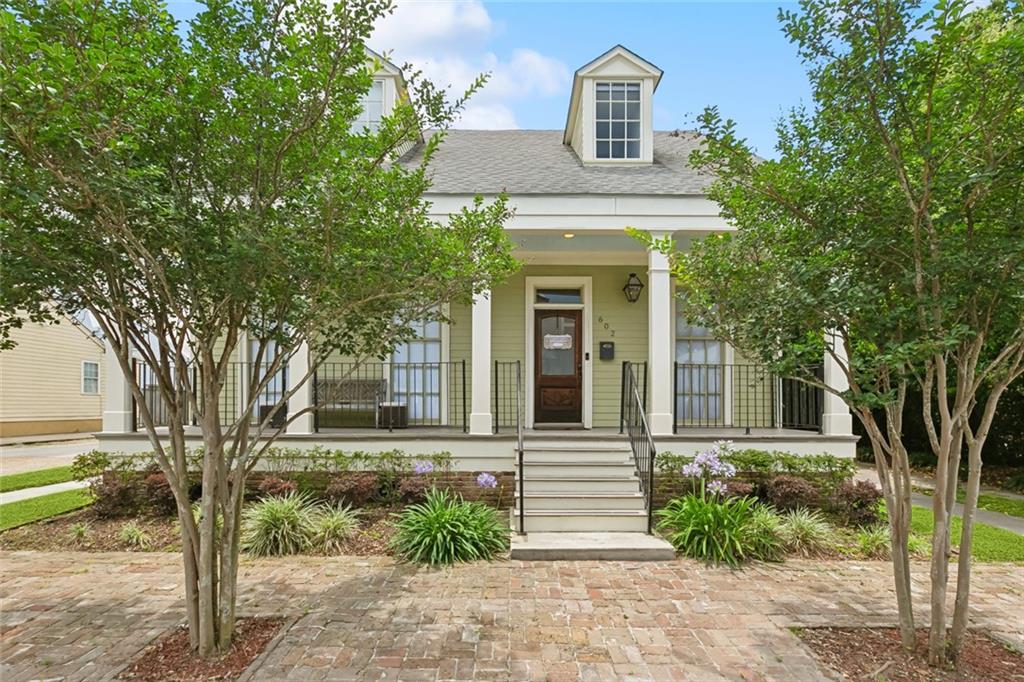
$725,000
3
bds
|
4
ba
|
2,114
sqft
|
built
2016
602 8th St, New Orleans, LA 70115
$-671
Cash flow
-4.8%
Cash-on-Cash Return
4.6%
Cap rate
0.6%
Rent to Value Ratio
Active
$70,000
2
bds
|
2
ba
|
1,083
sqft
|
built
1985
3034 Clouet St, New Orleans, LA 70126
$828
Cash flow
13.8%
Cash-on-Cash Return
14.2%
Cap rate
1.7%
Rent to Value Ratio
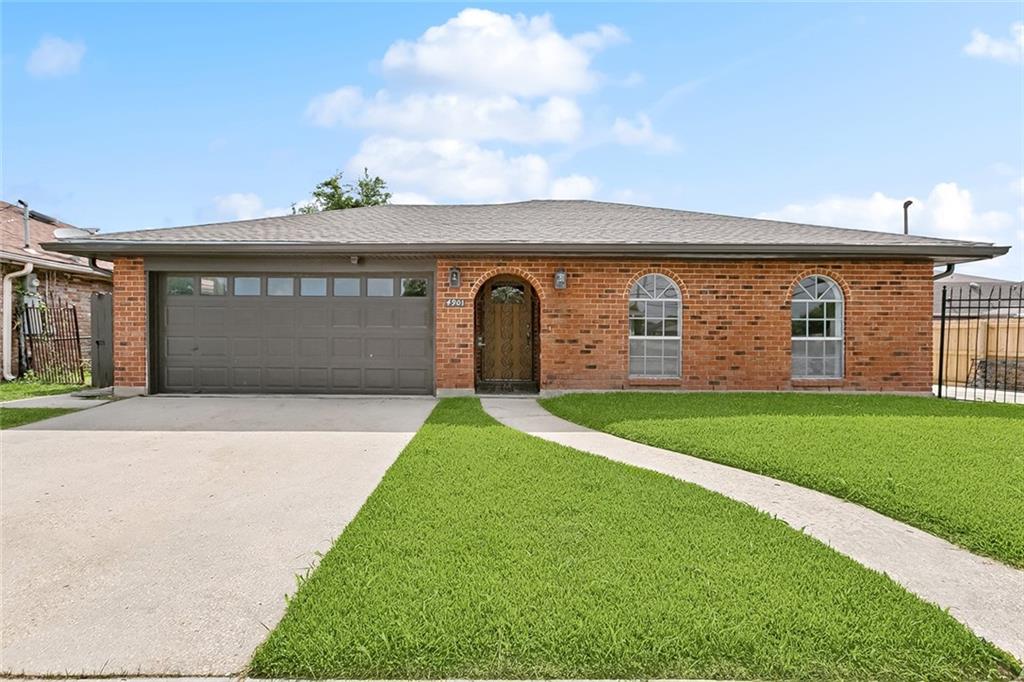
Active
$229,000
3
bds
|
3
ba
|
1,799
sqft
|
built
1965
4901 Friar Tuck Dr, New Orleans, LA 70128
$158
Cash flow
3.6%
Cash-on-Cash Return
6.5%
Cap rate
0.8%
Rent to Value Ratio
Active
$330,000
3
bds
|
2
ba
|
1,768
sqft
|
built
1977
309 Diana St, New Orleans, LA 70114
$-596
Cash flow
-9.4%
Cash-on-Cash Return
3.5%
Cap rate
0.4%
Rent to Value Ratio
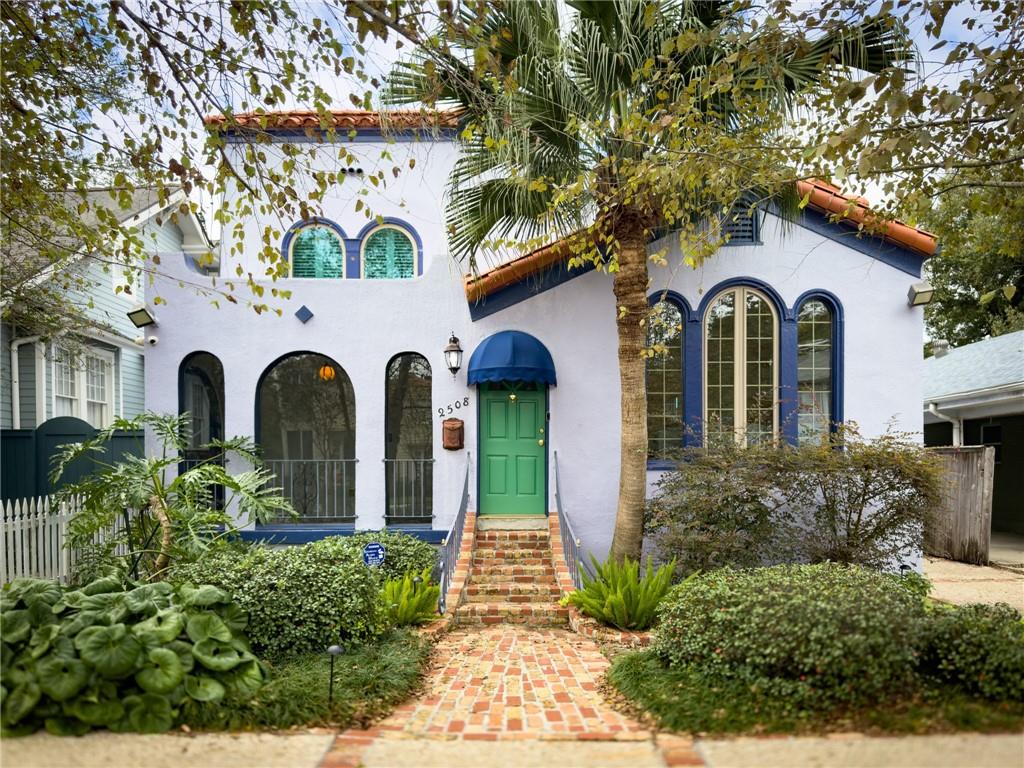
Active
$775,000
3
bds
|
3
ba
|
2,640
sqft
|
built
1924
2508 Joseph St, New Orleans, LA 70115
$-287
Cash flow
-1.9%
Cash-on-Cash Return
5.2%
Cap rate
0.6%
Rent to Value Ratio
Active
$575,000
3
bds
|
1
ba
|
1,794
sqft
|
built
1900
2728 Bell St, New Orleans, LA 70119
$-789
Cash flow
-7.2%
Cash-on-Cash Return
4.0%
Cap rate
0.5%
Rent to Value Ratio
Active
$209,000
5
bds
|
2
ba
|
1,603
sqft
|
built
2015
4900 America St, New Orleans, LA 70126
$529
Cash flow
13.2%
Cash-on-Cash Return
8.7%
Cap rate
1.1%
Rent to Value Ratio
Active
$600,000
3
bds
|
3
ba
|
1,983
sqft
|
built
1924
4628 Cleveland Ave, New Orleans, LA 70119
$-424
Cash flow
-3.7%
Cash-on-Cash Return
4.8%
Cap rate
0.6%
Rent to Value Ratio
Active
$296,000
4
bds
|
3
ba
|
2,881
sqft
|
built
1972
7330 Perth St, New Orleans, LA 70126
$531
Cash flow
9.4%
Cash-on-Cash Return
7.8%
Cap rate
0.9%
Rent to Value Ratio
Active
$195,000
2
bds
|
1
ba
|
822
sqft
|
built
1924
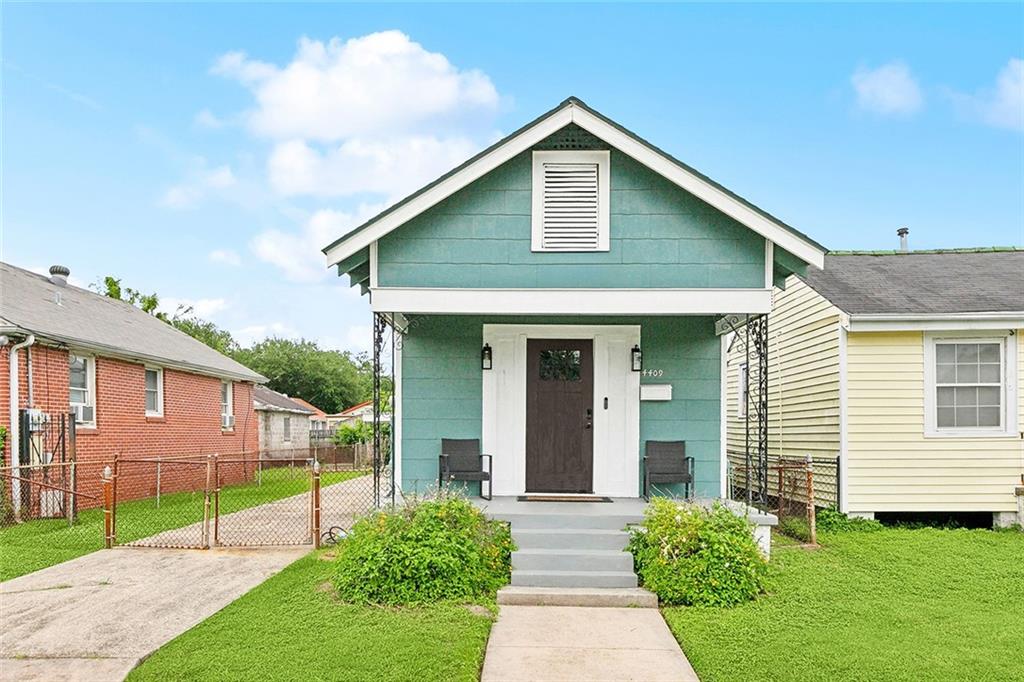
4409 Annette St, New Orleans, LA 70122
$181
Cash flow
4.8%
Cash-on-Cash Return
6.8%
Cap rate
0.8%
Rent to Value Ratio
Active
$225,000
4
bds
|
3
ba
|
2,920
sqft
|
built
1985
3500 Silver Maple Ct, New Orleans, LA 70131
$852
Cash flow
19.8%
Cash-on-Cash Return
10.2%
Cap rate
1.2%
Rent to Value Ratio
Active
$220,000
4
bds
|
0
ba
|
1,320
sqft
|
built
1971
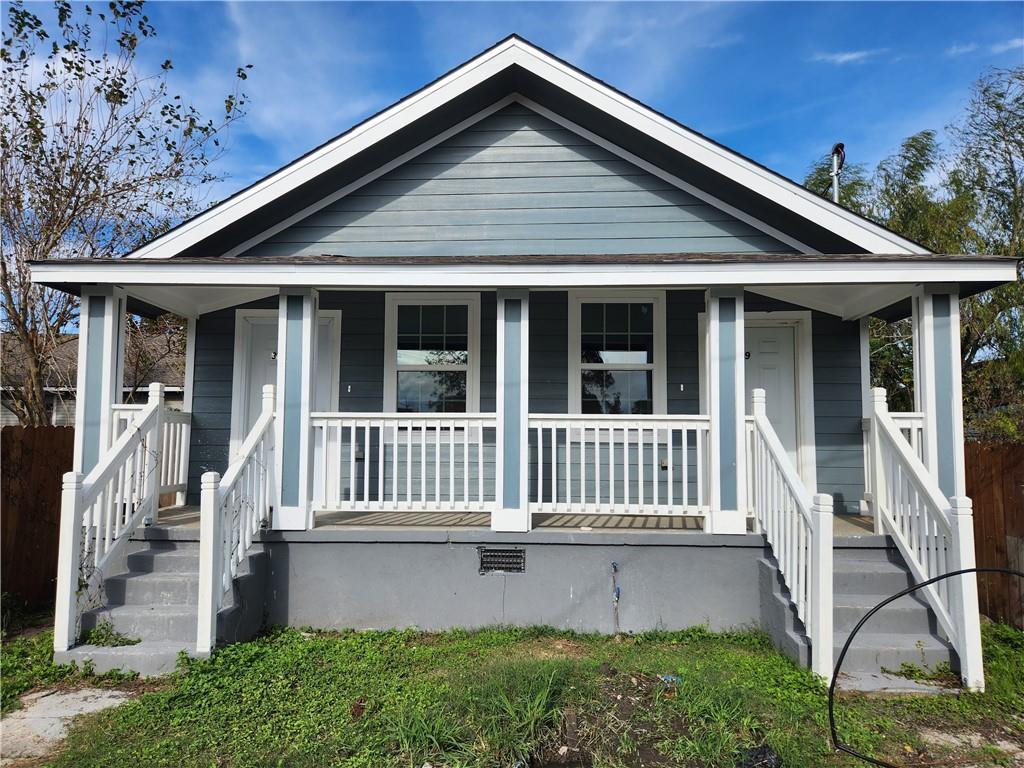
3107 Industrial Ct, New Orleans, LA 70117
$201
Cash flow
4.8%
Cash-on-Cash Return
6.8%
Cap rate
0.8%
Rent to Value Ratio
Active
$1,359,000
4
bds
|
5
ba
|
3,444
sqft
|
built
1858
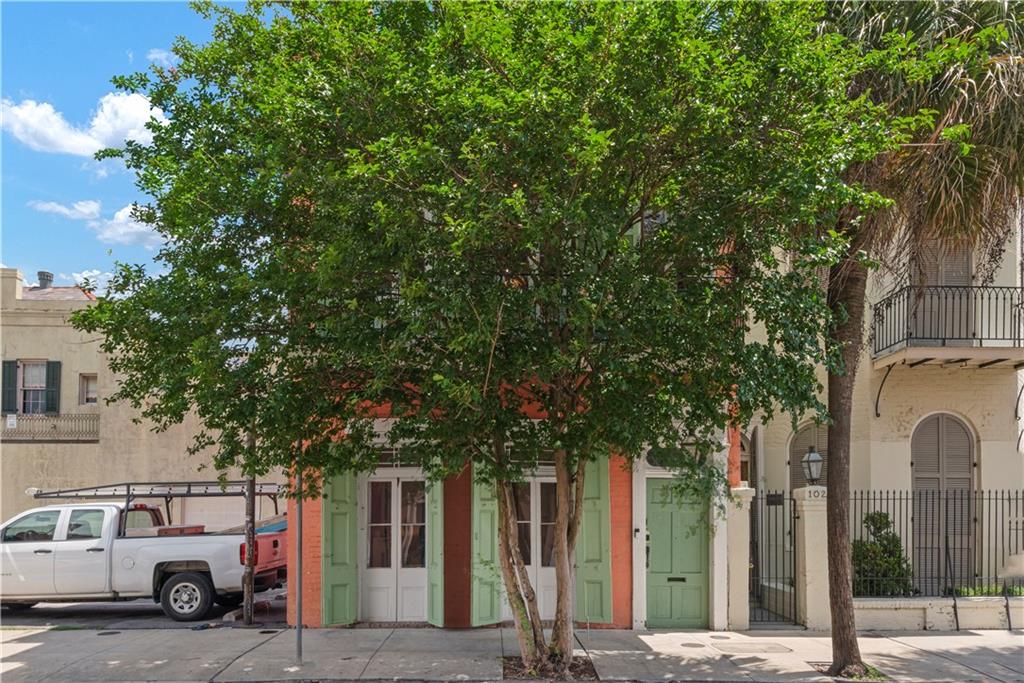
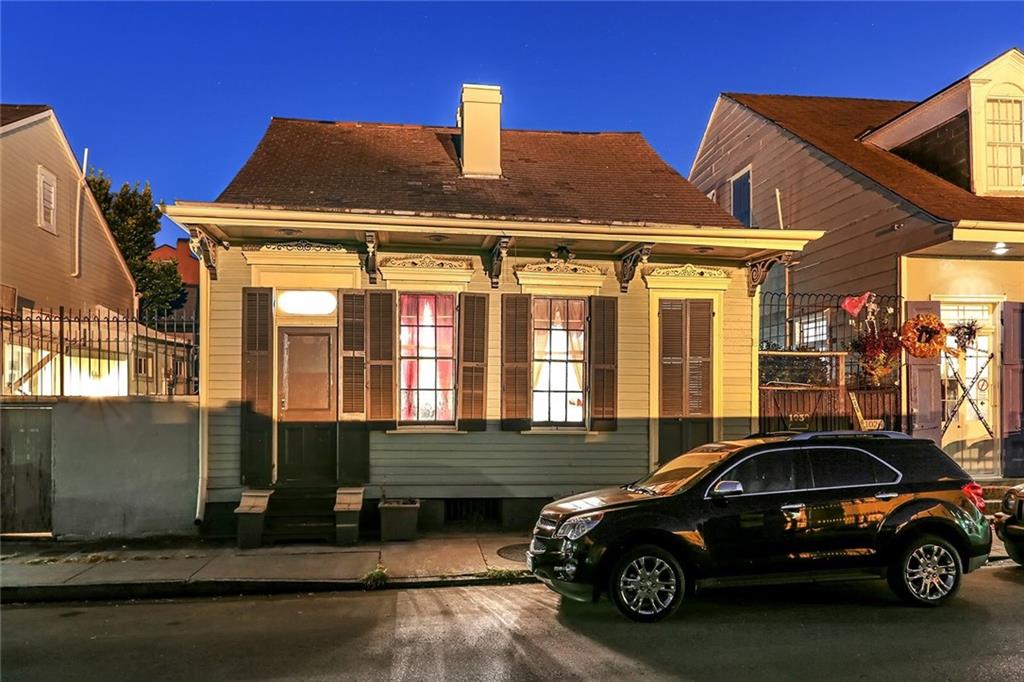
1031 Orleans Ave, New Orleans, LA 70116
$-3,671
Cash flow
-14.1%
Cash-on-Cash Return
2.4%
Cap rate
0.3%
Rent to Value Ratio
Active
$699,900
6
bds
|
0
ba
|
4,196
sqft
|
built
1952
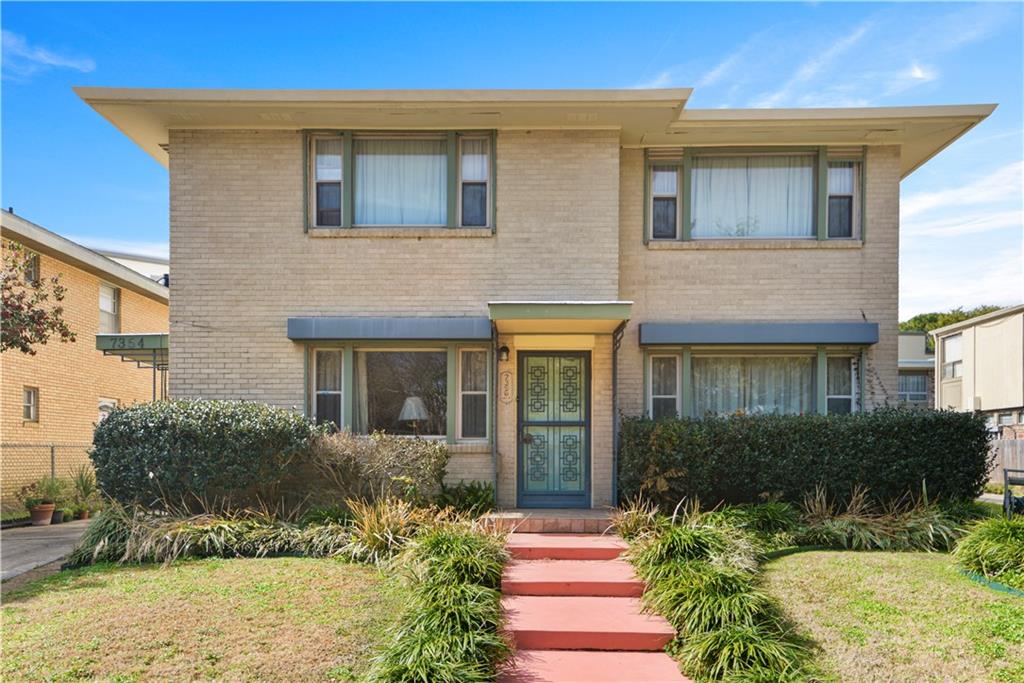
7356 Cameo St, New Orleans, LA 70124
$-2,208
Cash flow
-16.5%
Cash-on-Cash Return
1.9%
Cap rate
0.2%
Rent to Value Ratio
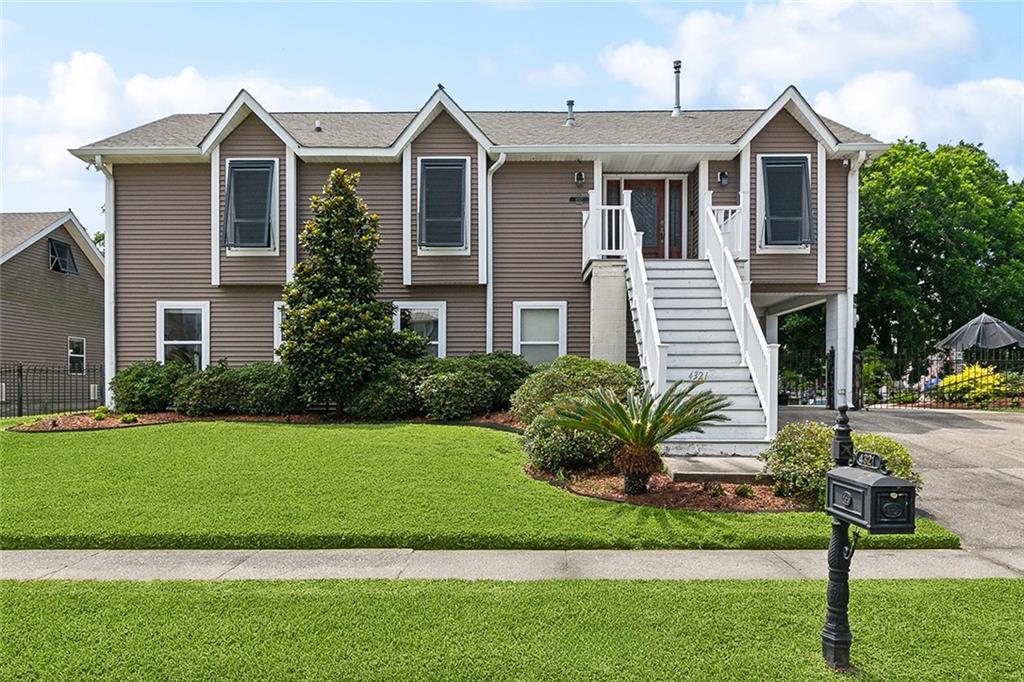
Active
$390,000
3
bds
|
3
ba
|
1,627
sqft
|
built
1985
4321 San Remo Rd, New Orleans, LA 70129
$-264
Cash flow
-3.5%
Cash-on-Cash Return
4.9%
Cap rate
0.6%
Rent to Value Ratio
Active
$525,000
3
bds
|
3
ba
|
2,904
sqft
|
built
1923
2134 Harmony St, New Orleans, LA 70115
$-345
Cash flow
-3.4%
Cash-on-Cash Return
4.9%
Cap rate
0.6%
Rent to Value Ratio
Active
$177,000
3
bds
|
2
ba
|
2,011
sqft
|
built
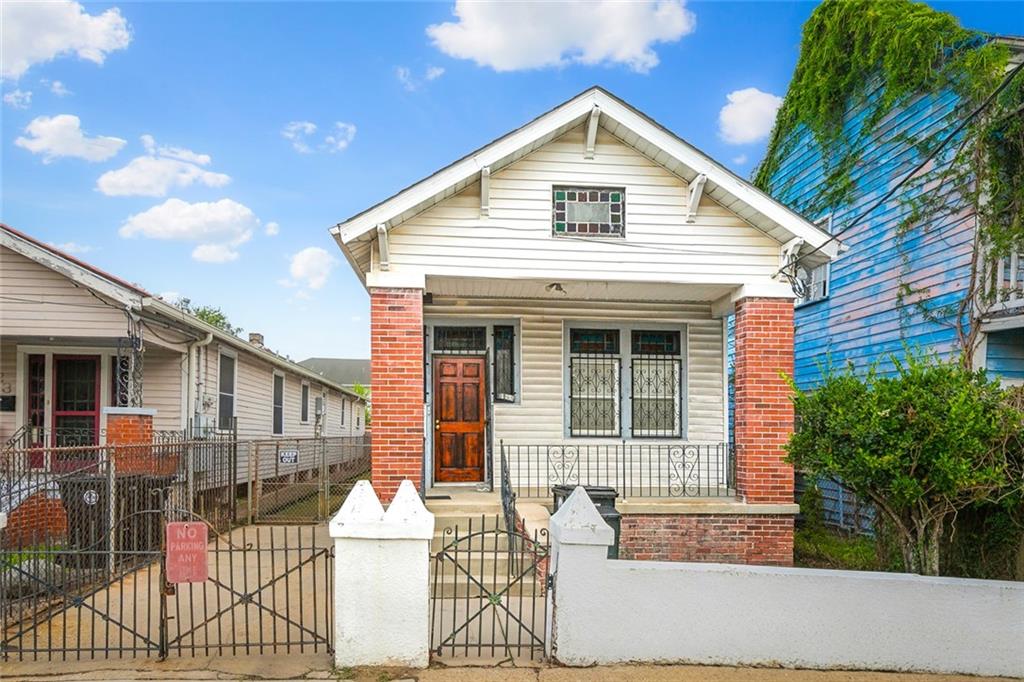
1950
925 N Prieur St, New Orleans, LA 70116
$749
Cash flow
22.1%
Cash-on-Cash Return
10.8%
Cap rate
1.3%
Rent to Value Ratio
Active
$264,999
4
bds
|
3
ba
|
2,208
sqft
|
built
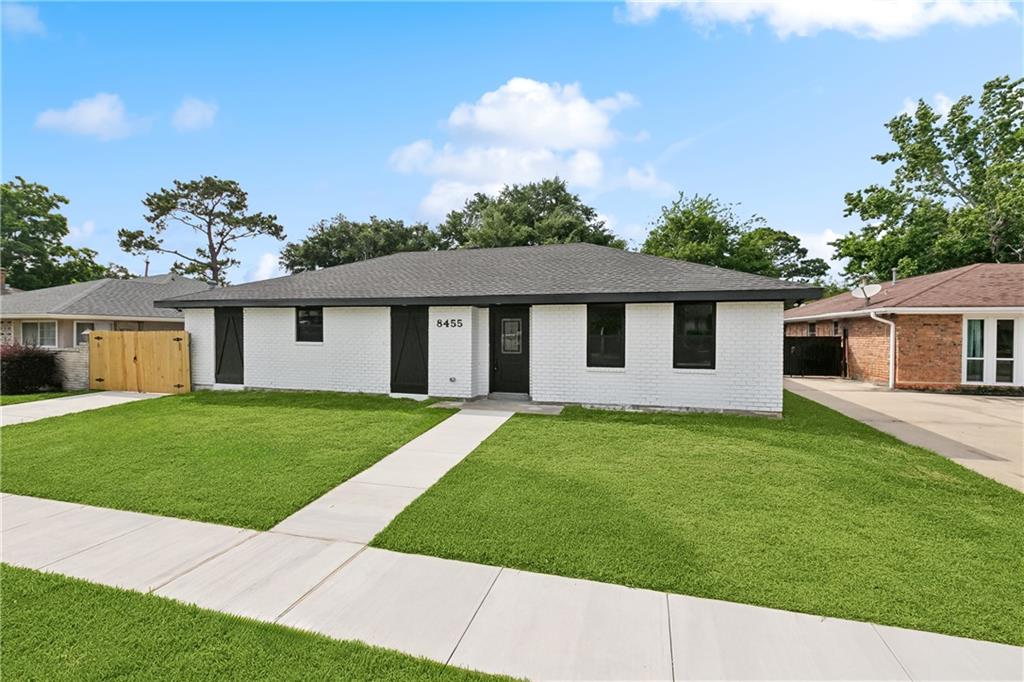
1970
8455 Huntington Park Dr, New Orleans, LA 70127
$126
Cash flow
2.5%
Cash-on-Cash Return
6.2%
Cap rate
0.8%
Rent to Value Ratio
Active
$1,500,000
5
bds
|
4
ba
|
3,600
sqft
|
built
1844
1030 Burgundy St, New Orleans, LA 70116
$-3,165
Cash flow
-11.0%
Cash-on-Cash Return
3.1%
Cap rate
0.4%
Rent to Value Ratio
Active
$1,250,000
5
bds
|
0
ba
|
2,925
sqft
|
built
1920
1228 Pine St, New Orleans, LA 70118
$-2,879
Cash flow
-12.0%
Cash-on-Cash Return
2.9%
Cap rate
0.4%
Rent to Value Ratio
Active
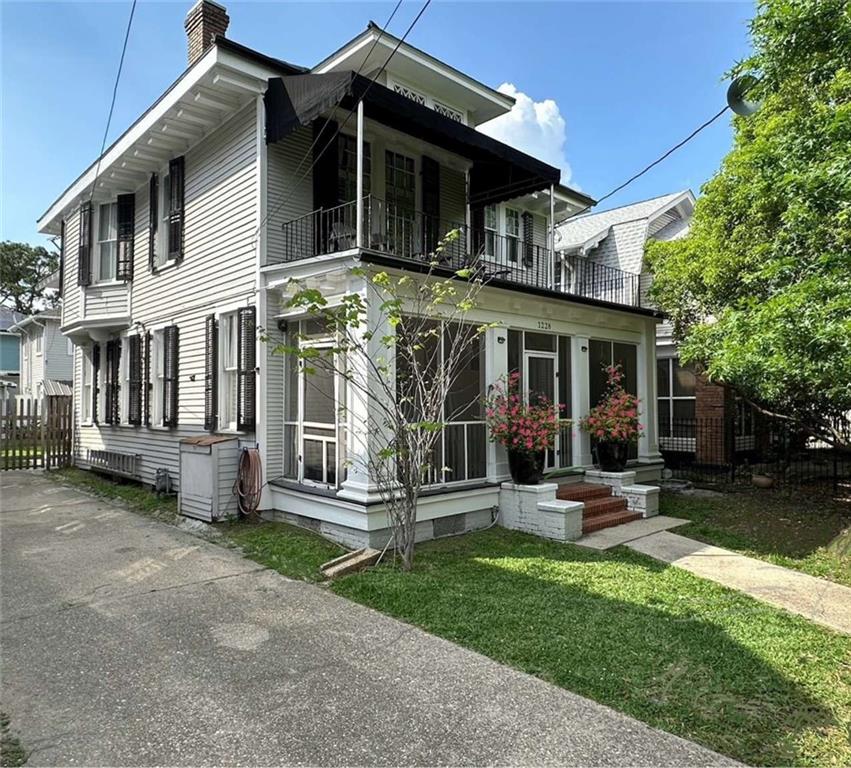
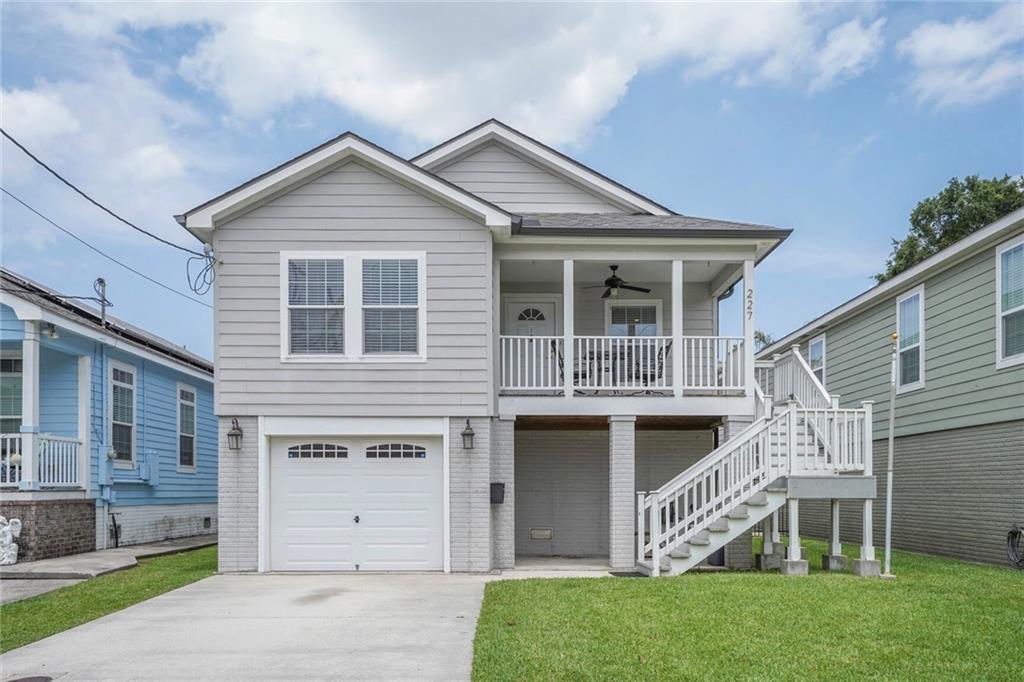
$435,000
3
bds
|
2
ba
|
1,785
sqft
|
built
2009
227 20th St, New Orleans, LA 70124
$-334
Cash flow
-4.0%
Cash-on-Cash Return
4.8%
Cap rate
0.6%
Rent to Value Ratio
Active
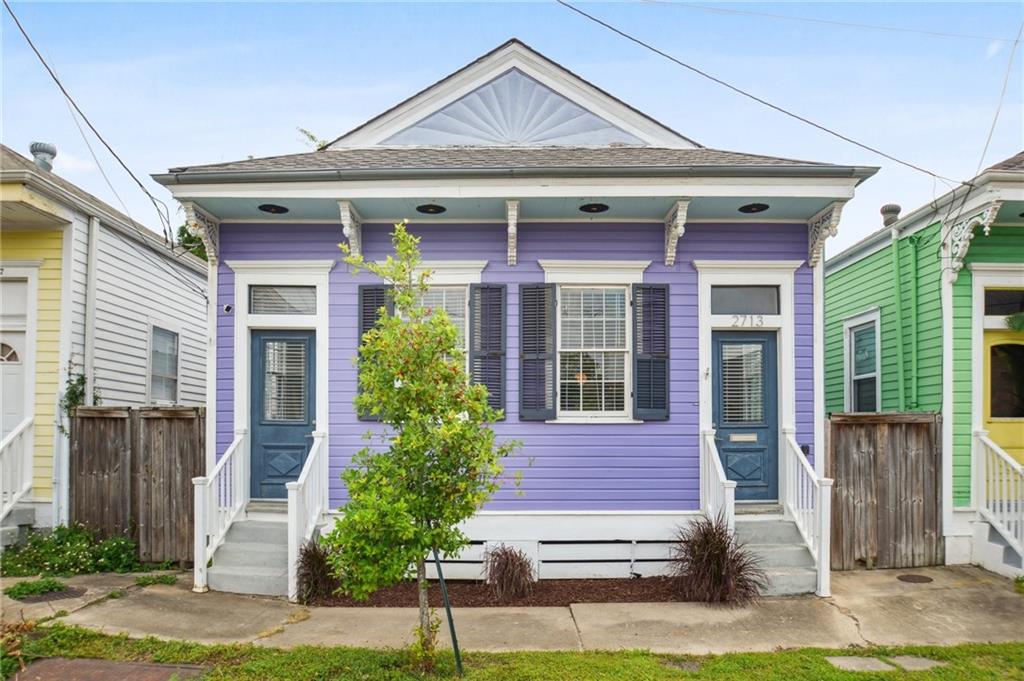
$250,000
2
bds
|
2
ba
|
1,172
sqft
|
built
1916
2713 2nd St, New Orleans, LA 70113
$-79
Cash flow
-1.6%
Cash-on-Cash Return
5.3%
Cap rate
0.6%
Rent to Value Ratio
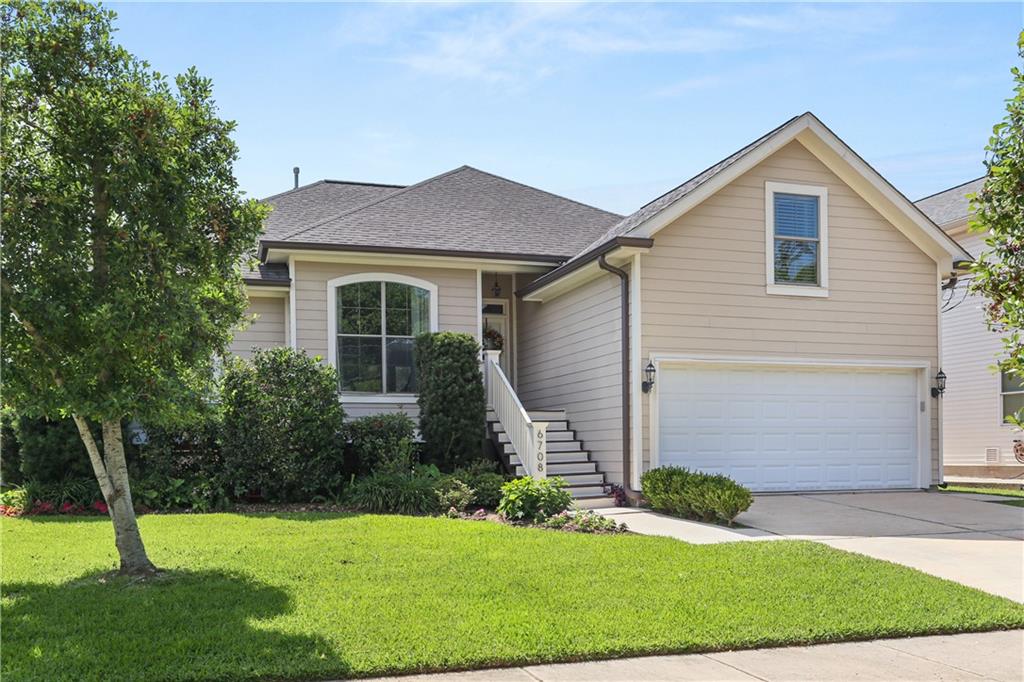
Active under contract
$485,000
4
bds
|
2
ba
|
2,033
sqft
|
built
2012
6708 Fleur De Lis Dr, New Orleans, LA 70124
$-363
Cash flow
-3.9%
Cash-on-Cash Return
4.8%
Cap rate
0.6%
Rent to Value Ratio
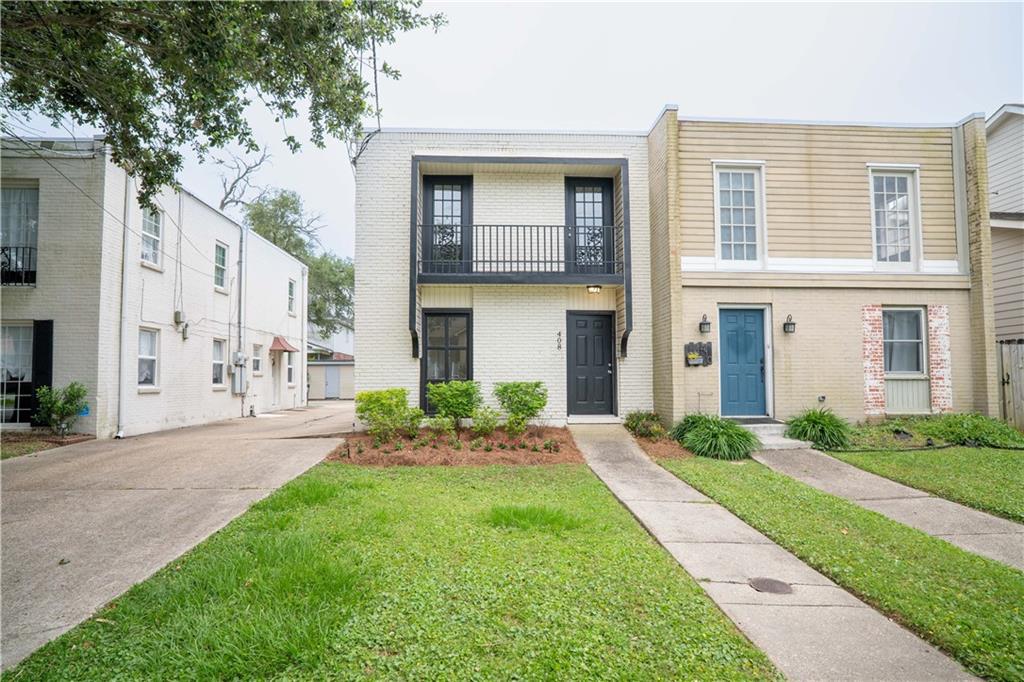
Active
$275,000
3
bds
|
3
ba
|
1,650
sqft
|
built
1970
408 22nd St, New Orleans, LA 70124
$217
Cash flow
4.1%
Cash-on-Cash Return
6.6%
Cap rate
0.8%
Rent to Value Ratio
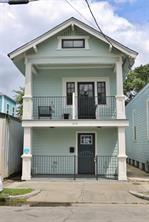
Active
$389,000
4
bds
|
3
ba
|
2,010
sqft
|
built
1928
324 N Roman St, New Orleans, LA 70112
$91
Cash flow
1.2%
Cash-on-Cash Return
6.0%
Cap rate
0.7%
Rent to Value Ratio
Active
$950,000
3
bds
|
3
ba
|
2,855
sqft
|
built
1917
801 Saint Joseph St, New Orleans, LA 70113
$955
Cash flow
5.2%
Cash-on-Cash Return
6.9%
Cap rate
0.8%
Rent to Value Ratio