Orleans Parish County Investment Properties for Sale
Browse homes for sale and investment properties in Orleans Parish County. Refine your search by price, property type, or more.
Best cash flowing properties in Orleans Parish County

Active
$124,000
2
bds
|
2
ba
|
1,140
sqft
|
built
2009
3212 Boyd St, New Orleans, LA 70131
$448
Cash flow
18.8%
Cash-on-Cash Return
10.0%
Cap rate
1.2%
Rent to Value Ratio

Active
$325,000
4
bds
|
2
ba
|
2,512
sqft
|
built
1940
3920 General Ogden St, New Orleans, LA 70118
$394
Cash flow
6.3%
Cash-on-Cash Return
7.1%
Cap rate
0.9%
Rent to Value Ratio
1,863 out of 1,870 properties for sale in Orleans Parish County
Limited Results Shown
Create a free account, or log in to reveal all property listings and enjoy the complete experience.

Active
$569,000
4
bds
|
3
ba
|
2,357
sqft
|
built
2013
5538 Rosemary Pl, New Orleans, LA 70124
$-278
Cash flow
-2.5%
Cash-on-Cash Return
5.1%
Cap rate
0.6%
Rent to Value Ratio

Active
$285,000
4
bds
|
3
ba
|
3,000
sqft
|
built
1995
2929 Hudson St, New Orleans, LA 70114
$376
Cash flow
6.9%
Cash-on-Cash Return
7.3%
Cap rate
0.9%
Rent to Value Ratio
Active
$124,000
2
bds
|
2
ba
|
1,140
sqft
|
built
2009
3212 Boyd St, New Orleans, LA 70131
$448
Cash flow
18.8%
Cash-on-Cash Return
10.0%
Cap rate
1.2%
Rent to Value Ratio

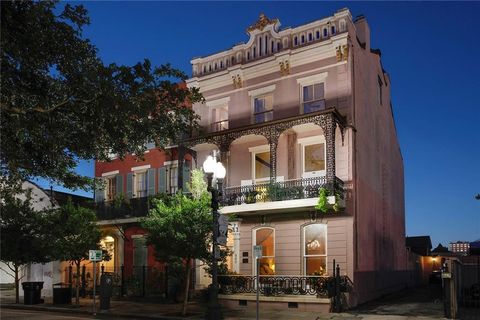
Active
$535,000
2
bds
|
3
ba
|
1,508
sqft
|
built
1870
912 Spain St, New Orleans, LA 70117
$-117
Cash flow
-1.1%
Cash-on-Cash Return
5.4%
Cap rate
0.7%
Rent to Value Ratio
Active
$1,495,000
5
bds
|
4
ba
|
4,633
sqft
|
built
1845
842 Camp St, New Orleans, LA 70130
$-4,384
Cash flow
-15.3%
Cash-on-Cash Return
2.2%
Cap rate
0.3%
Rent to Value Ratio

Active
$419,000
4
bds
|
0
ba
|
1,804
sqft
|
built
1950
4520 Baudin St, New Orleans, LA 70119
$-603
Cash flow
-7.5%
Cash-on-Cash Return
4.0%
Cap rate
0.5%
Rent to Value Ratio

Active
$193,999
3
bds
|
2
ba
|
1,324
sqft
|
built
2006
5926 Tullis Dr, New Orleans, LA 70131
$324
Cash flow
8.7%
Cash-on-Cash Return
7.7%
Cap rate
0.9%
Rent to Value Ratio

Active
$798,900
5
bds
|
3
ba
|
2,292
sqft
|
built
2019
1631 Baronne St, New Orleans, LA 70113
$-2,194
Cash flow
-14.3%
Cash-on-Cash Return
2.4%
Cap rate
0.3%
Rent to Value Ratio

Active
$650,000
4
bds
|
3
ba
|
2,123
sqft
|
built
1914
7715 Panola St, New Orleans, LA 70118
$-1,144
Cash flow
-9.2%
Cash-on-Cash Return
3.6%
Cap rate
0.4%
Rent to Value Ratio

Active
$240,000
1
bds
|
1
ba
|
672
sqft
|
built
1912
760 Magazine St, New Orleans, LA 70130
$37
Cash flow
0.8%
Cash-on-Cash Return
5.9%
Cap rate
0.7%
Rent to Value Ratio

Active
$525,000
1
bds
|
1
ba
|
947
sqft
|
built
2018
1001 Julia St, New Orleans, LA 70113
$-69
Cash flow
-0.7%
Cash-on-Cash Return
5.5%
Cap rate
0.7%
Rent to Value Ratio
Active
$325,000
4
bds
|
2
ba
|
2,512
sqft
|
built
1940
3920 General Ogden St, New Orleans, LA 70118
$394
Cash flow
6.3%
Cash-on-Cash Return
7.1%
Cap rate
0.9%
Rent to Value Ratio

Active
$115,000
3
bds
|
1
ba
|
1,061
sqft
|
built
1960
3855 Metropolitan St, New Orleans, LA 70126
$353
Cash flow
16.0%
Cash-on-Cash Return
9.4%
Cap rate
1.1%
Rent to Value Ratio

Active
$324,900
3
bds
|
3
ba
|
1,687
sqft
|
built
1970
521 S Alexander St, New Orleans, LA 70119
$49
Cash flow
0.8%
Cash-on-Cash Return
5.9%
Cap rate
0.7%
Rent to Value Ratio

Active
$349,900
4
bds
|
2
ba
|
2,167
sqft
|
built
1970
321 18th St, New Orleans, LA 70124
$138
Cash flow
2.1%
Cash-on-Cash Return
6.2%
Cap rate
0.7%
Rent to Value Ratio
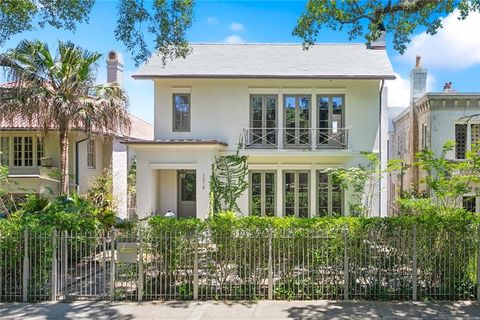
Active
$1,825,000
4
bds
|
4
ba
|
3,385
sqft
|
built
1930
1215 Exposition Blvd, New Orleans, LA 70118
$-3,668
Cash flow
-10.5%
Cash-on-Cash Return
3.3%
Cap rate
0.4%
Rent to Value Ratio

Active
$355,000
3
bds
|
2
ba
|
1,375
sqft
|
built
1999
1819 Baronne St, New Orleans, LA 70113
$-438
Cash flow
-6.4%
Cash-on-Cash Return
4.2%
Cap rate
0.5%
Rent to Value Ratio

Active
$480,000
3
bds
|
2
ba
|
1,843
sqft
|
built
2013
110 Sharon Dr, New Orleans, LA 70124
$143
Cash flow
1.6%
Cash-on-Cash Return
6.0%
Cap rate
0.7%
Rent to Value Ratio

Active
$224,900
2
bds
|
2
ba
|
1,440
sqft
|
built
1950
839 Behrman Ave, New Orleans, LA 70114
$40
Cash flow
0.9%
Cash-on-Cash Return
5.9%
Cap rate
0.7%
Rent to Value Ratio

Active
$135,000
3
bds
|
0
ba
|
1,317
sqft
|
built
1960
3025 Saint Roch Ave, New Orleans, LA 70122
$327
Cash flow
12.6%
Cash-on-Cash Return
8.6%
Cap rate
1.0%
Rent to Value Ratio
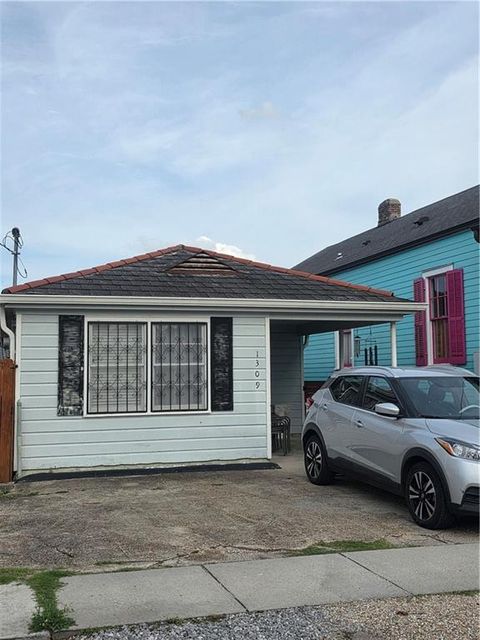
Active
$149,900
3
bds
|
2
ba
|
1,035
sqft
|
built
1955
1309 Independence St, New Orleans, LA 70117
$257
Cash flow
8.9%
Cash-on-Cash Return
7.7%
Cap rate
0.9%
Rent to Value Ratio
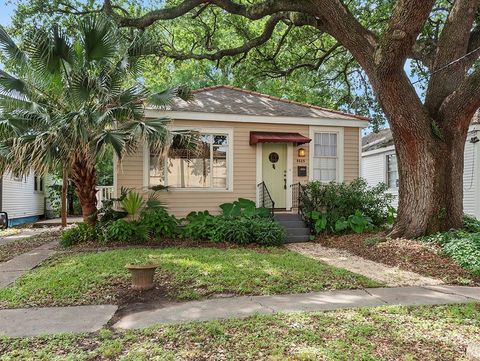
Active
$289,900
2
bds
|
1
ba
|
909
sqft
|
built
1948
5525 Marshal Foch St, New Orleans, LA 70124
$8
Cash flow
0.1%
Cash-on-Cash Return
5.7%
Cap rate
0.7%
Rent to Value Ratio

Active
$375,000
1
bds
|
1
ba
|
778
sqft
|
built
1950
1111 Tulane Ave, New Orleans, LA 70112
$-395
Cash flow
-5.5%
Cash-on-Cash Return
4.4%
Cap rate
0.5%
Rent to Value Ratio

Active
$270,000
4
bds
|
0
ba
|
1,704
sqft
|
built
1920
2038 Elysian Fields Ave, New Orleans, LA 70117
$-36
Cash flow
-0.7%
Cash-on-Cash Return
5.5%
Cap rate
0.7%
Rent to Value Ratio

Active
$260,000
4
bds
|
2
ba
|
1,883
sqft
|
built
1965
6133 Carlisle Ct, New Orleans, LA 70131
$150
Cash flow
3.0%
Cash-on-Cash Return
6.4%
Cap rate
0.8%
Rent to Value Ratio

Active
$499,900
2
bds
|
1
ba
|
1,318
sqft
|
built
1974
3262 Ridgeway Blvd, New Orleans, LA 70129
$-365
Cash flow
-3.8%
Cash-on-Cash Return
4.8%
Cap rate
0.6%
Rent to Value Ratio

Active
$249,900
3
bds
|
2
ba
|
1,196
sqft
|
built
2008
3725 Clermont Dr, New Orleans, LA 70122
$59
Cash flow
1.2%
Cash-on-Cash Return
6.0%
Cap rate
0.7%
Rent to Value Ratio

Active
$275,000
1
bds
|
1
ba
|
589
sqft
|
built
1985
822 Touro St, New Orleans, LA 70116
$-197
Cash flow
-3.7%
Cash-on-Cash Return
4.8%
Cap rate
0.6%
Rent to Value Ratio
Active
$299,000
4
bds
|
0
ba
|
2,115
sqft
|
built
1950
2315 Peniston St, New Orleans, LA 70115
$-35
Cash flow
-0.6%
Cash-on-Cash Return
5.5%
Cap rate
0.7%
Rent to Value Ratio

Active
$450,000
2
bds
|
2
ba
|
1,427
sqft
|
built
1983
1750 Saint Charles Ave, New Orleans, LA 70130
$-267
Cash flow
-3.1%
Cash-on-Cash Return
5.0%
Cap rate
0.6%
Rent to Value Ratio

Active
$369,000
3
bds
|
2
ba
|
1,408
sqft
|
built
1956
6817 Catina St, New Orleans, LA 70124
$-21
Cash flow
-0.3%
Cash-on-Cash Return
5.6%
Cap rate
0.7%
Rent to Value Ratio

Active
$189,900
2
bds
|
2
ba
|
1,472
sqft
|
built
1968
2820 Annette St, New Orleans, LA 70119
$274
Cash flow
7.5%
Cash-on-Cash Return
7.4%
Cap rate
0.9%
Rent to Value Ratio
Active
$425,000
2
bds
|
2
ba
|
1,582
sqft
|
built
1854
1113 Peniston St, New Orleans, LA 70115
$-10
Cash flow
-0.1%
Cash-on-Cash Return
5.6%
Cap rate
0.7%
Rent to Value Ratio

Active
$389,000
3
bds
|
4
ba
|
1,507
sqft
|
built
1936
2025 1st St, New Orleans, LA 70113
$-461
Cash flow
-6.2%
Cash-on-Cash Return
4.3%
Cap rate
0.5%
Rent to Value Ratio

Active
$550,000
4
bds
|
3
ba
|
2,650
sqft
|
built
1922
531 Olivier St, New Orleans, LA 70114
$-188
Cash flow
-1.8%
Cash-on-Cash Return
5.3%
Cap rate
0.6%
Rent to Value Ratio

Active
$250,000
3
bds
|
3
ba
|
1,471
sqft
|
built
2004
5320 Wickfield Dr, New Orleans, LA 70122
$59
Cash flow
1.2%
Cash-on-Cash Return
6.0%
Cap rate
0.7%
Rent to Value Ratio

Active
$1,050,000
4
bds
|
3
ba
|
2,760
sqft
|
built
1920
318 Walnut St, New Orleans, LA 70118
$-1,174
Cash flow
-5.8%
Cash-on-Cash Return
4.3%
Cap rate
0.5%
Rent to Value Ratio

Active
$399,900
5
bds
|
4
ba
|
3,284
sqft
|
built
1972
3501 Pin Oak Ave, New Orleans, LA 70131
$-320
Cash flow
-4.2%
Cash-on-Cash Return
4.7%
Cap rate
0.6%
Rent to Value Ratio

Active
$598,000
2
bds
|
3
ba
|
2,016
sqft
|
built
1963
1729 Prytania St, New Orleans, LA 70130
$-691
Cash flow
-6.0%
Cash-on-Cash Return
4.3%
Cap rate
0.5%
Rent to Value Ratio

Active
$420,000
4
bds
|
3
ba
|
2,168
sqft
|
built
1940
3519 Octavia St, New Orleans, LA 70125
$13
Cash flow
0.2%
Cash-on-Cash Return
5.7%
Cap rate
0.7%
Rent to Value Ratio