Orleans Parish County Investment Properties for Sale
Browse homes for sale and investment properties in Orleans Parish County. Refine your search by price, property type, or more.
Best cash flowing properties in Orleans Parish County

Active
$85,000
3
bds
|
2
ba
|
1,244
sqft
|
built
1959
1247 Foy St, New Orleans, LA 70122
$978
Cash flow
60.0%
Cash-on-Cash Return
19.5%
Cap rate
2.4%
Rent to Value Ratio

Active
$105,000
3
bds
|
1
ba
|
950
sqft
|
built
1986
6228 Warrington Dr, New Orleans, LA 70122
$883
Cash flow
43.9%
Cash-on-Cash Return
15.8%
Cap rate
1.9%
Rent to Value Ratio
1,863 out of 1,870 properties for sale in Orleans Parish County
Limited Results Shown
Create a free account, or log in to reveal all property listings and enjoy the complete experience.

Active
$420,000
4
bds
|
3
ba
|
2,168
sqft
|
built
1940
3519 Octavia St, New Orleans, LA 70125
$13
Cash flow
0.2%
Cash-on-Cash Return
5.7%
Cap rate
0.7%
Rent to Value Ratio

Active
$700,000
3
bds
|
3
ba
|
2,798
sqft
|
built
2018
2522 Robert St, New Orleans, LA 70115
$-1,381
Cash flow
-10.3%
Cash-on-Cash Return
3.3%
Cap rate
0.4%
Rent to Value Ratio

Active
$409,000
6
bds
|
4
ba
|
1,824
sqft
|
built
1920
3115 Conti St, New Orleans, LA 70119
$-694
Cash flow
-8.9%
Cash-on-Cash Return
3.6%
Cap rate
0.4%
Rent to Value Ratio

Active
$699,000
4
bds
|
0
ba
|
3,280
sqft
|
built
1917
1517 Crete St, New Orleans, LA 70119
$-2,204
Cash flow
-16.5%
Cash-on-Cash Return
1.9%
Cap rate
0.2%
Rent to Value Ratio

Active
$139,900
2
bds
|
0
ba
|
1,325
sqft
|
built
1918
1624 N Miro St, New Orleans, LA 70119
$580
Cash flow
21.6%
Cash-on-Cash Return
10.7%
Cap rate
1.3%
Rent to Value Ratio

Active
$660,000
4
bds
|
3
ba
|
2,425
sqft
|
built
1950
6461 General Diaz St, New Orleans, LA 70124
$-1,122
Cash flow
-8.9%
Cash-on-Cash Return
3.6%
Cap rate
0.4%
Rent to Value Ratio

Active
$575,000
4
bds
|
2
ba
|
1,914
sqft
|
built
1938
5820 Magnolia St, New Orleans, LA 70115
$-306
Cash flow
-2.8%
Cash-on-Cash Return
5.0%
Cap rate
0.6%
Rent to Value Ratio

Active
$164,900
3
bds
|
2
ba
|
1,700
sqft
|
built
2024
7812 Scottwood Dr, New Orleans, LA 70128
$600
Cash flow
19.0%
Cash-on-Cash Return
10.0%
Cap rate
1.2%
Rent to Value Ratio

Active
$120,000
2
bds
|
1
ba
|
1,079
sqft
|
built
1991
4560 Laine Ave, New Orleans, LA 70126
$329
Cash flow
14.3%
Cash-on-Cash Return
9.0%
Cap rate
1.1%
Rent to Value Ratio

Active
$215,000
6
bds
|
0
ba
|
2,544
sqft
|
built
1970
4821 Francis Dr, New Orleans, LA 70126
$87
Cash flow
2.1%
Cash-on-Cash Return
6.2%
Cap rate
0.7%
Rent to Value Ratio
Active
$325,000
1
bds
|
1
ba
|
720
sqft
|
built
1924
1215 Louisiana Ave, New Orleans, LA 70115
$-296
Cash flow
-4.8%
Cash-on-Cash Return
4.6%
Cap rate
0.6%
Rent to Value Ratio

Active
$399,000
3
bds
|
3
ba
|
2,032
sqft
|
built
1941
4669 Baccich St, New Orleans, LA 70122
$-301
Cash flow
-3.9%
Cash-on-Cash Return
4.8%
Cap rate
0.6%
Rent to Value Ratio

Active
$395,000
2
bds
|
2
ba
|
1,326
sqft
|
built
1935
3314 Robert St, New Orleans, LA 70125
$-351
Cash flow
-4.6%
Cash-on-Cash Return
4.6%
Cap rate
0.6%
Rent to Value Ratio

Active
$999,000
8
bds
|
0
ba
|
5,034
sqft
|
built
1979
1429 Governor Nicholls St, New Orleans, LA 70116
$-3,969
Cash flow
-20.7%
Cash-on-Cash Return
0.9%
Cap rate
0.1%
Rent to Value Ratio
Active
$105,000
3
bds
|
1
ba
|
950
sqft
|
built
1986
6228 Warrington Dr, New Orleans, LA 70122
$883
Cash flow
43.9%
Cash-on-Cash Return
15.8%
Cap rate
1.9%
Rent to Value Ratio

Active
$575,000
4
bds
|
0
ba
|
2,157
sqft
|
built
2015
218 S Gayoso St, New Orleans, LA 70119
$-1,479
Cash flow
-13.4%
Cash-on-Cash Return
2.6%
Cap rate
0.3%
Rent to Value Ratio
Active
$1,700,000
4
bds
|
3
ba
|
4,595
sqft
|
built
1912
1631 State St, New Orleans, LA 70118
$-3,085
Cash flow
-9.5%
Cash-on-Cash Return
3.5%
Cap rate
0.4%
Rent to Value Ratio

Active
$447,000
2
bds
|
3
ba
|
1,257
sqft
|
built
1995
4000 Davey St, New Orleans, LA 70122
$-390
Cash flow
-4.6%
Cash-on-Cash Return
4.6%
Cap rate
0.6%
Rent to Value Ratio

Active
$229,000
1
bds
|
1
ba
|
758
sqft
|
built
1845
1614 Governor Nicholls St, New Orleans, LA 70116
$-325
Cash flow
-7.4%
Cash-on-Cash Return
4.0%
Cap rate
0.5%
Rent to Value Ratio

Active
$149,000
2
bds
|
2
ba
|
1,108
sqft
|
built
1934
1225 S Genois St, New Orleans, LA 70125
$537
Cash flow
18.8%
Cash-on-Cash Return
10.0%
Cap rate
1.2%
Rent to Value Ratio

Active
$360,000
4
bds
|
3
ba
|
2,800
sqft
|
built
1970
3931 S Post Oak Ave, New Orleans, LA 70131
$79
Cash flow
1.1%
Cash-on-Cash Return
5.9%
Cap rate
0.8%
Rent to Value Ratio
Active
$550,000
4
bds
|
3
ba
|
2,819
sqft
|
built
1925
2824 Calhoun St, New Orleans, LA 70118
$88
Cash flow
0.8%
Cash-on-Cash Return
5.9%
Cap rate
0.7%
Rent to Value Ratio

Active
$319,000
2
bds
|
2
ba
|
1,074
sqft
|
built
1927
525 S Telemachus St, New Orleans, LA 70119
$-130
Cash flow
-2.1%
Cash-on-Cash Return
5.2%
Cap rate
0.6%
Rent to Value Ratio

Active
$240,000
3
bds
|
2
ba
|
1,184
sqft
|
built
1942
2437 Jonquil St, New Orleans, LA 70122
$244
Cash flow
5.3%
Cash-on-Cash Return
6.9%
Cap rate
0.8%
Rent to Value Ratio

Active
$160,000
1
bds
|
1
ba
|
676
sqft
|
built
1973
500 Lake Marina Ave, New Orleans, LA 70124
$278
Cash flow
9.1%
Cash-on-Cash Return
7.8%
Cap rate
0.9%
Rent to Value Ratio
Active
$1,300,000
5
bds
|
3
ba
|
3,200
sqft
|
built
1852
1124 Barracks St, New Orleans, LA 70116
$-3,737
Cash flow
-15.0%
Cash-on-Cash Return
2.2%
Cap rate
0.3%
Rent to Value Ratio

Active
$535,000
3
bds
|
2
ba
|
2,059
sqft
|
built
2005
1750 Saint Charles Ave, New Orleans, LA 70130
$-117
Cash flow
-1.1%
Cash-on-Cash Return
5.4%
Cap rate
0.7%
Rent to Value Ratio

Active
$329,000
2
bds
|
1
ba
|
1,173
sqft
|
built
1960
6341 Milne Blvd, New Orleans, LA 70124
$-177
Cash flow
-2.8%
Cash-on-Cash Return
5.0%
Cap rate
0.6%
Rent to Value Ratio

Active
$325,000
2
bds
|
1
ba
|
838
sqft
|
built
1930
215 N Scott St, New Orleans, LA 70119
$-365
Cash flow
-5.9%
Cash-on-Cash Return
4.3%
Cap rate
0.5%
Rent to Value Ratio
Active
$225,000
1
bds
|
1
ba
|
617
sqft
|
built
1920
1201 Canal St, New Orleans, LA 70112
$177
Cash flow
4.1%
Cash-on-Cash Return
6.6%
Cap rate
0.8%
Rent to Value Ratio

Active
$190,000
3
bds
|
2
ba
|
1,178
sqft
|
built
1963
4811 Hickerson St, New Orleans, LA 70127
$205
Cash flow
5.6%
Cash-on-Cash Return
7.0%
Cap rate
0.8%
Rent to Value Ratio

Active
$518,000
4
bds
|
3
ba
|
2,109
sqft
|
built
2014
5617 Pratt Dr, New Orleans, LA 70122
$-243
Cash flow
-2.4%
Cash-on-Cash Return
5.1%
Cap rate
0.6%
Rent to Value Ratio

Active
$264,900
3
bds
|
2
ba
|
1,233
sqft
|
built
1930
2411 Republic St, New Orleans, LA 70119
$-150
Cash flow
-3.0%
Cash-on-Cash Return
5.0%
Cap rate
0.6%
Rent to Value Ratio

Active
$255,000
4
bds
|
0
ba
|
1,839
sqft
|
built
1995
3017 Music St, New Orleans, LA 70122
$-241
Cash flow
-4.9%
Cash-on-Cash Return
4.5%
Cap rate
0.5%
Rent to Value Ratio
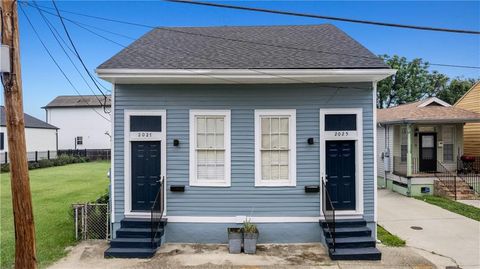
Active
$319,000
4
bds
|
0
ba
|
1,680
sqft
|
built
1913
2025 Conti St, New Orleans, LA 70112
$-406
Cash flow
-6.6%
Cash-on-Cash Return
4.2%
Cap rate
0.5%
Rent to Value Ratio
Active
$85,000
3
bds
|
2
ba
|
1,244
sqft
|
built
1959
1247 Foy St, New Orleans, LA 70122
$978
Cash flow
60.0%
Cash-on-Cash Return
19.5%
Cap rate
2.4%
Rent to Value Ratio

Active
$279,000
2
bds
|
2
ba
|
1,050
sqft
|
built
1930
3310 Delachaise St, New Orleans, LA 70125
$198
Cash flow
3.7%
Cash-on-Cash Return
6.5%
Cap rate
0.8%
Rent to Value Ratio
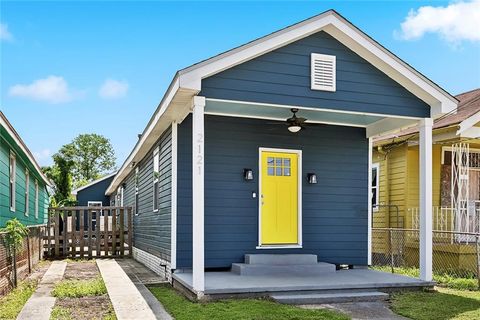
Active
$199,000
3
bds
|
2
ba
|
1,524
sqft
|
built
2021
2121 Piety St, New Orleans, LA 70117
$438
Cash flow
11.5%
Cash-on-Cash Return
8.3%
Cap rate
1.0%
Rent to Value Ratio

Active
$279,900
3
bds
|
2
ba
|
1,259
sqft
|
built
1943
934 Brooklyn St, New Orleans, LA 70114
$-359
Cash flow
-6.7%
Cash-on-Cash Return
4.1%
Cap rate
0.5%
Rent to Value Ratio

Active
$289,000
5
bds
|
2
ba
|
2,175
sqft
|
built
1955
1820 Bodenger Blvd, New Orleans, LA 70114
$12
Cash flow
0.2%
Cash-on-Cash Return
5.7%
Cap rate
0.7%
Rent to Value Ratio