Orleans Parish County Investment Properties for Sale
Browse homes for sale and investment properties in Orleans Parish County. Refine your search by price, property type, or more.
Best cash flowing properties in Orleans Parish County
Active
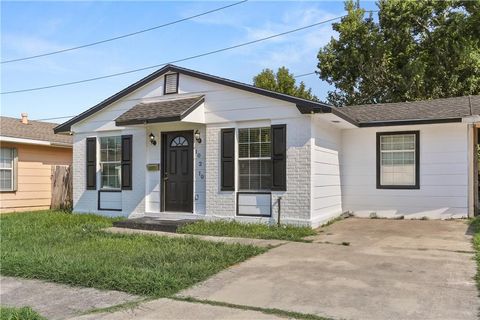
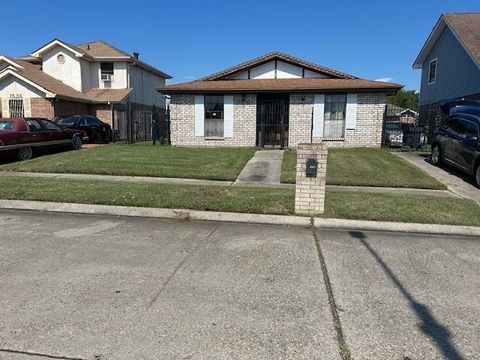
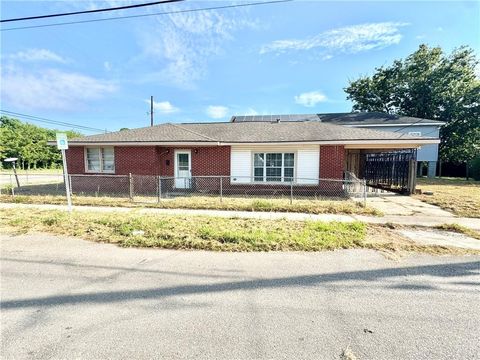
$134,000
4
bds
|
2
ba
|
1,300
sqft
|
built
1979
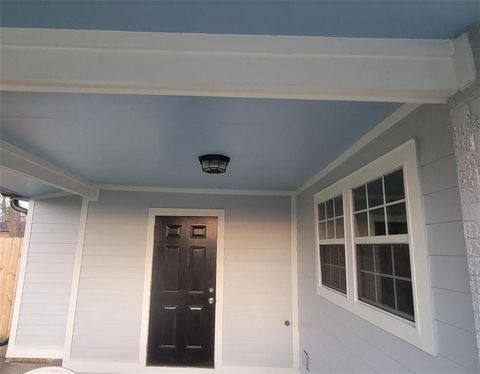
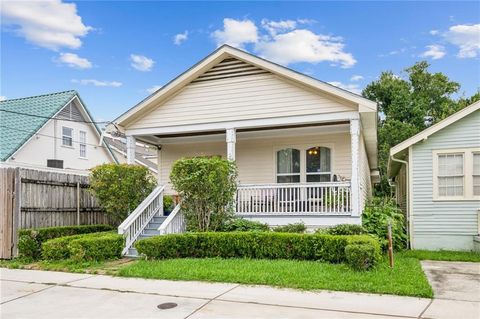
10210 Heritage Dr, New Orleans, LA 70127
$608
Cash flow
23.7%
Cash-on-Cash Return
11.1%
Cap rate
1.3%
Rent to Value Ratio
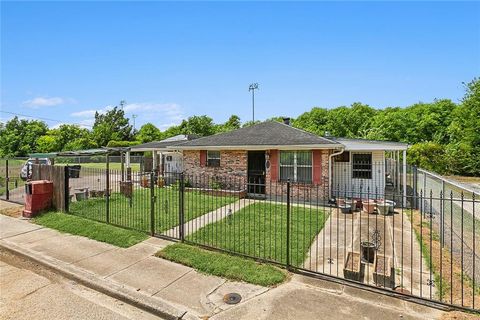
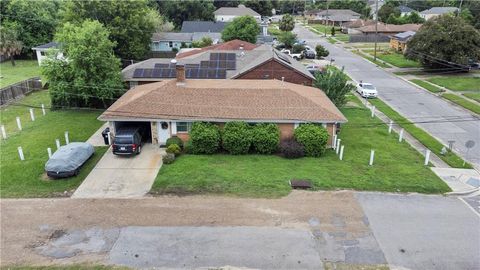
Active
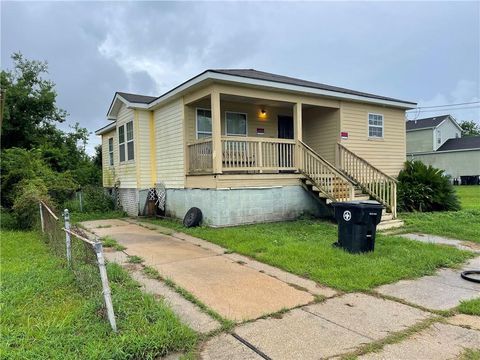
$164,900
3
bds
|
2
ba
|
1,975
sqft
|
built
1960
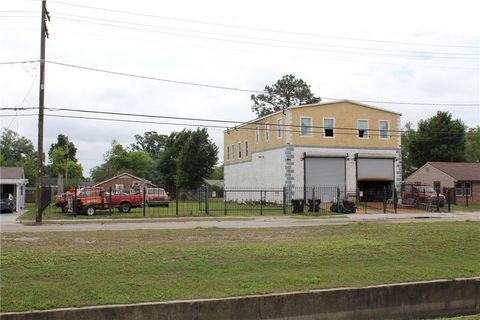
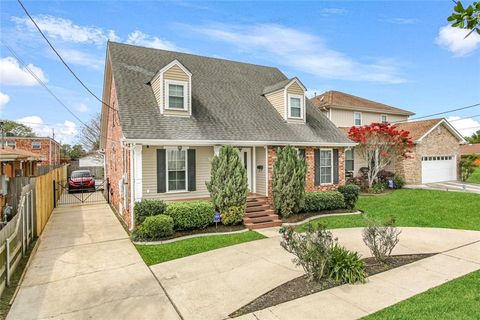
3812 Metropolitan St, New Orleans, LA 70126
$600
Cash flow
19.0%
Cash-on-Cash Return
10.0%
Cap rate
1.2%
Rent to Value Ratio
1,863 out of 1,870 properties for sale in Orleans Parish County
Limited Results Shown
Create a free account, or log in to reveal all property listings and enjoy the complete experience.
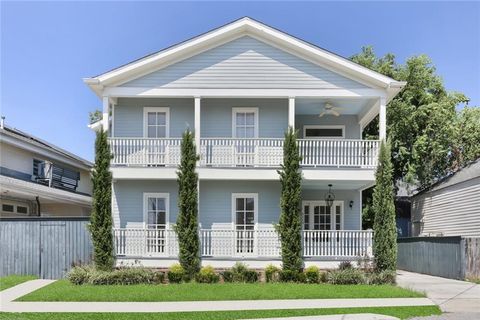
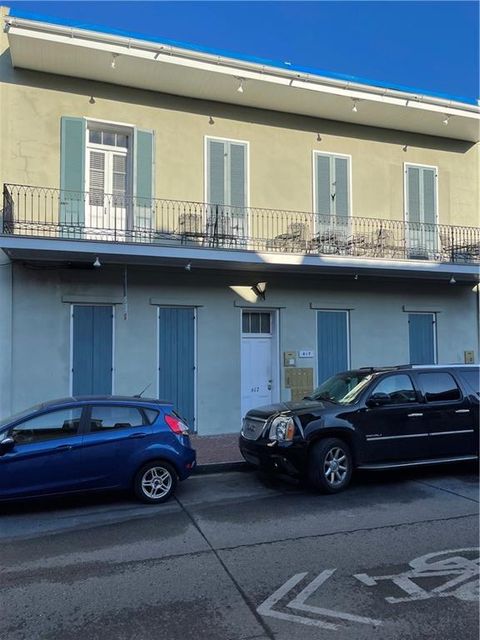
Active
$517,500
3
bds
|
3
ba
|
1,905
sqft
|
built
1920
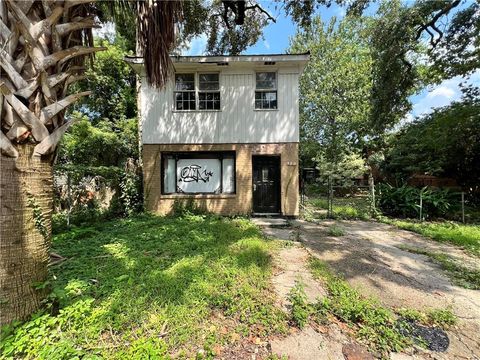
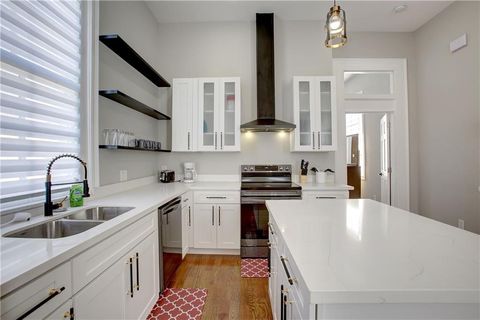
5113 Clara St, New Orleans, LA 70115
$-34
Cash flow
-0.3%
Cash-on-Cash Return
5.6%
Cap rate
0.7%
Rent to Value Ratio
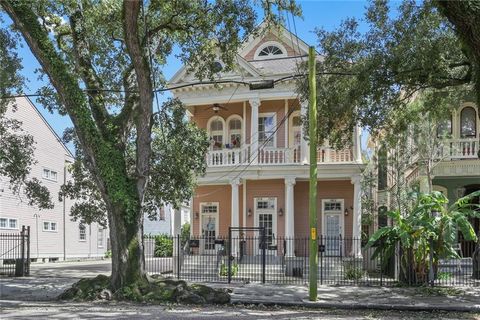
Active
$1,349,000
4
bds
|
5
ba
|
3,740
sqft
|
built
1947
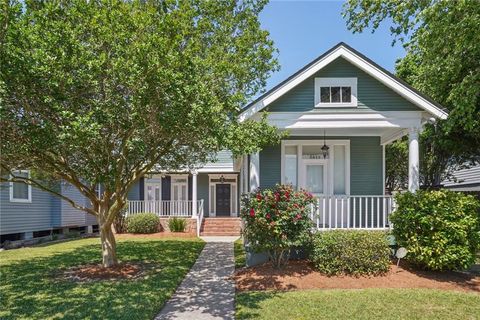
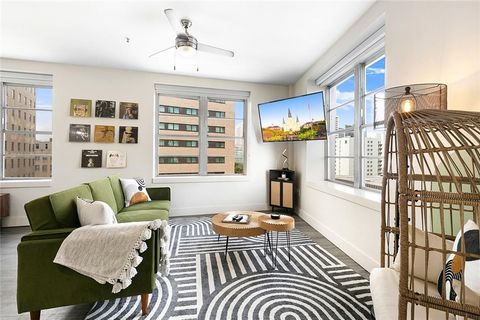
171 Audubon Blvd, New Orleans, LA 70118
$-1,554
Cash flow
-6.0%
Cash-on-Cash Return
4.3%
Cap rate
0.5%
Rent to Value Ratio
Active
$325,000
4
bds
|
2
ba
|
1,900
sqft
|
built
1950
4985 Feliciana Dr, New Orleans, LA 70126
$256
Cash flow
4.1%
Cash-on-Cash Return
6.6%
Cap rate
0.8%
Rent to Value Ratio
Active
$422,900
2
bds
|
3
ba
|
2,240
sqft
|
built
2012
6018 Morrison Rd, New Orleans, LA 70126
$-483
Cash flow
-6.0%
Cash-on-Cash Return
4.3%
Cap rate
0.5%
Rent to Value Ratio
Active
$129,000
1
bds
|
1
ba
|
1,200
sqft
|
built
1900
2535 Bienville St, New Orleans, LA 70119
$287
Cash flow
11.6%
Cash-on-Cash Return
8.3%
Cap rate
1.0%
Rent to Value Ratio
Active
$134,000
4
bds
|
2
ba
|
1,300
sqft
|
built
1979
10210 Heritage Dr, New Orleans, LA 70127
$608
Cash flow
23.7%
Cash-on-Cash Return
11.1%
Cap rate
1.3%
Rent to Value Ratio
Active
$575,000
4
bds
|
3
ba
|
2,608
sqft
|
built
1955
5822 Catina St, New Orleans, LA 70124
$-306
Cash flow
-2.8%
Cash-on-Cash Return
5.0%
Cap rate
0.6%
Rent to Value Ratio
Active
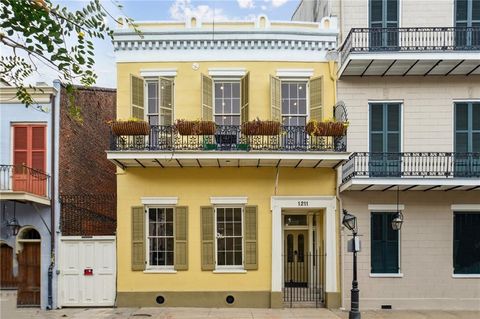
$2,495,000
6
bds
|
7
ba
|
5,640
sqft
|
built
1855
1211 Royal St, New Orleans, LA 70116
$-4,907
Cash flow
-10.3%
Cash-on-Cash Return
3.3%
Cap rate
0.4%
Rent to Value Ratio
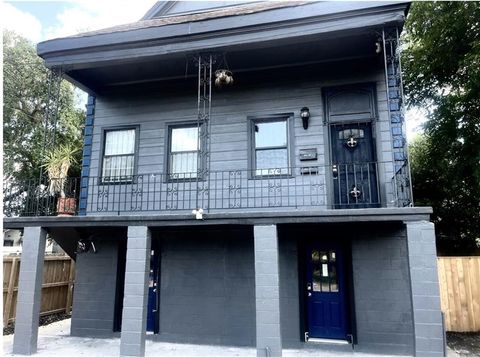
Active
$599,999
12
bds
|
0
ba
|
5,252
sqft
|
built
1960
2714 N Galvez St, New Orleans, LA 70117
$-1,321
Cash flow
-11.5%
Cash-on-Cash Return
3.0%
Cap rate
0.4%
Rent to Value Ratio
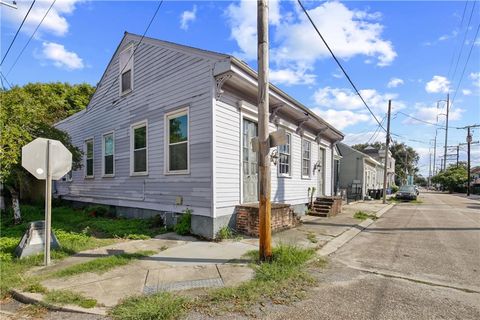
Active
$319,900
3
bds
|
2
ba
|
1,504
sqft
|
built
1940
803 7th St, New Orleans, LA 70115
$142
Cash flow
2.3%
Cash-on-Cash Return
6.2%
Cap rate
0.8%
Rent to Value Ratio
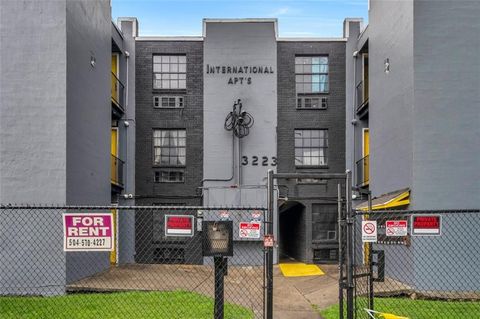
Active
$2,700,000
44
bds
|
0
ba
|
14,750
sqft
|
built
1960
3223 3rd St, New Orleans, LA 70125
$-11,535
Cash flow
-22.3%
Cash-on-Cash Return
0.6%
Cap rate
0.1%
Rent to Value Ratio
Active
$330,000
1
bds
|
2
ba
|
839
sqft
|
built
2019
900 Bartholomew St, New Orleans, LA 70117
$-182
Cash flow
-2.9%
Cash-on-Cash Return
5.0%
Cap rate
0.6%
Rent to Value Ratio

Active
$450,000
2
bds
|
2
ba
|
1,129
sqft
|
built
2019
900 Bartholomew St, New Orleans, LA 70117
$-198
Cash flow
-2.3%
Cash-on-Cash Return
5.2%
Cap rate
0.6%
Rent to Value Ratio

Active
$335,000
1
bds
|
2
ba
|
864
sqft
|
built
2019
900 Bartholomew St, New Orleans, LA 70117
$-67
Cash flow
-1.0%
Cash-on-Cash Return
5.4%
Cap rate
0.7%
Rent to Value Ratio
Active
$995,000
3
bds
|
4
ba
|
2,638
sqft
|
built
1848
1705 Burgundy St, New Orleans, LA 70116
$-2,018
Cash flow
-10.6%
Cash-on-Cash Return
3.2%
Cap rate
0.4%
Rent to Value Ratio
Active
$125,000
3
bds
|
2
ba
|
1,129
sqft
|
built
1975
4651 Lancelot Dr, New Orleans, LA 70127
$512
Cash flow
21.4%
Cash-on-Cash Return
10.6%
Cap rate
1.3%
Rent to Value Ratio
Active
$475,000
4
bds
|
2
ba
|
2,227
sqft
|
built
1940
2622 S Carrollton Ave, New Orleans, LA 70118
$-109
Cash flow
-1.2%
Cash-on-Cash Return
5.4%
Cap rate
0.7%
Rent to Value Ratio

Active
$575,000
1
bds
|
1
ba
|
947
sqft
|
built
2018
1001 Julia St, New Orleans, LA 70113
$-306
Cash flow
-2.8%
Cash-on-Cash Return
5.0%
Cap rate
0.6%
Rent to Value Ratio
Active
$129,999
3
bds
|
2
ba
|
1,920
sqft
|
built
1985
7853 Briarwood Dr, New Orleans, LA 70128
$489
Cash flow
19.6%
Cash-on-Cash Return
10.2%
Cap rate
1.2%
Rent to Value Ratio
Active
$171,000
3
bds
|
2
ba
|
1,580
sqft
|
built
1970
4800 Camelia St, New Orleans, LA 70126
$433
Cash flow
13.2%
Cash-on-Cash Return
8.7%
Cap rate
1.1%
Rent to Value Ratio
Active
$210,000
2
bds
|
1
ba
|
530
sqft
|
built
1921
617 Dauphine St, New Orleans, LA 70112
$248
Cash flow
6.2%
Cash-on-Cash Return
7.1%
Cap rate
0.9%
Rent to Value Ratio
Active
$239,600
1
bds
|
1
ba
|
599
sqft
|
built
1920
1916 Prytania St, New Orleans, LA 70130
$-30
Cash flow
-0.7%
Cash-on-Cash Return
5.5%
Cap rate
0.7%
Rent to Value Ratio
Active
$345,000
3
bds
|
2
ba
|
1,426
sqft
|
built
1933
3712 Calhoun St, New Orleans, LA 70125
$-46
Cash flow
-0.7%
Cash-on-Cash Return
5.5%
Cap rate
0.7%
Rent to Value Ratio
Active
$444,000
4
bds
|
3
ba
|
2,272
sqft
|
built
2006
6642 Avenue B, New Orleans, LA 70124
$38
Cash flow
0.4%
Cash-on-Cash Return
5.8%
Cap rate
0.7%
Rent to Value Ratio
Active
$227,900
2
bds
|
2
ba
|
1,075
sqft
|
built
1928
617 Tupelo St, New Orleans, LA 70117
$302
Cash flow
6.9%
Cash-on-Cash Return
7.3%
Cap rate
0.9%
Rent to Value Ratio

Active
$190,000
4
bds
|
2
ba
|
1,123
sqft
|
built
1955
5716 Wingate Dr, New Orleans, LA 70122
$343
Cash flow
9.4%
Cash-on-Cash Return
7.8%
Cap rate
0.9%
Rent to Value Ratio
Active
$549,000
2
bds
|
2
ba
|
1,265
sqft
|
built
1950
1111 Tulane Ave, New Orleans, LA 70112
$-390
Cash flow
-3.7%
Cash-on-Cash Return
4.8%
Cap rate
0.6%
Rent to Value Ratio
Active
$125,000
3
bds
|
1
ba
|
1,300
sqft
|
built
1992
1705 Tupelo St, New Orleans, LA 70117
$374
Cash flow
15.6%
Cash-on-Cash Return
9.3%
Cap rate
1.1%
Rent to Value Ratio
Active
$140,000
3
bds
|
1
ba
|
1,068
sqft
|
built
2007
4653 Dale St, New Orleans, LA 70126
$303
Cash flow
11.3%
Cash-on-Cash Return
8.3%
Cap rate
1.0%
Rent to Value Ratio
Active
$269,000
3
bds
|
3
ba
|
1,445
sqft
|
built
2019
917 Vallette St, New Orleans, LA 70114
$314
Cash flow
6.1%
Cash-on-Cash Return
7.1%
Cap rate
0.9%
Rent to Value Ratio
Active
$245,000
6
bds
|
0
ba
|
3,344
sqft
|
built
1978
7240 Bundy Rd, New Orleans, LA 70127
$83
Cash flow
1.8%
Cash-on-Cash Return
6.1%
Cap rate
0.7%
Rent to Value Ratio
Active
$278,900
1
bds
|
1
ba
|
593
sqft
|
built
1861
718 Barracks St, New Orleans, LA 70116
$-78
Cash flow
-1.5%
Cash-on-Cash Return
5.3%
Cap rate
0.6%
Rent to Value Ratio
Active
$269,000
3
bds
|
2
ba
|
1,790
sqft
|
built
1960
3306 Trafalgar St, New Orleans, LA 70119
$-169
Cash flow
-3.3%
Cash-on-Cash Return
4.9%
Cap rate
0.6%
Rent to Value Ratio
Active
$486,000
1
bds
|
1
ba
|
1,395
sqft
|
built
1923
528 Baronne St, New Orleans, LA 70113
$-368
Cash flow
-4.0%
Cash-on-Cash Return
4.8%
Cap rate
0.6%
Rent to Value Ratio

Active
$299,000
4
bds
|
2
ba
|
2,214
sqft
|
built
1975
5378 Chamberlain Dr, New Orleans, LA 70122
$103
Cash flow
1.8%
Cash-on-Cash Return
6.1%
Cap rate
0.7%
Rent to Value Ratio
Active
$164,900
3
bds
|
2
ba
|
1,975
sqft
|
built
1960
3812 Metropolitan St, New Orleans, LA 70126
$600
Cash flow
19.0%
Cash-on-Cash Return
10.0%
Cap rate
1.2%
Rent to Value Ratio
Active
$339,900
3
bds
|
2
ba
|
1,670
sqft
|
built
1923
2634 Saint Ann St, New Orleans, LA 70119
$392
Cash flow
6.0%
Cash-on-Cash Return
7.1%
Cap rate
0.9%
Rent to Value Ratio
Active
$749,000
5
bds
|
3
ba
|
3,700
sqft
|
built
1923
6831 W End Blvd, New Orleans, LA 70124
$-163
Cash flow
-1.1%
Cash-on-Cash Return
5.4%
Cap rate
0.7%
Rent to Value Ratio
Active
$229,000
1
bds
|
2
ba
|
934
sqft
|
built
2003
1919 Sophie Wright Pl, New Orleans, LA 70130
$296
Cash flow
6.7%
Cash-on-Cash Return
7.2%
Cap rate
0.9%
Rent to Value Ratio
Active
$147,500
2
bds
|
1
ba
|
1,140
sqft
|
built
1979
2546 Elder St, New Orleans, LA 70122
$406
Cash flow
14.4%
Cash-on-Cash Return
9.0%
Cap rate
1.1%
Rent to Value Ratio