Orleans Parish County Investment Properties for Sale
Browse homes for sale and investment properties in Orleans Parish County. Refine your search by price, property type, or more.
Best cash flowing properties in Orleans Parish County
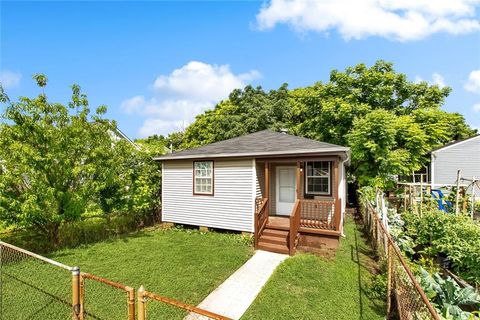
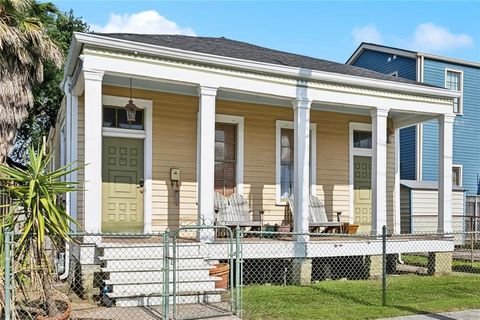
Active
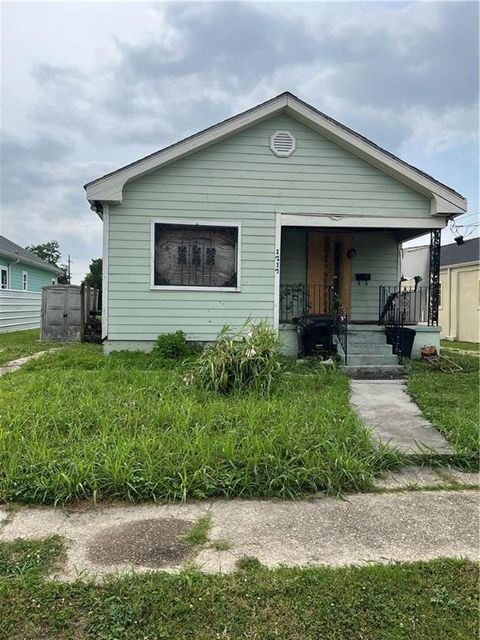
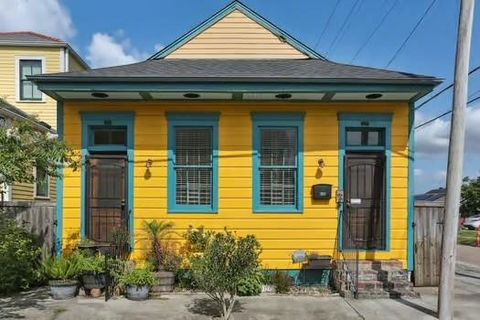
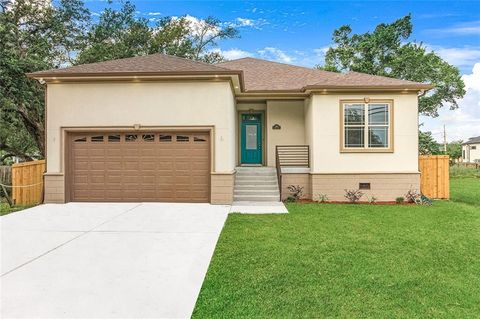
$50,000
2
bds
|
2
ba
|
1,428
sqft
|
built
1968
1717 Egania St, New Orleans, LA 70117
$966
Cash flow
22.5%
Cash-on-Cash Return
23.2%
Cap rate
2.8%
Rent to Value Ratio

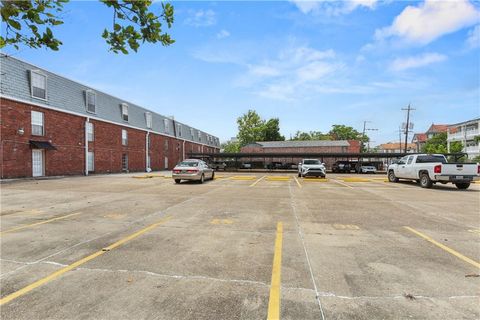
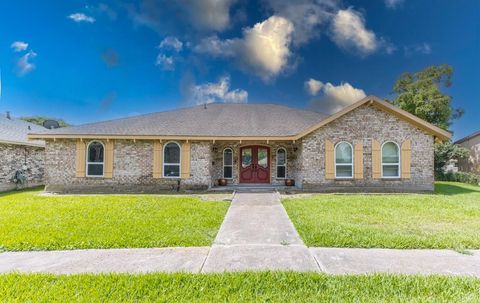
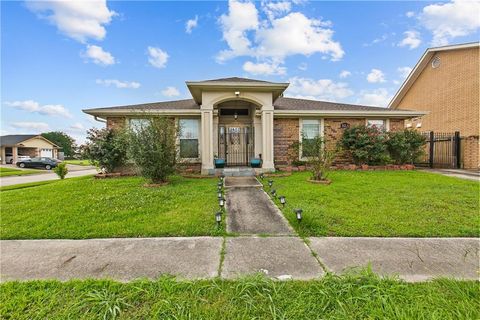
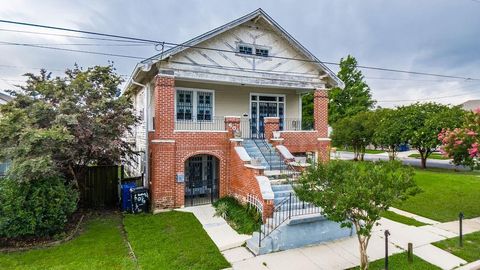
Active
$659,000
5
bds
|
5
ba
|
5,371
sqft
|
built
1995
6011 Eastover Dr, New Orleans, LA 70128
$952
Cash flow
7.5%
Cash-on-Cash Return
7.4%
Cap rate
0.9%
Rent to Value Ratio
1,089 out of 1,095 properties for sale in Orleans Parish County
Limited Results Shown
Create a free account, or log in to reveal all property listings and enjoy the complete experience.
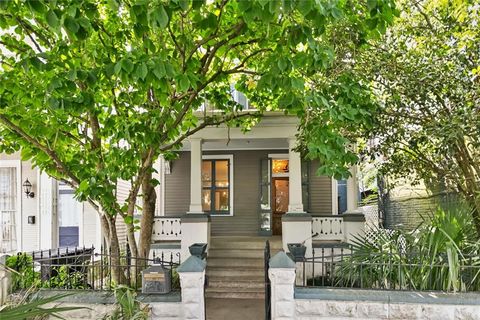
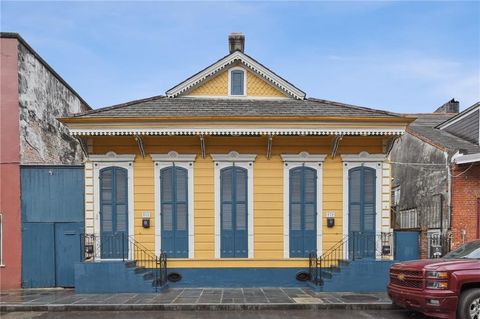
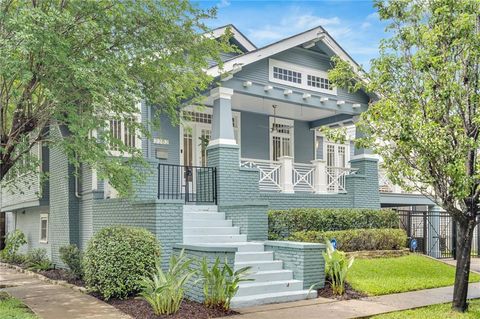
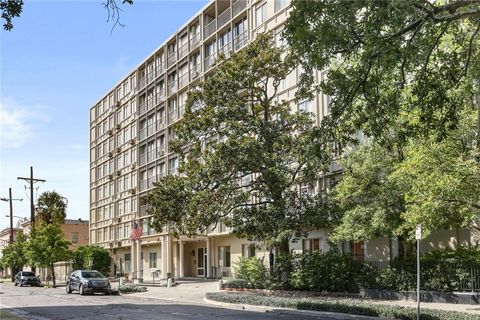
Active
$249,000
1
bds
|
1
ba
|
700
sqft
|
built
1973
3201 Saint Charles Ave, New Orleans, LA 70115
$-143
Cash flow
-3.0%
Cash-on-Cash Return
5.0%
Cap rate
0.6%
Rent to Value Ratio

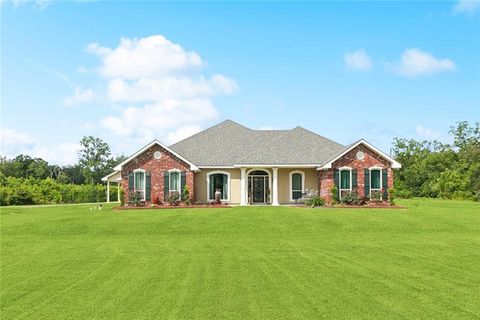
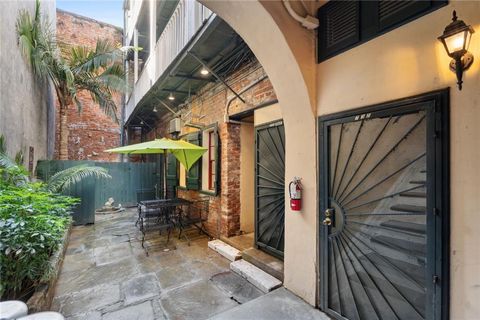
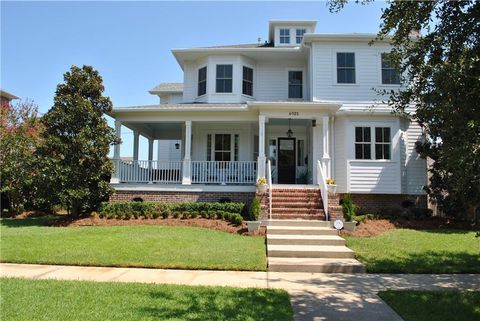
Active
$725,000
4
bds
|
4
ba
|
3,000
sqft
|
built
1996
6661 Colbert St, New Orleans, LA 70124
$-1,016
Cash flow
-7.3%
Cash-on-Cash Return
4.0%
Cap rate
0.5%
Rent to Value Ratio

Active
$560,000
2
bds
|
2
ba
|
2,062
sqft
|
built
1860
1260 Esplanade Ave, New Orleans, LA 70116
$-511
Cash flow
-4.8%
Cash-on-Cash Return
4.6%
Cap rate
0.6%
Rent to Value Ratio

Active
$450,000
6
bds
|
4
ba
|
3,522
sqft
|
built
1933
5524 S Galvez St, New Orleans, LA 70125
$-405
Cash flow
-4.7%
Cash-on-Cash Return
4.6%
Cap rate
0.6%
Rent to Value Ratio

Active
$224,500
2
bds
|
1
ba
|
949
sqft
|
built
1977
5124 Painters St, New Orleans, LA 70122
$318
Cash flow
7.4%
Cash-on-Cash Return
7.4%
Cap rate
0.9%
Rent to Value Ratio

Active
$617,500
3
bds
|
4
ba
|
2,633
sqft
|
built
1983
7300 Lakeshore Dr, New Orleans, LA 70124
$114
Cash flow
1.0%
Cash-on-Cash Return
5.9%
Cap rate
0.7%
Rent to Value Ratio
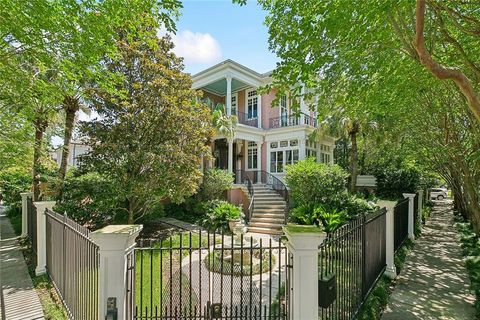
Active
$650,000
4
bds
|
4
ba
|
1,874
sqft
|
built
1910
1322 Prytania St, New Orleans, LA 70130
$-868
Cash flow
-7.0%
Cash-on-Cash Return
4.1%
Cap rate
0.5%
Rent to Value Ratio

Active
$165,000
4
bds
|
2.5
ba
|
2,346
sqft
|
built
1950
3500 Clematis St, New Orleans, LA 70122
$323
Cash flow
10.2%
Cash-on-Cash Return
8.0%
Cap rate
1.0%
Rent to Value Ratio
Active
$749,000
3
bds
|
2
ba
|
2,735
sqft
|
built
2000
11339 Willow Dr, New Orleans, LA 70131
$-1,612
Cash flow
-11.2%
Cash-on-Cash Return
3.1%
Cap rate
0.4%
Rent to Value Ratio
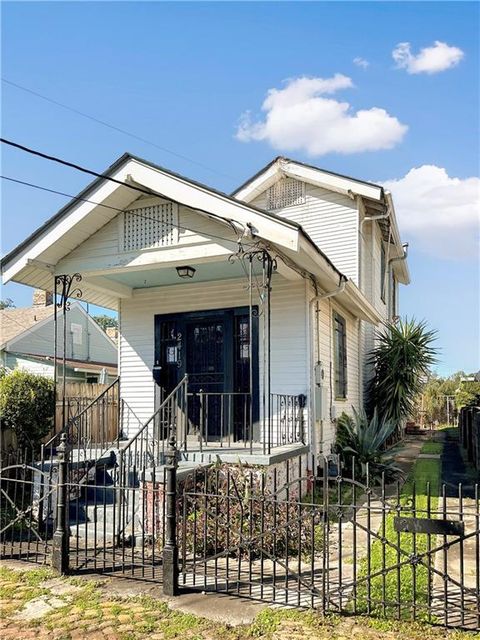
Active
$234,990
3
bds
|
2
ba
|
1,496
sqft
|
built
1916
640 Lizardi St, New Orleans, LA 70117
$-146
Cash flow
-3.2%
Cash-on-Cash Return
4.9%
Cap rate
0.6%
Rent to Value Ratio

Active
$245,000
4
bds
|
2
ba
|
1,634
sqft
|
built
1980
321 Diana St, New Orleans, LA 70114
$-193
Cash flow
-4.1%
Cash-on-Cash Return
4.7%
Cap rate
0.6%
Rent to Value Ratio
Active
$259,500
3
bds
|
3
ba
|
1,326
sqft
|
built
1920
2419 Chippewa St, New Orleans, LA 70130
$14
Cash flow
0.3%
Cash-on-Cash Return
5.7%
Cap rate
0.7%
Rent to Value Ratio

Active
$624,900
5
bds
|
4
ba
|
2,720
sqft
|
built
2019
637 S Dupre St, New Orleans, LA 70119
$-1,232
Cash flow
-10.3%
Cash-on-Cash Return
3.3%
Cap rate
0.4%
Rent to Value Ratio

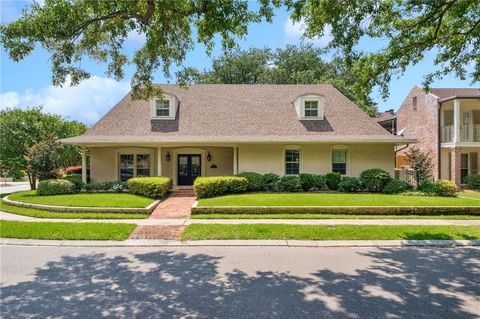
Active
$465,000
3
bds
|
2
ba
|
1,430
sqft
|
built
1955
6550 General Diaz St, New Orleans, LA 70124
$-200
Cash flow
-2.2%
Cash-on-Cash Return
5.2%
Cap rate
0.6%
Rent to Value Ratio

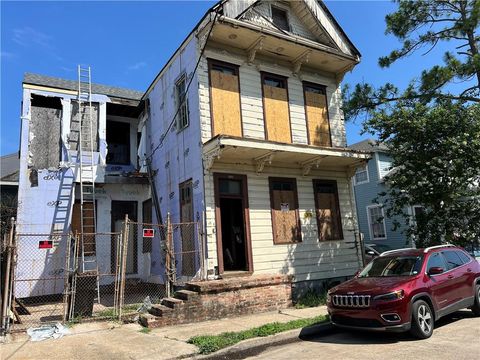
Active
$449,000
3
bds
|
3
ba
|
1,070
sqft
|
built
1867
1020 Esplanade Ave, New Orleans, LA 70116
$-745
Cash flow
-8.7%
Cash-on-Cash Return
3.7%
Cap rate
0.4%
Rent to Value Ratio

Active
$499,000
4
bds
|
3
ba
|
2,610
sqft
|
built
1941
7033 Wuerpel St, New Orleans, LA 70124
$123
Cash flow
1.3%
Cash-on-Cash Return
6.0%
Cap rate
0.7%
Rent to Value Ratio
Active
$1,850,000
5
bds
|
7
ba
|
3,378
sqft
|
built
2018
2538 N Rampart St, New Orleans, LA 70117
$-4,822
Cash flow
-13.6%
Cash-on-Cash Return
2.6%
Cap rate
0.3%
Rent to Value Ratio
Active
$330,000
3
bds
|
2
ba
|
1,200
sqft
|
built
1925
5621 Tchoupitoulas St, New Orleans, LA 70115
$-182
Cash flow
-2.9%
Cash-on-Cash Return
5.0%
Cap rate
0.6%
Rent to Value Ratio
Active
$399,000
4
bds
|
3
ba
|
2,380
sqft
|
built
2022
2931 Behrman Hwy, New Orleans, LA 70114
$113
Cash flow
1.5%
Cash-on-Cash Return
6.0%
Cap rate
0.7%
Rent to Value Ratio
Active
$345,000
4
bds
|
3
ba
|
2,692
sqft
|
built
1972
3701 Red Cypress Dr, New Orleans, LA 70131
$77
Cash flow
1.2%
Cash-on-Cash Return
5.9%
Cap rate
0.7%
Rent to Value Ratio
Active
$599,000
3
bds
|
3
ba
|
1,465
sqft
|
built
1885
820 Saint Ann St, New Orleans, LA 70116
$-1,041
Cash flow
-9.1%
Cash-on-Cash Return
3.6%
Cap rate
0.4%
Rent to Value Ratio
Active
$575,000
2
bds
|
1
ba
|
1,024
sqft
|
built
1872
732 Royal St, New Orleans, LA 70116
$-789
Cash flow
-7.2%
Cash-on-Cash Return
4.0%
Cap rate
0.5%
Rent to Value Ratio
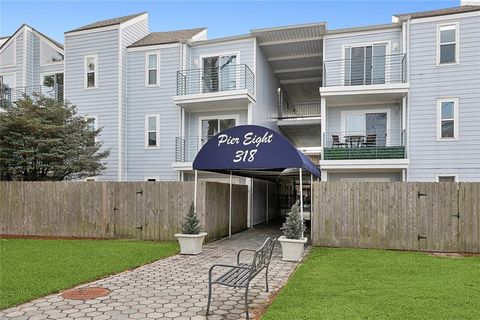
Active
$167,000
1
bds
|
2
ba
|
772
sqft
|
built
1982
318 Lake Marina Ave, New Orleans, LA 70124
$176
Cash flow
5.5%
Cash-on-Cash Return
6.9%
Cap rate
0.8%
Rent to Value Ratio
Active
$230,000
3
bds
|
3
ba
|
1,918
sqft
|
built
1921
815 N Robertson St, New Orleans, LA 70116
$85
Cash flow
1.9%
Cash-on-Cash Return
6.1%
Cap rate
0.7%
Rent to Value Ratio
Active
$2,165,000
5
bds
|
9
ba
|
5,575
sqft
|
built
1910
1633 Dufossat St, New Orleans, LA 70115
$-5,967
Cash flow
-14.4%
Cash-on-Cash Return
2.4%
Cap rate
0.3%
Rent to Value Ratio

Active
$430,000
4
bds
|
3
ba
|
2,132
sqft
|
built
1939
3316 Calhoun St, New Orleans, LA 70125
$173
Cash flow
2.1%
Cash-on-Cash Return
6.2%
Cap rate
0.7%
Rent to Value Ratio
Active
$825,000
4
bds
|
5
ba
|
3,974
sqft
|
built
1961
5542 Marcia Ave, New Orleans, LA 70124
$-78
Cash flow
-0.5%
Cash-on-Cash Return
5.6%
Cap rate
0.7%
Rent to Value Ratio

Active
$430,000
4
bds
|
2
ba
|
1,883
sqft
|
built
2008
1326 Prentiss Ave, New Orleans, LA 70122
$-310
Cash flow
-3.8%
Cash-on-Cash Return
4.8%
Cap rate
0.6%
Rent to Value Ratio
Active
$143,000
3
bds
|
2
ba
|
1,107
sqft
|
built
1965
811 Tricou St, New Orleans, LA 70117
$427
Cash flow
15.6%
Cash-on-Cash Return
9.3%
Cap rate
1.1%
Rent to Value Ratio
Active
$345,000
4
bds
|
3
ba
|
2,909
sqft
|
built
1980
11276 Fernley Dr, New Orleans, LA 70128
$161
Cash flow
2.4%
Cash-on-Cash Return
6.2%
Cap rate
0.8%
Rent to Value Ratio
Active
$947,000
5
bds
|
3
ba
|
3,280
sqft
|
built
1920
2202 Wirth Pl, New Orleans, LA 70115
$-686
Cash flow
-3.8%
Cash-on-Cash Return
4.8%
Cap rate
0.6%
Rent to Value Ratio
Active
$1,399,000
6
bds
|
4
ba
|
3,964
sqft
|
built
2010
6925 Canal Blvd, New Orleans, LA 70124
$-2,343
Cash flow
-8.7%
Cash-on-Cash Return
3.7%
Cap rate
0.4%
Rent to Value Ratio
Active
$299,000
3
bds
|
2
ba
|
2,541
sqft
|
built
1988
4231 San Trovaso St, New Orleans, LA 70129
$509
Cash flow
8.9%
Cash-on-Cash Return
7.7%
Cap rate
0.9%
Rent to Value Ratio
Active
$599,000
6
bds
|
3
ba
|
4,180
sqft
|
built
1920
606 Filmore Ave, New Orleans, LA 70124
$-1,455
Cash flow
-12.7%
Cash-on-Cash Return
2.8%
Cap rate
0.3%
Rent to Value Ratio
Active
$399,000
3
bds
|
2
ba
|
2,180
sqft
|
built
1880
719 Atlantic Ave, New Orleans, LA 70114
$-370
Cash flow
-4.8%
Cash-on-Cash Return
4.6%
Cap rate
0.6%
Rent to Value Ratio

Active
$185,000
3
bds
|
1
ba
|
1,244
sqft
|
built
1950
2622 Wisteria St, New Orleans, LA 70122
$229
Cash flow
6.5%
Cash-on-Cash Return
7.2%
Cap rate
0.9%
Rent to Value Ratio

Active
$85,000
4
bds
|
2
ba
|
1,175
sqft
|
built
1966
2943 Lancaster St, New Orleans, LA 70131
$702
Cash flow
43.1%
Cash-on-Cash Return
15.6%
Cap rate
1.9%
Rent to Value Ratio
Active
$350,000
2
bds
|
2
ba
|
1,134
sqft
|
built
1948
1550 2nd St, New Orleans, LA 70130
$276
Cash flow
4.1%
Cash-on-Cash Return
6.6%
Cap rate
0.8%
Rent to Value Ratio