Orleans Parish County Investment Properties for Sale
Browse homes for sale and investment properties in Orleans Parish County. Refine your search by price, property type, or more.
Best cash flowing properties in Orleans Parish County

Active
$895,000
4
bds
|
4
ba
|
3,708
sqft
|
built
1953
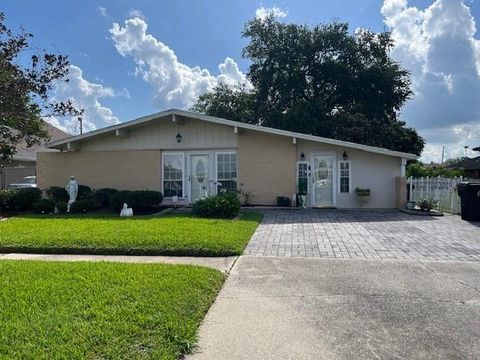
1141 Allen Toussaint Blvd, New Orleans, LA 70124
$1,078
Cash flow
6.3%
Cash-on-Cash Return
7.1%
Cap rate
0.9%
Rent to Value Ratio
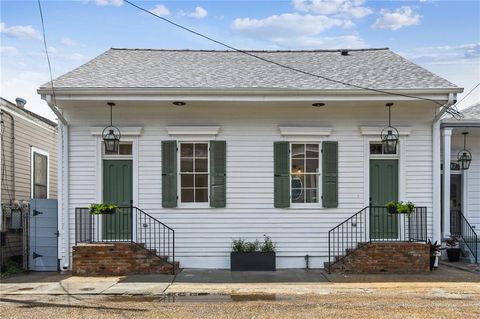
Active
$625,000
4
bds
|
4
ba
|
2,306
sqft
|
built
1930
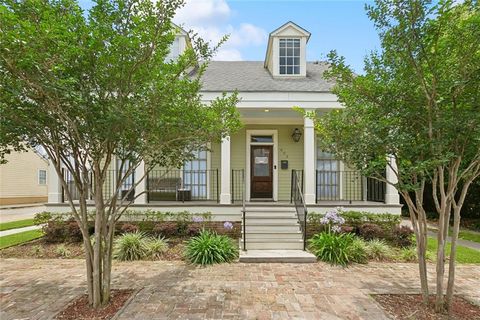
8239 Green St, New Orleans, LA 70118
$906
Cash flow
7.6%
Cash-on-Cash Return
7.4%
Cap rate
0.9%
Rent to Value Ratio
1,089 out of 1,095 properties for sale in Orleans Parish County
Limited Results Shown
Create a free account, or log in to reveal all property listings and enjoy the complete experience.

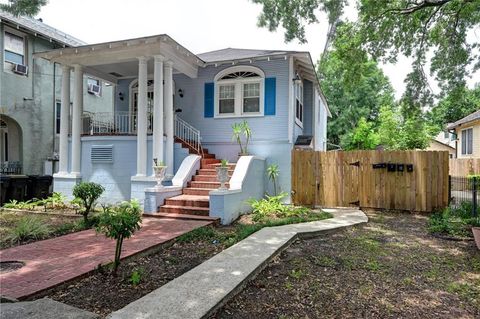
Active
$279,900
1
bds
|
1
ba
|
596
sqft
|
built
1920
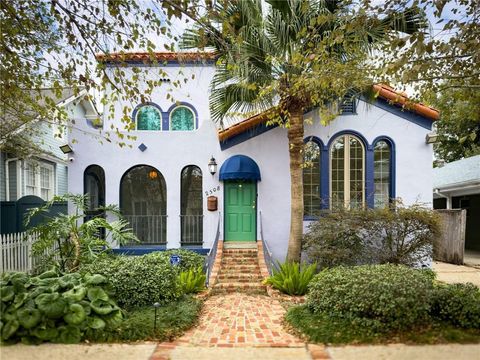
1422 Dauphine St, New Orleans, LA 70116
$-221
Cash flow
-4.1%
Cash-on-Cash Return
4.7%
Cap rate
0.6%
Rent to Value Ratio

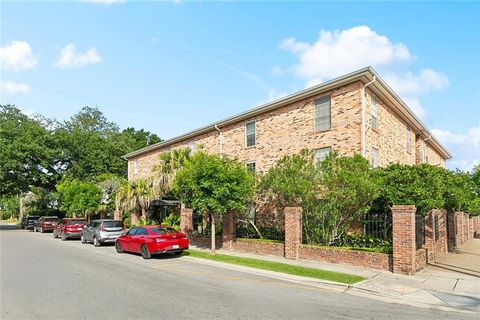
Active
$950,000
3
bds
|
3
ba
|
1,914
sqft
|
built
1910
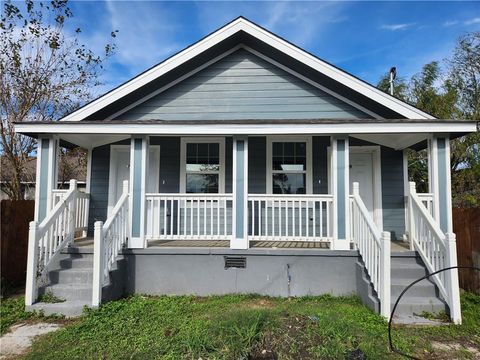
1311 Bourbon St, New Orleans, LA 70116
$-1,805
Cash flow
-9.9%
Cash-on-Cash Return
3.4%
Cap rate
0.4%
Rent to Value Ratio

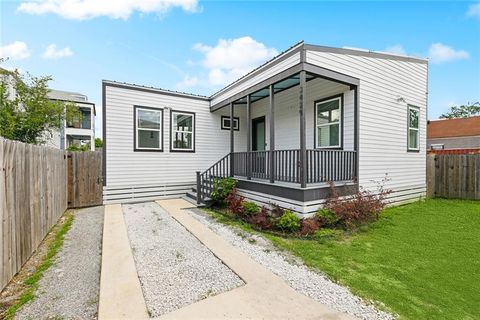
Active
$275,000
3
bds
|
2
ba
|
1,200
sqft
|
built
1960
1479 Filmore Ave, New Orleans, LA 70122
$-59
Cash flow
-1.1%
Cash-on-Cash Return
5.4%
Cap rate
0.7%
Rent to Value Ratio

Active
$349,000
5
bds
|
4
ba
|
2,794
sqft
|
built
1960
1919 Stephen Girard St, New Orleans, LA 70122
$349
Cash flow
5.2%
Cash-on-Cash Return
6.9%
Cap rate
0.8%
Rent to Value Ratio
Active
$449,000
3
bds
|
3
ba
|
2,140
sqft
|
built
1984
2627 S Carrollton Ave, New Orleans, LA 70118
$-124
Cash flow
-1.4%
Cash-on-Cash Return
5.3%
Cap rate
0.6%
Rent to Value Ratio
Active
$679,000
3
bds
|
3
ba
|
1,927
sqft
|
built
1900
2417 Rousseau St, New Orleans, LA 70130
$-798
Cash flow
-6.1%
Cash-on-Cash Return
4.3%
Cap rate
0.5%
Rent to Value Ratio
Active
$1,150,000
4
bds
|
3
ba
|
2,838
sqft
|
built
1920
5936 Chestnut St, New Orleans, LA 70115
$-1,026
Cash flow
-4.7%
Cash-on-Cash Return
4.6%
Cap rate
0.6%
Rent to Value Ratio

Active
$285,000
4
bds
|
3
ba
|
3,681
sqft
|
built
1960
5936 Dover Pl, New Orleans, LA 70131
$790
Cash flow
14.5%
Cash-on-Cash Return
9.0%
Cap rate
1.1%
Rent to Value Ratio
Active
$675,000
3
bds
|
3
ba
|
1,965
sqft
|
built
1900
2421 Rousseau St, New Orleans, LA 70130
$-779
Cash flow
-6.0%
Cash-on-Cash Return
4.3%
Cap rate
0.5%
Rent to Value Ratio

Active
$678,000
6
bds
|
5
ba
|
2,730
sqft
|
built
1921
3508 Cleveland Ave, New Orleans, LA 70119
$-2,174
Cash flow
-16.7%
Cash-on-Cash Return
1.8%
Cap rate
0.2%
Rent to Value Ratio

Active
$325,000
5
bds
|
3
ba
|
2,480
sqft
|
built
1960
3218 Gentilly Blvd, New Orleans, LA 70122
$-296
Cash flow
-4.8%
Cash-on-Cash Return
4.6%
Cap rate
0.6%
Rent to Value Ratio

Active
$469,900
3
bds
|
3
ba
|
2,548
sqft
|
built
1960
6557 W End Blvd, New Orleans, LA 70124
$-16
Cash flow
-0.2%
Cash-on-Cash Return
5.6%
Cap rate
0.7%
Rent to Value Ratio
Active
$599,000
7
bds
|
5
ba
|
2,918
sqft
|
built
1920
305 City Park Ave, New Orleans, LA 70119
$-2,076
Cash flow
-18.1%
Cash-on-Cash Return
1.5%
Cap rate
0.2%
Rent to Value Ratio
Active
$215,000
1
bds
|
1
ba
|
600
sqft
|
built
1985
732 Cherokee St, New Orleans, LA 70118
$18
Cash flow
0.4%
Cash-on-Cash Return
5.8%
Cap rate
0.7%
Rent to Value Ratio

Active
$299,000
3
bds
|
2
ba
|
1,349
sqft
|
built
1960
3114 Audubon St, New Orleans, LA 70125
$-242
Cash flow
-4.2%
Cash-on-Cash Return
4.7%
Cap rate
0.6%
Rent to Value Ratio
Active
$299,000
2
bds
|
2
ba
|
1,188
sqft
|
built
2022
3429 Willow St, New Orleans, LA 70115
$310
Cash flow
5.4%
Cash-on-Cash Return
6.9%
Cap rate
0.8%
Rent to Value Ratio

Active
$194,900
1
bds
|
1
ba
|
551
sqft
|
built
1920
1323 Dauphine St, New Orleans, LA 70116
$182
Cash flow
4.9%
Cash-on-Cash Return
6.8%
Cap rate
0.8%
Rent to Value Ratio

Active
$445,000
3
bds
|
2
ba
|
1,786
sqft
|
built
1922
1355 Columbus St, New Orleans, LA 70116
$-588
Cash flow
-6.9%
Cash-on-Cash Return
4.1%
Cap rate
0.5%
Rent to Value Ratio
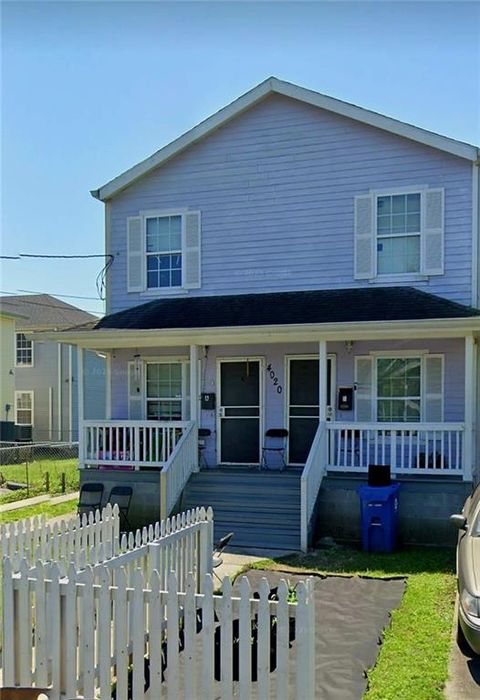
Active
$313,000
10
bds
|
0
ba
|
2,544
sqft
|
built
2009
4020 N Claiborne Ave, New Orleans, LA 70117
$-377
Cash flow
-6.3%
Cash-on-Cash Return
4.2%
Cap rate
0.5%
Rent to Value Ratio
Active
$148,000
2
bds
|
2
ba
|
1,600
sqft
|
built
1948
3704 Cherry St, New Orleans, LA 70118
$266
Cash flow
9.4%
Cash-on-Cash Return
7.8%
Cap rate
0.9%
Rent to Value Ratio
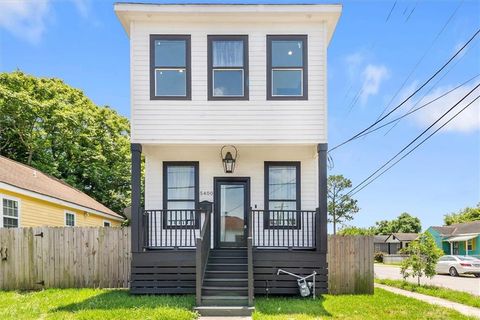
Active
$225,000
4
bds
|
3
ba
|
1,446
sqft
|
built
2022
5400 N Rampart St, New Orleans, LA 70117
$315
Cash flow
7.3%
Cash-on-Cash Return
7.4%
Cap rate
0.9%
Rent to Value Ratio

Active
$275,000
3
bds
|
2
ba
|
1,262
sqft
|
built
2018
1319 Granada Dr, New Orleans, LA 70122
$286
Cash flow
5.4%
Cash-on-Cash Return
6.9%
Cap rate
0.8%
Rent to Value Ratio

Active
$825,000
4
bds
|
5
ba
|
4,015
sqft
|
built
1980
5537 Cherlyn Dr, New Orleans, LA 70124
$-385
Cash flow
-2.4%
Cash-on-Cash Return
5.1%
Cap rate
0.6%
Rent to Value Ratio

Active
$479,000
4
bds
|
3
ba
|
2,904
sqft
|
built
1951
6409 Louis Xiv St, New Orleans, LA 70124
$148
Cash flow
1.6%
Cash-on-Cash Return
6.1%
Cap rate
0.7%
Rent to Value Ratio

Active
$599,000
4
bds
|
4
ba
|
3,800
sqft
|
built
2007
439 S Clark St, New Orleans, LA 70119
$-420
Cash flow
-3.7%
Cash-on-Cash Return
4.8%
Cap rate
0.6%
Rent to Value Ratio

Active
$287,000
2
bds
|
2
ba
|
1,160
sqft
|
built
1860
1509 N Derbigny St, New Orleans, LA 70116
$-185
Cash flow
-3.4%
Cash-on-Cash Return
4.9%
Cap rate
0.6%
Rent to Value Ratio

Active
$285,000
3
bds
|
2
ba
|
1,648
sqft
|
built
1913
1560 N Tonti St, New Orleans, LA 70119
$169
Cash flow
3.1%
Cash-on-Cash Return
6.4%
Cap rate
0.8%
Rent to Value Ratio
Active
$399,000
2
bds
|
2
ba
|
1,508
sqft
|
built
1927
2609 General Pershing St, New Orleans, LA 70115
$-163
Cash flow
-2.1%
Cash-on-Cash Return
5.2%
Cap rate
0.6%
Rent to Value Ratio
Active
$199,000
3
bds
|
2
ba
|
1,518
sqft
|
built
1950
5917 Campus Blvd, New Orleans, LA 70126
$300
Cash flow
7.9%
Cash-on-Cash Return
7.5%
Cap rate
0.9%
Rent to Value Ratio
Active
$715,000
3
bds
|
4
ba
|
2,114
sqft
|
built
2016
602 8th St, New Orleans, LA 70115
$-624
Cash flow
-4.6%
Cash-on-Cash Return
4.6%
Cap rate
0.6%
Rent to Value Ratio

Active
$209,000
5
bds
|
2
ba
|
1,603
sqft
|
built
2015
4900 America St, New Orleans, LA 70126
$529
Cash flow
13.2%
Cash-on-Cash Return
8.7%
Cap rate
1.1%
Rent to Value Ratio

Active
$310,000
3
bds
|
2
ba
|
1,768
sqft
|
built
1977
309 Diana St, New Orleans, LA 70114
$-501
Cash flow
-8.4%
Cash-on-Cash Return
3.7%
Cap rate
0.5%
Rent to Value Ratio
Active
$775,000
3
bds
|
3
ba
|
2,640
sqft
|
built
1924
2508 Joseph St, New Orleans, LA 70115
$-287
Cash flow
-1.9%
Cash-on-Cash Return
5.2%
Cap rate
0.6%
Rent to Value Ratio

Active
$195,000
2
bds
|
1
ba
|
822
sqft
|
built
1924
4409 Annette St, New Orleans, LA 70122
$181
Cash flow
4.8%
Cash-on-Cash Return
6.8%
Cap rate
0.8%
Rent to Value Ratio

Active
$225,000
4
bds
|
3
ba
|
2,920
sqft
|
built
1985
3500 Silver Maple Ct, New Orleans, LA 70131
$852
Cash flow
19.8%
Cash-on-Cash Return
10.2%
Cap rate
1.2%
Rent to Value Ratio
Active
$220,000
4
bds
|
0
ba
|
1,320
sqft
|
built
1971
3107 Industrial Ct, New Orleans, LA 70117
$201
Cash flow
4.8%
Cash-on-Cash Return
6.8%
Cap rate
0.8%
Rent to Value Ratio

Active
$390,000
3
bds
|
3
ba
|
1,627
sqft
|
built
1985
4321 San Remo Rd, New Orleans, LA 70129
$-264
Cash flow
-3.5%
Cash-on-Cash Return
4.9%
Cap rate
0.6%
Rent to Value Ratio
Active
$525,000
3
bds
|
3
ba
|
2,904
sqft
|
built
1923
2134 Harmony St, New Orleans, LA 70115
$-345
Cash flow
-3.4%
Cash-on-Cash Return
4.9%
Cap rate
0.6%
Rent to Value Ratio