Orleans Parish County Investment Properties for Sale
Browse homes for sale and investment properties in Orleans Parish County. Refine your search by price, property type, or more.
Best cash flowing properties in Orleans Parish County

Active
$40,000
4
bds
|
2
ba
|
1,640
sqft
|
built
1977
16 Petit Bayou Ln, New Orleans, LA 70129
$1,242
Cash flow
36.2%
Cash-on-Cash Return
37.3%
Cap rate
4.5%
Rent to Value Ratio

Active
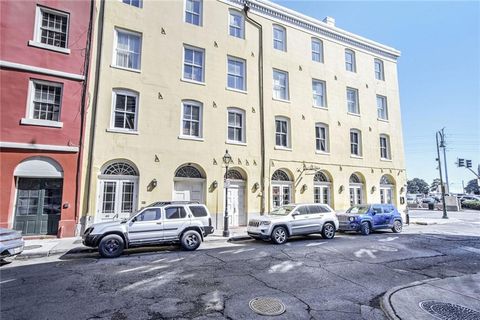
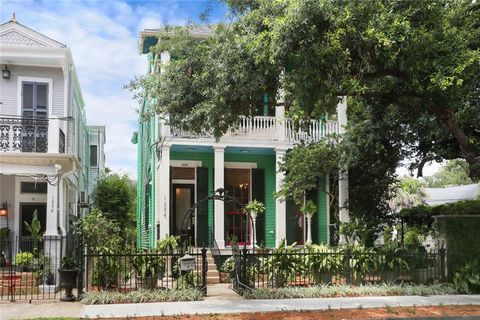
$895,000
3
bds
|
3
ba
|
2,855
sqft
|
built
1917
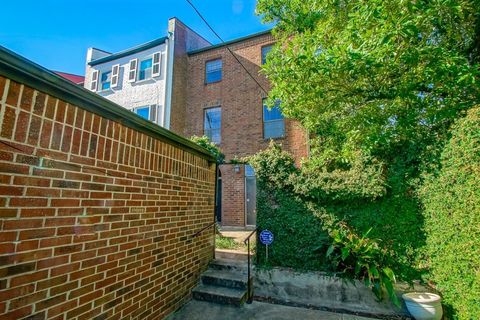
801 Saint Joseph St, New Orleans, LA 70113
$1,216
Cash flow
7.1%
Cash-on-Cash Return
7.3%
Cap rate
0.9%
Rent to Value Ratio
1,089 out of 1,095 properties for sale in Orleans Parish County
Limited Results Shown
Create a free account, or log in to reveal all property listings and enjoy the complete experience.
Active
$440,000
4
bds
|
3
ba
|
2,565
sqft
|
built
1978
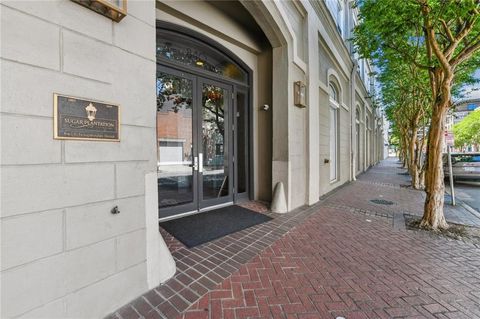
1032 7th St, New Orleans, LA 70115
$195
Cash flow
2.3%
Cash-on-Cash Return
6.2%
Cap rate
0.8%
Rent to Value Ratio

Active
$245,000
2
bds
|
2
ba
|
1,172
sqft
|
built
1916
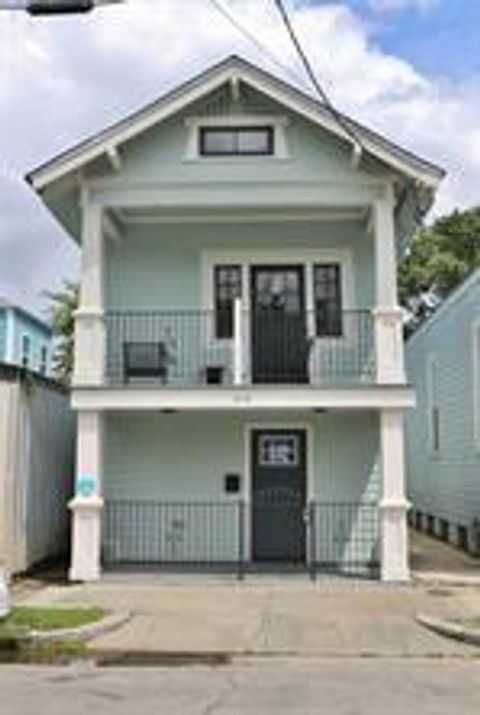
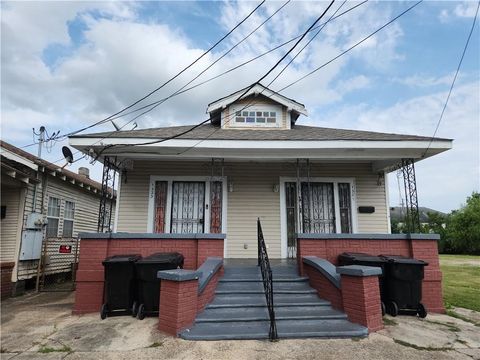
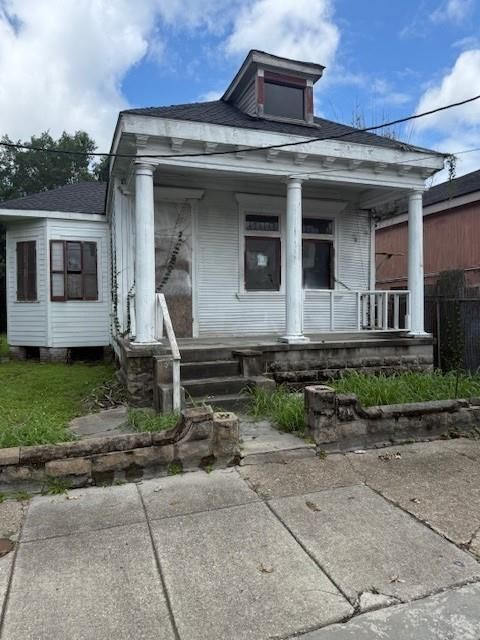
2713 2nd St, New Orleans, LA 70113
$-55
Cash flow
-1.2%
Cash-on-Cash Return
5.4%
Cap rate
0.7%
Rent to Value Ratio

Active
$409,000
3
bds
|
2
ba
|
1,785
sqft
|
built
2009
227 20th St, New Orleans, LA 70124
$-211
Cash flow
-2.7%
Cash-on-Cash Return
5.1%
Cap rate
0.6%
Rent to Value Ratio

Active
$264,999
4
bds
|
3
ba
|
2,208
sqft
|
built
1970
8455 Huntington Park Dr, New Orleans, LA 70127
$126
Cash flow
2.5%
Cash-on-Cash Return
6.2%
Cap rate
0.8%
Rent to Value Ratio

Active
$479,900
4
bds
|
2
ba
|
2,033
sqft
|
built
2012
6708 Fleur De Lis Dr, New Orleans, LA 70124
$-339
Cash flow
-3.7%
Cash-on-Cash Return
4.8%
Cap rate
0.6%
Rent to Value Ratio

Active
$275,000
3
bds
|
3
ba
|
1,650
sqft
|
built
1970
408 22nd St, New Orleans, LA 70124
$217
Cash flow
4.1%
Cash-on-Cash Return
6.6%
Cap rate
0.8%
Rent to Value Ratio
Active
$389,000
4
bds
|
3
ba
|
2,010
sqft
|
built
1928
324 N Roman St, New Orleans, LA 70112
$91
Cash flow
1.2%
Cash-on-Cash Return
6.0%
Cap rate
0.7%
Rent to Value Ratio
Active
$435,000
2
bds
|
2
ba
|
1,085
sqft
|
built
1974
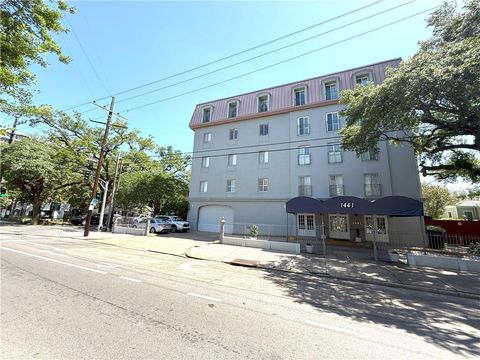
1441 Jackson Ave, New Orleans, LA 70130
$-472
Cash flow
-5.7%
Cash-on-Cash Return
4.4%
Cap rate
0.5%
Rent to Value Ratio
Active
$178,000
2
bds
|
1
ba
|
608
sqft
|
built
1964
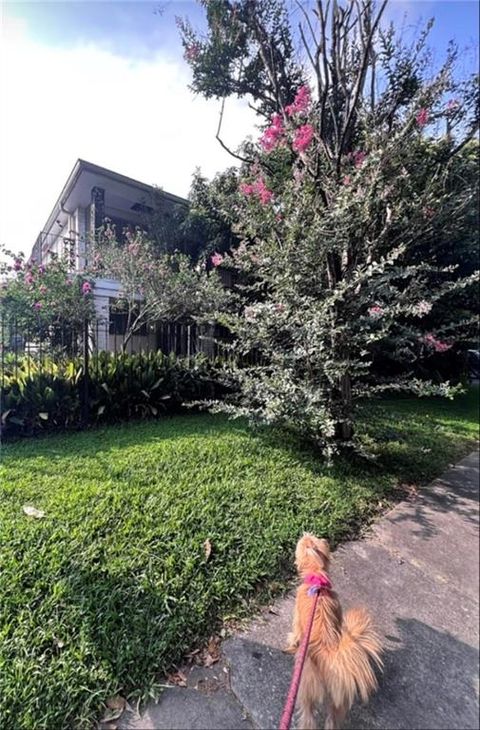
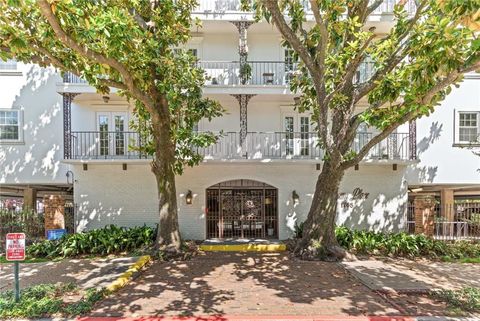
1921 Prytania St, New Orleans, LA 70130
$55
Cash flow
1.6%
Cash-on-Cash Return
6.0%
Cap rate
0.7%
Rent to Value Ratio
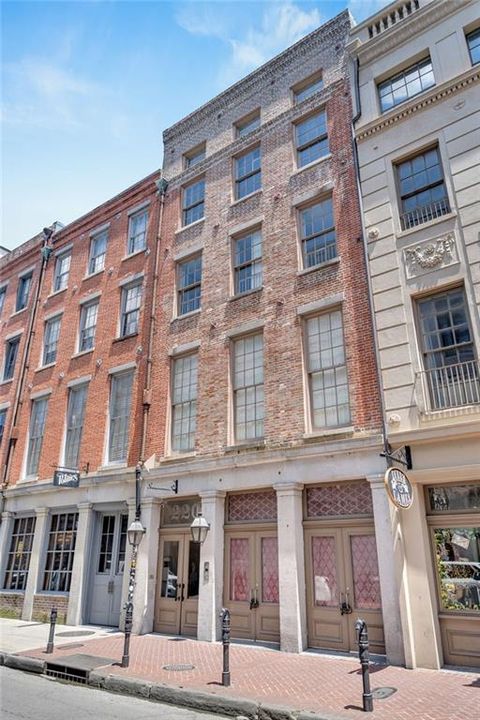
Active
$445,000
2
bds
|
2
ba
|
1,197
sqft
|
built
1870
220 Decatur St, New Orleans, LA 70130
$102
Cash flow
1.2%
Cash-on-Cash Return
6.0%
Cap rate
0.7%
Rent to Value Ratio
Active
$675,000
4
bds
|
2
ba
|
1,920
sqft
|
built
1925
115 N Scott St, New Orleans, LA 70119
$-1,055
Cash flow
-8.2%
Cash-on-Cash Return
3.8%
Cap rate
0.5%
Rent to Value Ratio
Active
$364,900
4
bds
|
0
ba
|
1,675
sqft
|
built
1932
905 Pelican Ave, New Orleans, LA 70114
$-623
Cash flow
-8.9%
Cash-on-Cash Return
3.6%
Cap rate
0.4%
Rent to Value Ratio

Active
$159,900
4
bds
|
2
ba
|
2,810
sqft
|
built
1977
6916 Lake Willow Dr, New Orleans, LA 70126
$761
Cash flow
24.8%
Cash-on-Cash Return
11.4%
Cap rate
1.4%
Rent to Value Ratio

Active
$565,000
4
bds
|
6
ba
|
5,243
sqft
|
built
1974
6755 Lake Willow Dr, New Orleans, LA 70126
$-220
Cash flow
-2.0%
Cash-on-Cash Return
5.2%
Cap rate
0.6%
Rent to Value Ratio

Active
$499,000
3
bds
|
2
ba
|
2,575
sqft
|
built
1951
5878 General Diaz St, New Orleans, LA 70124
$-153
Cash flow
-1.6%
Cash-on-Cash Return
5.3%
Cap rate
0.6%
Rent to Value Ratio

Active
$445,000
2
bds
|
2
ba
|
1,144
sqft
|
built
1890
220 Decatur St, New Orleans, LA 70130
$33
Cash flow
0.4%
Cash-on-Cash Return
5.8%
Cap rate
0.7%
Rent to Value Ratio

Active
$610,000
3
bds
|
3
ba
|
2,200
sqft
|
built
1971
6951 Memphis St, New Orleans, LA 70124
$-127
Cash flow
-1.1%
Cash-on-Cash Return
5.4%
Cap rate
0.7%
Rent to Value Ratio
Active
$330,000
2
bds
|
2
ba
|
934
sqft
|
built
2007
450 John Churchill Chase St, New Orleans, LA 70130
$163
Cash flow
2.6%
Cash-on-Cash Return
6.3%
Cap rate
0.8%
Rent to Value Ratio
Active
$469,000
1
bds
|
1
ba
|
1,022
sqft
|
built
1866
411 Bienville St, New Orleans, LA 70130
$-425
Cash flow
-4.7%
Cash-on-Cash Return
4.6%
Cap rate
0.6%
Rent to Value Ratio

Active
$275,000
4
bds
|
3
ba
|
2,232
sqft
|
built
1965
2529 Hudson Pl, New Orleans, LA 70131
$424
Cash flow
8.0%
Cash-on-Cash Return
7.5%
Cap rate
0.9%
Rent to Value Ratio

Active
$260,000
4
bds
|
0
ba
|
1,690
sqft
|
built
1944
6223 Wainwright Dr, New Orleans, LA 70122
$-402
Cash flow
-8.1%
Cash-on-Cash Return
3.8%
Cap rate
0.5%
Rent to Value Ratio

Active
$875,000
6
bds
|
4
ba
|
3,920
sqft
|
built
2005
6919 Memphis St, New Orleans, LA 70124
$-760
Cash flow
-4.5%
Cash-on-Cash Return
4.6%
Cap rate
0.6%
Rent to Value Ratio

Active
$648,900
5
bds
|
3
ba
|
2,244
sqft
|
built
2019
415 N Dupre St, New Orleans, LA 70119
$-1,691
Cash flow
-13.6%
Cash-on-Cash Return
2.6%
Cap rate
0.3%
Rent to Value Ratio

Active
$539,000
5
bds
|
3
ba
|
2,111
sqft
|
built
1920
417 N Galvez St, New Orleans, LA 70119
$-1,309
Cash flow
-12.7%
Cash-on-Cash Return
2.8%
Cap rate
0.3%
Rent to Value Ratio

Active
$250,000
3
bds
|
2
ba
|
1,777
sqft
|
built
1969
2113 Valentine Ct, New Orleans, LA 70114
$335
Cash flow
7.0%
Cash-on-Cash Return
7.3%
Cap rate
0.9%
Rent to Value Ratio

Active
$1,180,000
7
bds
|
0
ba
|
3,094
sqft
|
built
1880
1138 Chartres St, New Orleans, LA 70116
$-3,997
Cash flow
-17.7%
Cash-on-Cash Return
1.6%
Cap rate
0.2%
Rent to Value Ratio
Active
$199,000
6
bds
|
0
ba
|
1,700
sqft
|
built
1950
1523 Alvar St, New Orleans, LA 70117
$-183
Cash flow
-4.8%
Cash-on-Cash Return
4.6%
Cap rate
0.6%
Rent to Value Ratio
Active
$235,000
1
bds
|
1
ba
|
655
sqft
|
built
1972
1765 Coliseum St, New Orleans, LA 70130
$-77
Cash flow
-1.7%
Cash-on-Cash Return
5.3%
Cap rate
0.6%
Rent to Value Ratio

Active
$299,000
3
bds
|
2
ba
|
1,550
sqft
|
built
1890
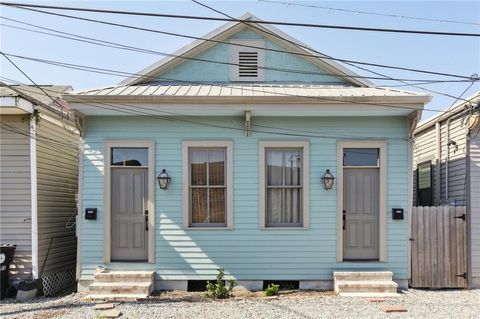
1607 N Villere St, New Orleans, LA 70116
$310
Cash flow
5.4%
Cash-on-Cash Return
6.9%
Cap rate
0.8%
Rent to Value Ratio

Active
$235,000
4
bds
|
0
ba
|
1,590
sqft
|
built
1920
3309 4th St, New Orleans, LA 70125
$-8
Cash flow
-0.2%
Cash-on-Cash Return
5.6%
Cap rate
0.7%
Rent to Value Ratio

Active
$199,000
5
bds
|
0
ba
|
2,600
sqft
|
built
1978
13700 N Nemours St, New Orleans, LA 70129
$24
Cash flow
0.6%
Cash-on-Cash Return
5.8%
Cap rate
0.7%
Rent to Value Ratio
Active
$325,000
4
bds
|
0
ba
|
1,386
sqft
|
built
1920
3979 S Front St, New Orleans, LA 70115
$-434
Cash flow
-7.0%
Cash-on-Cash Return
4.1%
Cap rate
0.5%
Rent to Value Ratio

Active
$135,000
3
bds
|
1
ba
|
1,440
sqft
|
built
1940
2604 Philip St, New Orleans, LA 70113
$327
Cash flow
12.6%
Cash-on-Cash Return
8.6%
Cap rate
1.0%
Rent to Value Ratio
Active
$1,100,000
3
bds
|
4
ba
|
3,130
sqft
|
built
1857
1234 Saint Andrew St, New Orleans, LA 70130
$-2,446
Cash flow
-11.6%
Cash-on-Cash Return
3.0%
Cap rate
0.4%
Rent to Value Ratio

Active
$235,000
4
bds
|
2
ba
|
2,325
sqft
|
built
1975
1912 Holiday Dr, New Orleans, LA 70114
$406
Cash flow
9.0%
Cash-on-Cash Return
7.8%
Cap rate
0.9%
Rent to Value Ratio
Active
$145,000
3
bds
|
1
ba
|
1,721
sqft
|
built
1940
5123 Chartres St, New Orleans, LA 70117
$280
Cash flow
10.1%
Cash-on-Cash Return
8.0%
Cap rate
1.0%
Rent to Value Ratio
Active
$775,000
2
bds
|
3
ba
|
1,428
sqft
|
built
1912
840 Tchoupitoulas St, New Orleans, LA 70130
$-977
Cash flow
-6.6%
Cash-on-Cash Return
4.2%
Cap rate
0.5%
Rent to Value Ratio

Active
$469,000
3
bds
|
3
ba
|
1,820
sqft
|
built
2017
2728 Bienville St, New Orleans, LA 70119
$58
Cash flow
0.6%
Cash-on-Cash Return
5.8%
Cap rate
0.7%
Rent to Value Ratio