Orleans Parish County Investment Properties for Sale
Browse homes for sale and investment properties in Orleans Parish County. Refine your search by price, property type, or more.
Best cash flowing properties in Orleans Parish County
Active
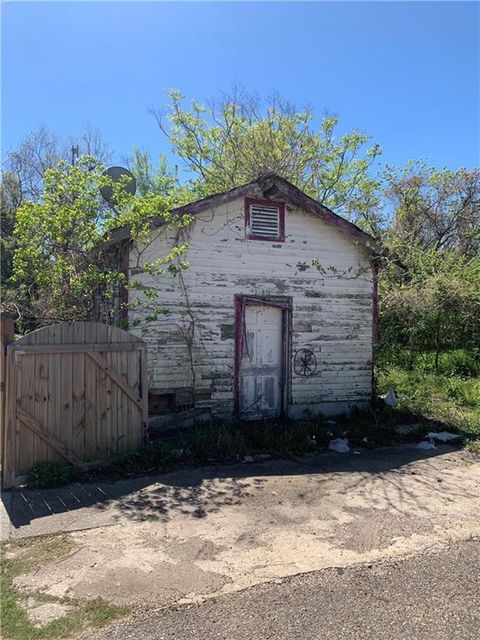
$18,500
bds
|
0
ba
|
1,005
sqft
|
built
1900
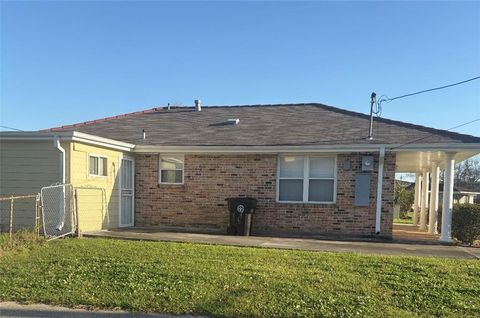
3101 Diana St, New Orleans, LA 70114
$1,035
Cash flow
65.2%
Cash-on-Cash Return
67.1%
Cap rate
8.1%
Rent to Value Ratio
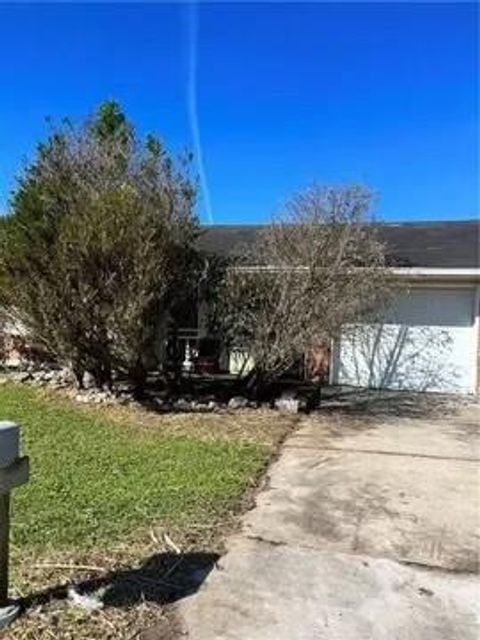
Active
$65,000
3
bds
|
2
ba
|
1,185
sqft
|
built
1979
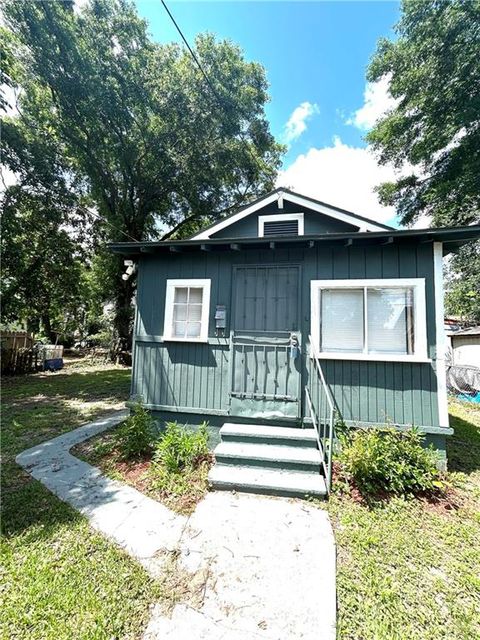
8 Point Coupee Pl, New Orleans, LA 70129
$966
Cash flow
17.3%
Cash-on-Cash Return
17.8%
Cap rate
2.2%
Rent to Value Ratio
1,089 out of 1,095 properties for sale in Orleans Parish County
Limited Results Shown
Create a free account, or log in to reveal all property listings and enjoy the complete experience.
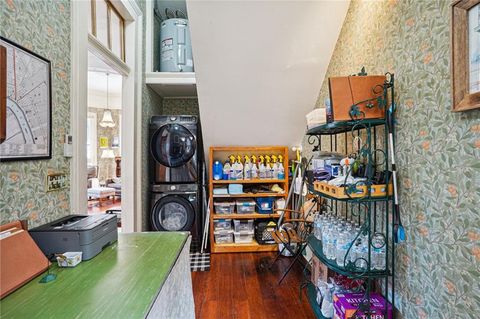
Active
$389,000
1
bds
|
1
ba
|
1,057
sqft
|
built
1870
1703 Coliseum St, New Orleans, LA 70130
$-323
Cash flow
-4.3%
Cash-on-Cash Return
4.7%
Cap rate
0.6%
Rent to Value Ratio
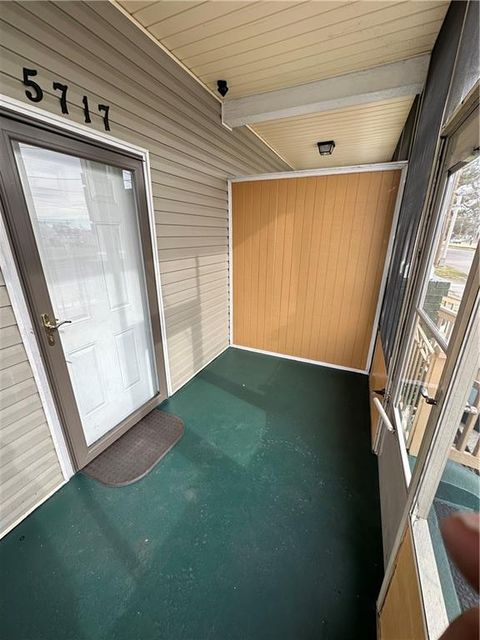
Active
$235,000
6
bds
|
0
ba
|
1,800
sqft
|
built
1940
5717 Saint Claude Ave, New Orleans, LA 70117
$-146
Cash flow
-3.2%
Cash-on-Cash Return
4.9%
Cap rate
0.6%
Rent to Value Ratio
Active
$295,000
3
bds
|
2
ba
|
1,538
sqft
|
built
2021
3016 Burdette St, New Orleans, LA 70125
$122
Cash flow
2.2%
Cash-on-Cash Return
6.2%
Cap rate
0.7%
Rent to Value Ratio
Active
$295,000
3
bds
|
2
ba
|
1,854
sqft
|
built
1960
2165 Brutus St, New Orleans, LA 70122
$122
Cash flow
2.2%
Cash-on-Cash Return
6.2%
Cap rate
0.7%
Rent to Value Ratio
Active
$250,000
1
bds
|
1
ba
|
982
sqft
|
built
1840
1017 Conti St, New Orleans, LA 70112
$-286
Cash flow
-6.0%
Cash-on-Cash Return
4.3%
Cap rate
0.5%
Rent to Value Ratio
Active
$210,000
2
bds
|
2
ba
|
864
sqft
|
built
1976
2635 Saint Philip St, New Orleans, LA 70119
$524
Cash flow
13.0%
Cash-on-Cash Return
8.7%
Cap rate
1.0%
Rent to Value Ratio
Active
$150,000
3
bds
|
3
ba
|
1,438
sqft
|
built
1938
1833 Painters St, New Orleans, LA 70117
$394
Cash flow
13.7%
Cash-on-Cash Return
8.8%
Cap rate
1.1%
Rent to Value Ratio
Active
$245,000
4
bds
|
2
ba
|
2,709
sqft
|
built
1960
4107 Virgil Blvd, New Orleans, LA 70122
$773
Cash flow
16.5%
Cash-on-Cash Return
9.5%
Cap rate
1.1%
Rent to Value Ratio
Active
$255,000
3
bds
|
2
ba
|
1,401
sqft
|
built
1950
4714 Annette St, New Orleans, LA 70122
$311
Cash flow
6.4%
Cash-on-Cash Return
7.1%
Cap rate
0.9%
Rent to Value Ratio
Active
$629,900
3
bds
|
3
ba
|
2,286
sqft
|
built
2014
6510 Fleur De Lis Dr, New Orleans, LA 70124
$-290
Cash flow
-2.4%
Cash-on-Cash Return
5.1%
Cap rate
0.6%
Rent to Value Ratio
Active
$257,900
3
bds
|
2
ba
|
1,567
sqft
|
built
1977
1491 Granada Dr, New Orleans, LA 70122
$22
Cash flow
0.4%
Cash-on-Cash Return
5.8%
Cap rate
0.7%
Rent to Value Ratio
Active
$119,900
2
bds
|
2
ba
|
1,432
sqft
|
built
1985
10 Heritage Ln, New Orleans, LA 70114
$537
Cash flow
23.4%
Cash-on-Cash Return
11.0%
Cap rate
1.3%
Rent to Value Ratio
Active
$429,000
1
bds
|
2
ba
|
921
sqft
|
built
1985
1040 Chartres St, New Orleans, LA 70116
$-305
Cash flow
-3.7%
Cash-on-Cash Return
4.8%
Cap rate
0.6%
Rent to Value Ratio
Active
$799,000
4
bds
|
4
ba
|
4,293
sqft
|
built
1996
40 English Turn Dr, New Orleans, LA 70131
$-1,779
Cash flow
-11.6%
Cash-on-Cash Return
3.0%
Cap rate
0.4%
Rent to Value Ratio
Active
$150,000
2
bds
|
1
ba
|
975
sqft
|
built
1950
1929 Almonaster Ave, New Orleans, LA 70117
$394
Cash flow
13.7%
Cash-on-Cash Return
8.8%
Cap rate
1.1%
Rent to Value Ratio

Active
$429,000
4
bds
|
3
ba
|
1,764
sqft
|
built
1976
3212 Milan St, New Orleans, LA 70125
$-236
Cash flow
-2.9%
Cash-on-Cash Return
5.0%
Cap rate
0.6%
Rent to Value Ratio

Active
$499,500
3
bds
|
3
ba
|
1,967
sqft
|
built
2015
1427 Pressburg St, New Orleans, LA 70122
$120
Cash flow
1.3%
Cash-on-Cash Return
6.0%
Cap rate
0.7%
Rent to Value Ratio
Active
$1,450,000
4
bds
|
4
ba
|
3,959
sqft
|
built
1900
1114 Peniston St, New Orleans, LA 70115
$-4,378
Cash flow
-15.8%
Cash-on-Cash Return
2.1%
Cap rate
0.2%
Rent to Value Ratio
Active
$825,000
9
bds
|
6
ba
|
5,952
sqft
|
built
1950
4237 Fontainebleau Dr, New Orleans, LA 70125
$-2,317
Cash flow
-14.7%
Cash-on-Cash Return
2.3%
Cap rate
0.3%
Rent to Value Ratio

Active
$1,350,000
12
bds
|
0
ba
|
5,788
sqft
|
built
1905
2039 Calhoun St, New Orleans, LA 70118
$-4,802
Cash flow
-18.6%
Cash-on-Cash Return
1.4%
Cap rate
0.2%
Rent to Value Ratio
Active
$125,000
bds
|
1
ba
|
412
sqft
|
built
1907
1525 Clio St, New Orleans, LA 70130
$167
Cash flow
7.0%
Cash-on-Cash Return
7.3%
Cap rate
0.9%
Rent to Value Ratio
Active
$199,000
3
bds
|
2
ba
|
1,450
sqft
|
built
2010
4529 Citrus Dr, New Orleans, LA 70127
$300
Cash flow
7.9%
Cash-on-Cash Return
7.5%
Cap rate
0.9%
Rent to Value Ratio

Active
$217,000
3
bds
|
2
ba
|
1,162
sqft
|
built
1955
5330 Cameron Blvd, New Orleans, LA 70122
$491
Cash flow
11.8%
Cash-on-Cash Return
8.4%
Cap rate
1.0%
Rent to Value Ratio
Active
$235,000
2
bds
|
2
ba
|
1,000
sqft
|
built
1972
1420 Slidell St, New Orleans, LA 70114
$-146
Cash flow
-3.2%
Cash-on-Cash Return
4.9%
Cap rate
0.6%
Rent to Value Ratio

Active
$157,500
2
bds
|
2
ba
|
1,296
sqft
|
built
1979
18 Curtis Dr, New Orleans, LA 70126
$566
Cash flow
18.7%
Cash-on-Cash Return
10.0%
Cap rate
1.2%
Rent to Value Ratio

Active
$335,000
2
bds
|
2
ba
|
1,064
sqft
|
built
1985
4000 Davey St, New Orleans, LA 70122
$-67
Cash flow
-1.0%
Cash-on-Cash Return
5.4%
Cap rate
0.7%
Rent to Value Ratio
Active
$825,000
2
bds
|
2
ba
|
1,919
sqft
|
built
1904
422 Notre Dame St, New Orleans, LA 70130
$-1,489
Cash flow
-9.4%
Cash-on-Cash Return
3.5%
Cap rate
0.4%
Rent to Value Ratio
Active
$2,800,000
2
bds
|
3
ba
|
1,865
sqft
|
built
1967
2 Canal St, New Orleans, LA 70130
$-10,283
Cash flow
-19.2%
Cash-on-Cash Return
1.3%
Cap rate
0.2%
Rent to Value Ratio
Active
$394,000
2
bds
|
2
ba
|
1,144
sqft
|
built
1984
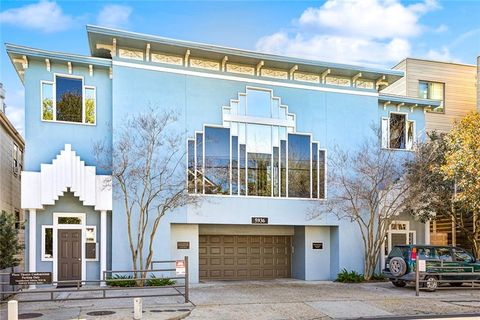
5936 Magazine St, New Orleans, LA 70115
$-71
Cash flow
-0.9%
Cash-on-Cash Return
5.5%
Cap rate
0.7%
Rent to Value Ratio
Active
$217,000
3
bds
|
3
ba
|
2,100
sqft
|
built
1989
7500 Ebbtide Dr, New Orleans, LA 70126
$353
Cash flow
8.5%
Cash-on-Cash Return
7.6%
Cap rate
0.9%
Rent to Value Ratio

Active
$190,000
5
bds
|
3
ba
|
3,250
sqft
|
built
1943
5467 Dauphine St, New Orleans, LA 70117
$826
Cash flow
22.7%
Cash-on-Cash Return
10.9%
Cap rate
1.3%
Rent to Value Ratio
Active
$235,000
1
bds
|
1
ba
|
640
sqft
|
built
2010
1201 Canal St, New Orleans, LA 70112
$-8
Cash flow
-0.2%
Cash-on-Cash Return
5.6%
Cap rate
0.7%
Rent to Value Ratio
Active
$690,000
4
bds
|
2
ba
|
1,586
sqft
|
built
1950
1111 Tulane Ave, New Orleans, LA 70112
$-781
Cash flow
-5.9%
Cash-on-Cash Return
4.3%
Cap rate
0.5%
Rent to Value Ratio
Active
$399,000
4
bds
|
4
ba
|
2,303
sqft
|
built
1930
5930 Louisville St, New Orleans, LA 70124
$-508
Cash flow
-6.6%
Cash-on-Cash Return
4.2%
Cap rate
0.5%
Rent to Value Ratio
Active
$179,000
1
bds
|
1
ba
|
541
sqft
|
built
1819
816 Austerlitz St, New Orleans, LA 70115
$119
Cash flow
3.5%
Cash-on-Cash Return
6.5%
Cap rate
0.8%
Rent to Value Ratio
Active
$344,000
9
bds
|
0
ba
|
4,601
sqft
|
built
1967
6800 W Coronet Ct, New Orleans, LA 70126
$-662
Cash flow
-10.0%
Cash-on-Cash Return
3.4%
Cap rate
0.4%
Rent to Value Ratio
Active
$699,000
2
bds
|
2
ba
|
1,479
sqft
|
built
1833
831 Saint Louis St, New Orleans, LA 70112
$-1,376
Cash flow
-10.3%
Cash-on-Cash Return
3.3%
Cap rate
0.4%
Rent to Value Ratio
Active
$279,000
1
bds
|
1
ba
|
690
sqft
|
built
1832
837 Burgundy St, New Orleans, LA 70116
$-9
Cash flow
-0.2%
Cash-on-Cash Return
5.6%
Cap rate
0.7%
Rent to Value Ratio