Orleans Parish County Investment Properties for Sale
Browse homes for sale and investment properties in Orleans Parish County. Refine your search by price, property type, or more.
Best cash flowing properties in Orleans Parish County
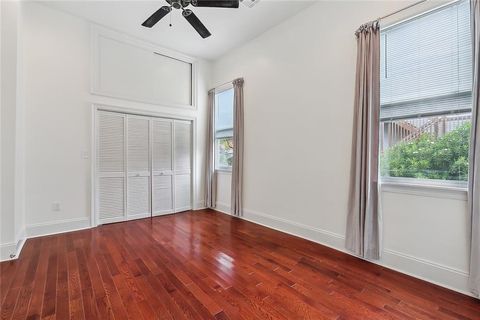
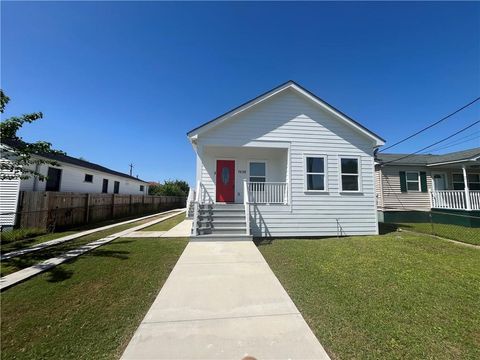
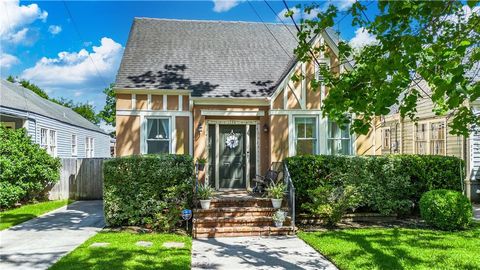
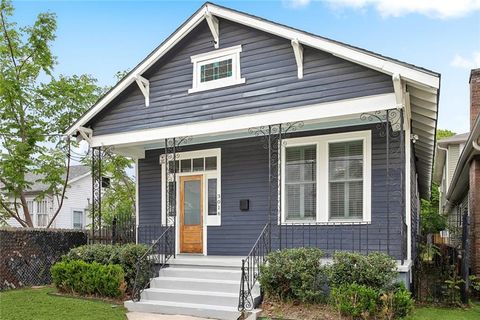
Active
$214,900
2
bds
|
1
ba
|
1,136
sqft
|
built
2016
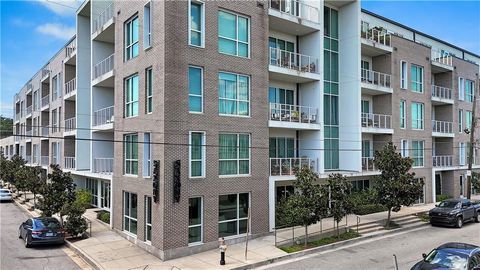
24204 Chef Menteur Hwy, New Orleans, LA 70129
$777
Cash flow
18.9%
Cash-on-Cash Return
10.0%
Cap rate
1.2%
Rent to Value Ratio
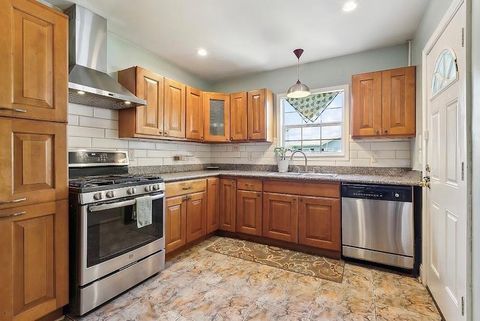
Active
$189,900
3
bds
|
3
ba
|
2,416
sqft
|
built
1983
1239 Seville Dr, New Orleans, LA 70122
$688
Cash flow
18.9%
Cash-on-Cash Return
10.0%
Cap rate
1.2%
Rent to Value Ratio
1,203 out of 1,209 properties for sale in Orleans Parish County
Limited Results Shown
Create a free account, or log in to reveal all property listings and enjoy the complete experience.
Active
$175,500
bds
|
1
ba
|
435
sqft
|
built
1920
185 Walnut St, New Orleans, LA 70118
$135
Cash flow
4.0%
Cash-on-Cash Return
6.6%
Cap rate
0.8%
Rent to Value Ratio
Active
$1,099,000
5
bds
|
7
ba
|
6,004
sqft
|
built
1995
12 Rosedown Ct, New Orleans, LA 70131
$-2,992
Cash flow
-14.2%
Cash-on-Cash Return
2.4%
Cap rate
0.3%
Rent to Value Ratio
Active
$325,000
3
bds
|
2
ba
|
1,353
sqft
|
built
2016
2738 Cleveland Ave, New Orleans, LA 70119
$49
Cash flow
0.8%
Cash-on-Cash Return
5.9%
Cap rate
0.7%
Rent to Value Ratio
Active
$230,000
2
bds
|
1
ba
|
1,252
sqft
|
built
1940
3856 Gentilly Blvd, New Orleans, LA 70122
$154
Cash flow
3.5%
Cash-on-Cash Return
6.5%
Cap rate
0.8%
Rent to Value Ratio
Active
$299,999
3
bds
|
2
ba
|
2,260
sqft
|
built
1940
1318 Dublin St, New Orleans, LA 70118
$98
Cash flow
1.7%
Cash-on-Cash Return
6.1%
Cap rate
0.7%
Rent to Value Ratio
Active
$420,000
3
bds
|
3
ba
|
1,393
sqft
|
built
1923
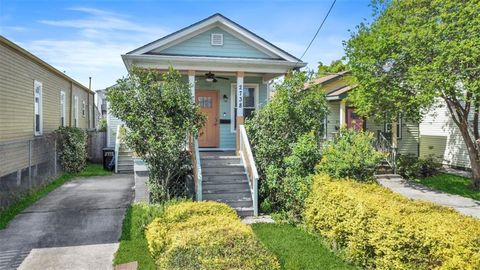
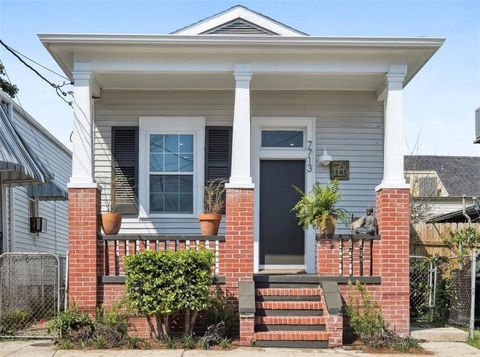
7713 Zimpel St, New Orleans, LA 70118
$427
Cash flow
5.3%
Cash-on-Cash Return
6.9%
Cap rate
0.8%
Rent to Value Ratio
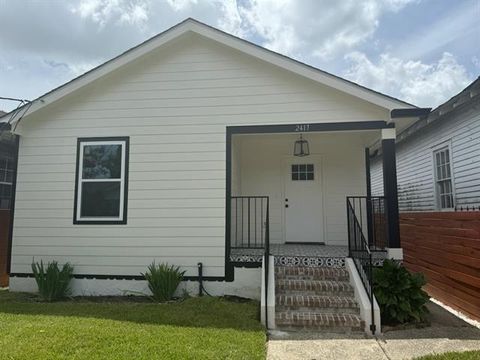
Active
$252,400
4
bds
|
3
ba
|
1,526
sqft
|
built
1920
2417 Eagle St, New Orleans, LA 70118
$531
Cash flow
11.0%
Cash-on-Cash Return
8.2%
Cap rate
1.0%
Rent to Value Ratio
Active
$299,900
3
bds
|
3
ba
|
1,776
sqft
|
built
1962
2628 N Derbigny St, New Orleans, LA 70117
$306
Cash flow
5.3%
Cash-on-Cash Return
6.9%
Cap rate
0.8%
Rent to Value Ratio
Active
$499,000
5
bds
|
4
ba
|
2,806
sqft
|
built
1999
7721 Bullard Ave, New Orleans, LA 70128
$-636
Cash flow
-6.6%
Cash-on-Cash Return
4.1%
Cap rate
0.5%
Rent to Value Ratio
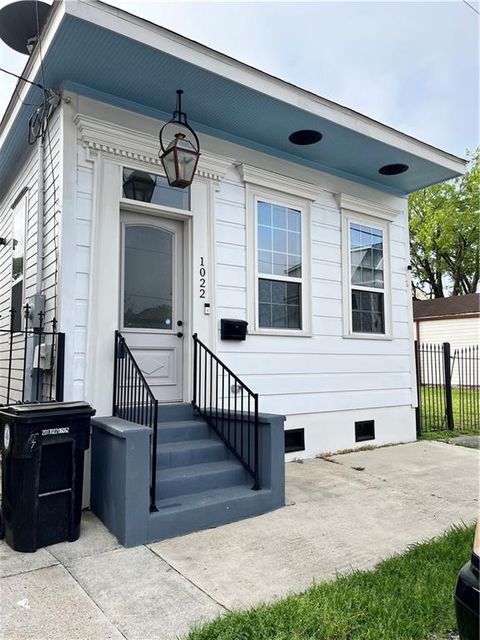
Active
$249,000
2
bds
|
2
ba
|
1,169
sqft
|
built
1920
1022 N Derbigny St, New Orleans, LA 70116
$340
Cash flow
7.1%
Cash-on-Cash Return
7.3%
Cap rate
0.9%
Rent to Value Ratio
Active
$1,035,000
5
bds
|
3
ba
|
3,400
sqft
|
built
1906
3418 Coliseum St, New Orleans, LA 70115
$-1,103
Cash flow
-5.6%
Cash-on-Cash Return
4.4%
Cap rate
0.5%
Rent to Value Ratio
Active
$675,000
4
bds
|
3
ba
|
2,879
sqft
|
built
2007
1643 S Norman C Francis Pkwy, New Orleans, LA 70125
$-1,055
Cash flow
-8.2%
Cash-on-Cash Return
3.8%
Cap rate
0.5%
Rent to Value Ratio
Active
$239,000
1
bds
|
1
ba
|
635
sqft
|
built
1835
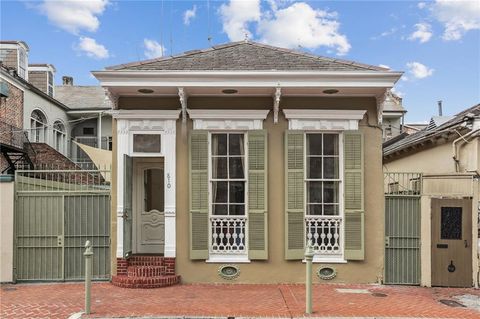
829 Ursulines Ave, New Orleans, LA 70116
$-27
Cash flow
-0.6%
Cash-on-Cash Return
5.5%
Cap rate
0.7%
Rent to Value Ratio
Active
$1,249,000
3
bds
|
4
ba
|
2,488
sqft
|
built
1893
1005 Joseph St, New Orleans, LA 70115
$-1,978
Cash flow
-8.3%
Cash-on-Cash Return
3.8%
Cap rate
0.5%
Rent to Value Ratio
Active
$389,000
3
bds
|
3
ba
|
1,908
sqft
|
built
1923
3805 Magnolia St, New Orleans, LA 70115
$-116
Cash flow
-1.6%
Cash-on-Cash Return
5.3%
Cap rate
0.6%
Rent to Value Ratio
Active
$209,000
3
bds
|
2
ba
|
1,336
sqft
|
built
2022
7638 Lady Gray St, New Orleans, LA 70127
$529
Cash flow
13.2%
Cash-on-Cash Return
8.7%
Cap rate
1.1%
Rent to Value Ratio
Active
$309,900
3
bds
|
2
ba
|
1,407
sqft
|
built
1980
3413 Desaix Blvd, New Orleans, LA 70119
$-87
Cash flow
-1.5%
Cash-on-Cash Return
5.3%
Cap rate
0.6%
Rent to Value Ratio
Active
$399,000
2
bds
|
3
ba
|
2,393
sqft
|
built
1840
1520 Esplanade Ave, New Orleans, LA 70116
$-163
Cash flow
-2.1%
Cash-on-Cash Return
5.2%
Cap rate
0.6%
Rent to Value Ratio
Active
$469,000
4
bds
|
2
ba
|
1,723
sqft
|
built
1941
2725 Joseph St, New Orleans, LA 70115
$-80
Cash flow
-0.9%
Cash-on-Cash Return
5.5%
Cap rate
0.7%
Rent to Value Ratio
Active
$275,000
3
bds
|
2
ba
|
2,025
sqft
|
built
1991
3011 Memorial Park Dr, New Orleans, LA 70114
$424
Cash flow
8.0%
Cash-on-Cash Return
7.5%
Cap rate
0.9%
Rent to Value Ratio
Active
$170,000
3
bds
|
3
ba
|
1,708
sqft
|
built
1960
2710 Mexico St, New Orleans, LA 70122
$438
Cash flow
13.4%
Cash-on-Cash Return
8.8%
Cap rate
1.1%
Rent to Value Ratio
Active
$475,000
7
bds
|
0
ba
|
875
sqft
|
built
1935
1016 Independence St, New Orleans, LA 70117
$-1,006
Cash flow
-11.0%
Cash-on-Cash Return
3.1%
Cap rate
0.4%
Rent to Value Ratio
Active
$209,000
1
bds
|
1
ba
|
645
sqft
|
built
1941
7444 Saint Charles Ave, New Orleans, LA 70118
$-23
Cash flow
-0.6%
Cash-on-Cash Return
5.5%
Cap rate
0.7%
Rent to Value Ratio
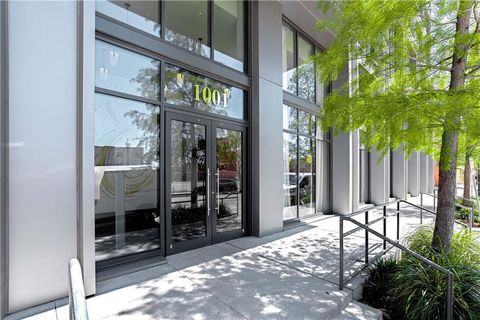
Active
$955,000
2
bds
|
3
ba
|
1,482
sqft
|
built
2018
1001 Julia St, New Orleans, LA 70113
$-724
Cash flow
-4.0%
Cash-on-Cash Return
4.8%
Cap rate
0.6%
Rent to Value Ratio
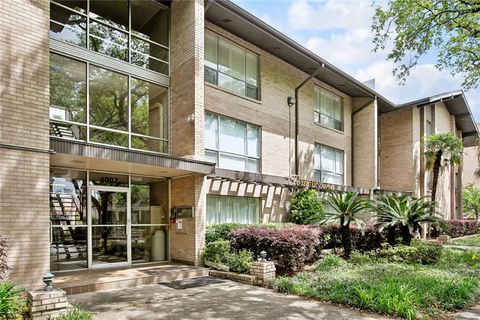
Active
$240,000
1
bds
|
1
ba
|
665
sqft
|
built
1958
4007 Saint Charles Ave, New Orleans, LA 70115
$-170
Cash flow
-3.7%
Cash-on-Cash Return
4.8%
Cap rate
0.6%
Rent to Value Ratio
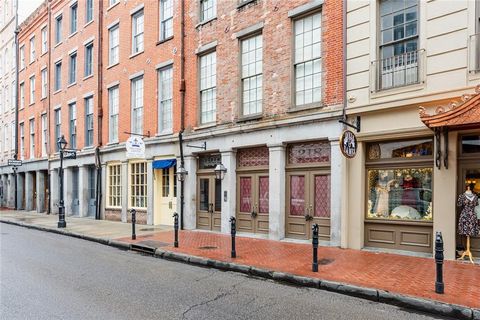
Active
$445,000
2
bds
|
2
ba
|
1,134
sqft
|
built
1919
220 Decatur St, New Orleans, LA 70130
$33
Cash flow
0.4%
Cash-on-Cash Return
5.8%
Cap rate
0.7%
Rent to Value Ratio
Active
$279,000
1
bds
|
2
ba
|
768
sqft
|
built
2019
900 Bartholomew St, New Orleans, LA 70117
$60
Cash flow
1.1%
Cash-on-Cash Return
5.9%
Cap rate
0.7%
Rent to Value Ratio
Active
$3,995,000
4
bds
|
6
ba
|
5,698
sqft
|
built
1905
929 Bienville St, New Orleans, LA 70112
$-15,801
Cash flow
-20.6%
Cash-on-Cash Return
0.9%
Cap rate
0.1%
Rent to Value Ratio
Active
$629,000
4
bds
|
4
ba
|
2,763
sqft
|
built
1930
1416 Touro St, New Orleans, LA 70116
$-769
Cash flow
-6.4%
Cash-on-Cash Return
4.2%
Cap rate
0.5%
Rent to Value Ratio
Active
$674,000
2
bds
|
2
ba
|
1,126
sqft
|
built
2020
731 Saint Charles Ave, New Orleans, LA 70130
$-775
Cash flow
-6.0%
Cash-on-Cash Return
4.3%
Cap rate
0.5%
Rent to Value Ratio
Active
$417,000
3
bds
|
3
ba
|
2,400
sqft
|
built
1995
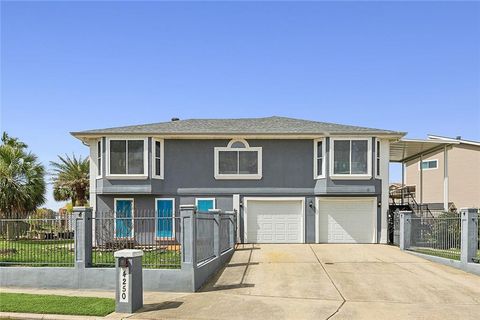
4250 Murano Rd, New Orleans, LA 70129
$161
Cash flow
2.0%
Cash-on-Cash Return
6.1%
Cap rate
0.7%
Rent to Value Ratio
Active
$550,000
1
bds
|
2
ba
|
1,051
sqft
|
built
1887
810 Orleans Ave, New Orleans, LA 70116
$-602
Cash flow
-5.7%
Cash-on-Cash Return
4.4%
Cap rate
0.5%
Rent to Value Ratio
Active
$389,000
1
bds
|
1
ba
|
1,057
sqft
|
built
1870
1703 Coliseum St, New Orleans, LA 70130
$-323
Cash flow
-4.3%
Cash-on-Cash Return
4.7%
Cap rate
0.6%
Rent to Value Ratio
Active
$235,000
6
bds
|
0
ba
|
1,800
sqft
|
built
1940
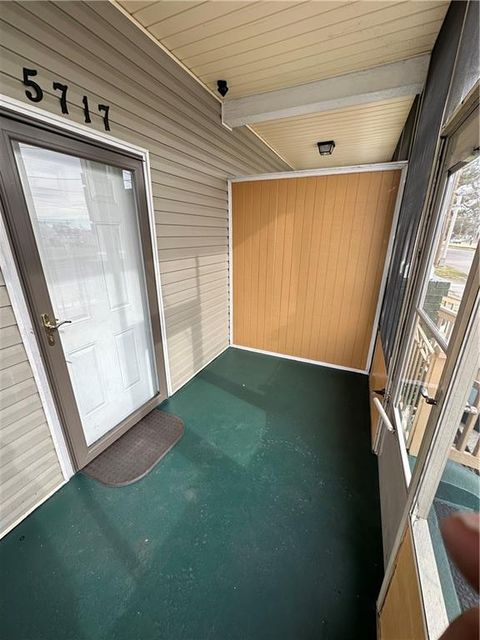
5717 Saint Claude Ave, New Orleans, LA 70117
$-146
Cash flow
-3.2%
Cash-on-Cash Return
4.9%
Cap rate
0.6%
Rent to Value Ratio
Active
$295,000
3
bds
|
2
ba
|
1,538
sqft
|
built
2021
3016 Burdette St, New Orleans, LA 70125
$122
Cash flow
2.2%
Cash-on-Cash Return
6.2%
Cap rate
0.7%
Rent to Value Ratio
Active
$295,000
3
bds
|
2
ba
|
1,854
sqft
|
built
1960
2165 Brutus St, New Orleans, LA 70122
$122
Cash flow
2.2%
Cash-on-Cash Return
6.2%
Cap rate
0.7%
Rent to Value Ratio
Active
$344,000
1
bds
|
1
ba
|
642
sqft
|
built
1872
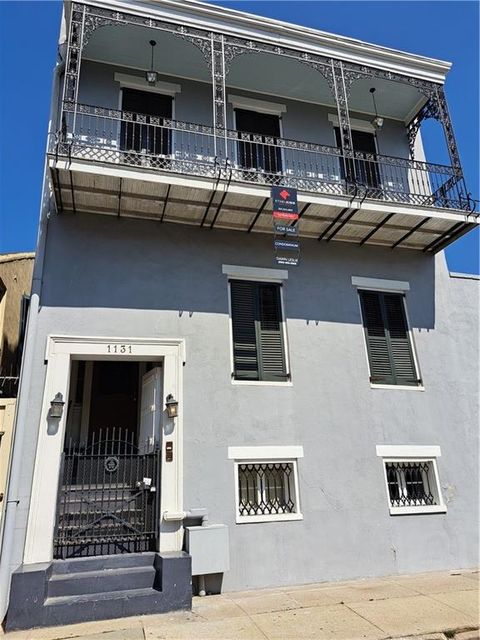
1131 Burgundy St, New Orleans, LA 70116
$-455
Cash flow
-6.9%
Cash-on-Cash Return
4.1%
Cap rate
0.5%
Rent to Value Ratio
Active
$250,000
1
bds
|
1
ba
|
982
sqft
|
built
1840
1017 Conti St, New Orleans, LA 70112
$-286
Cash flow
-6.0%
Cash-on-Cash Return
4.3%
Cap rate
0.5%
Rent to Value Ratio