Orleans Parish County Investment Properties for Sale
Browse homes for sale and investment properties in Orleans Parish County. Refine your search by price, property type, or more.
Best cash flowing properties in Orleans Parish County
Active
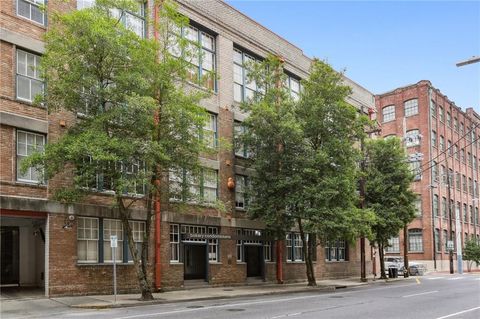
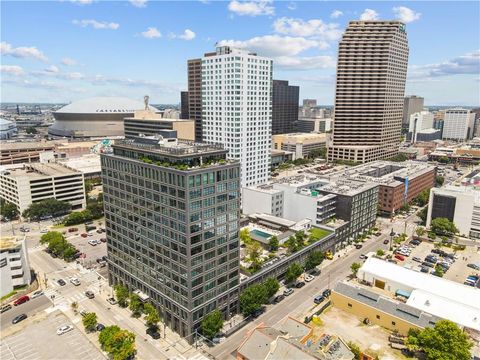
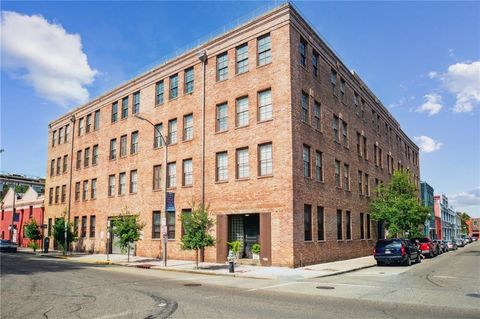
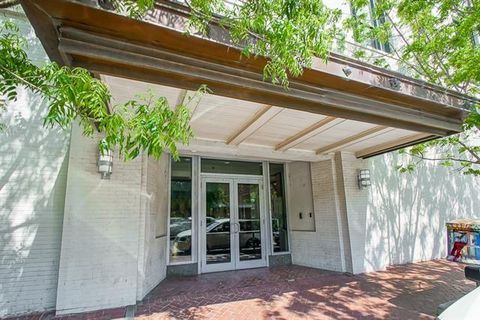
$195,000
1
bds
|
1
ba
|
443
sqft
|
built
1919
1111 S Peters St, New Orleans, LA 70130
$802
Cash flow
21.5%
Cash-on-Cash Return
10.6%
Cap rate
1.3%
Rent to Value Ratio
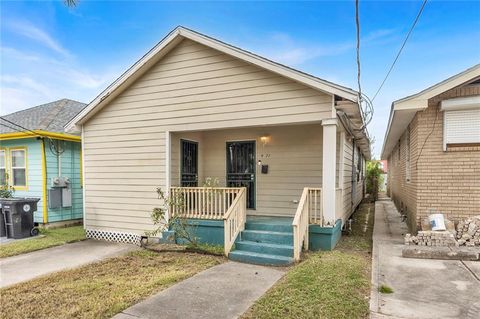
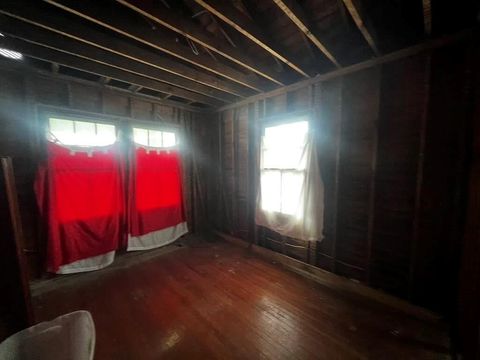
Active
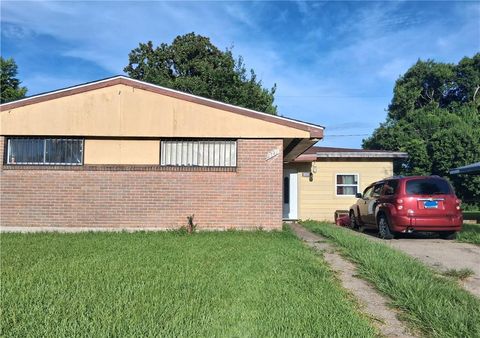
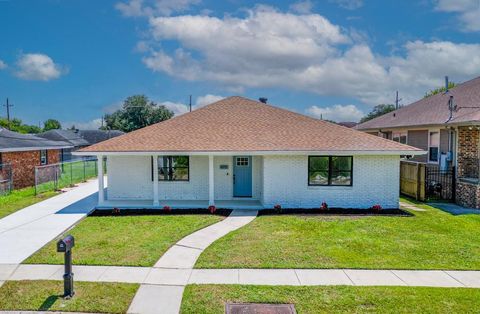
$123,000
4
bds
|
1
ba
|
1,795
sqft
|
built
1968
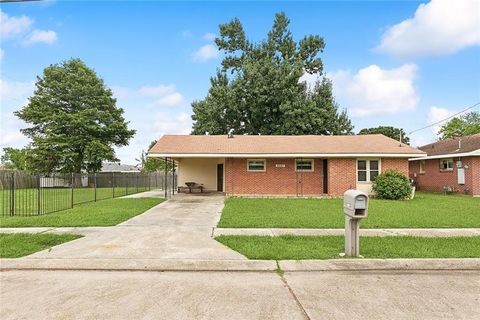
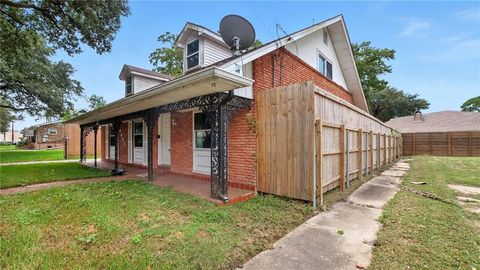
3210 Lancaster St, New Orleans, LA 70131
$660
Cash flow
28.0%
Cash-on-Cash Return
12.1%
Cap rate
1.5%
Rent to Value Ratio
1,089 out of 1,095 properties for sale in Orleans Parish County
Limited Results Shown
Create a free account, or log in to reveal all property listings and enjoy the complete experience.
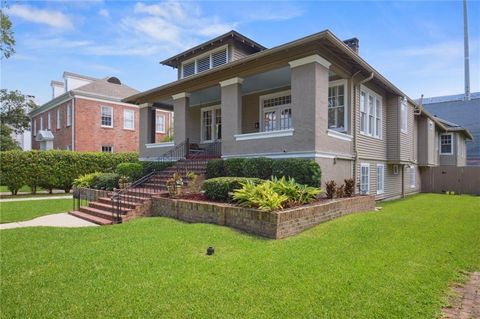
Active
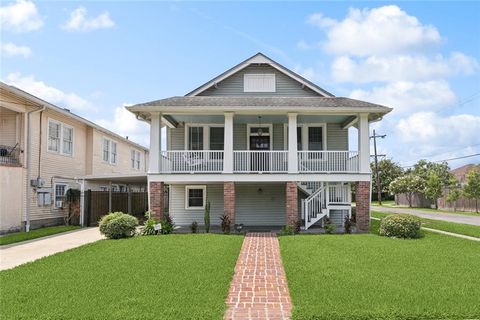
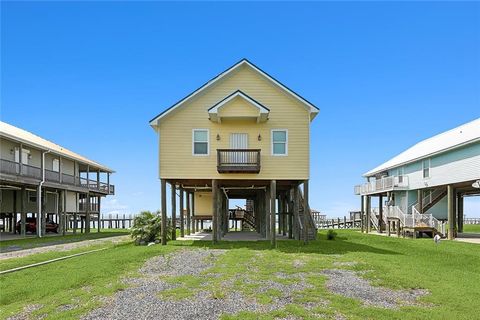
$475,000
4
bds
|
3
ba
|
3,327
sqft
|
built
1940
4236 Walmsley Ave, New Orleans, LA 70125
$-40
Cash flow
-0.4%
Cash-on-Cash Return
5.6%
Cap rate
0.7%
Rent to Value Ratio
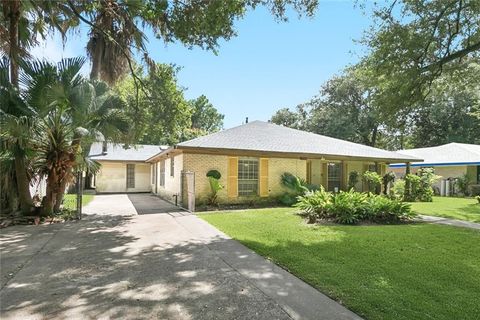
Active
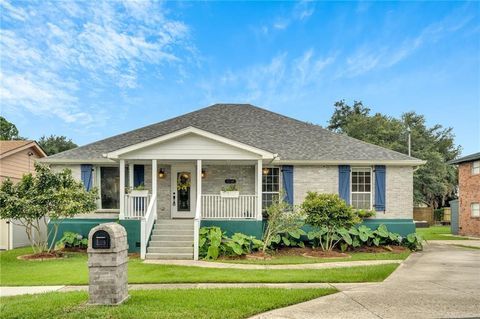
$349,000
4
bds
|
2
ba
|
2,077
sqft
|
built
1969
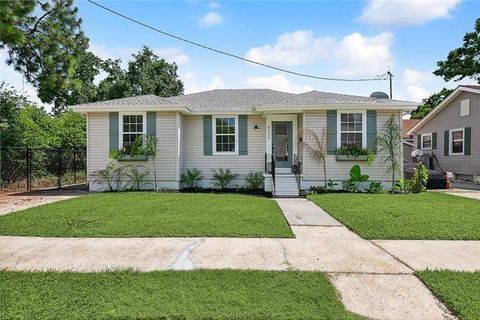
1220 Park Island Dr, New Orleans, LA 70122
$142
Cash flow
2.1%
Cash-on-Cash Return
6.2%
Cap rate
0.7%
Rent to Value Ratio
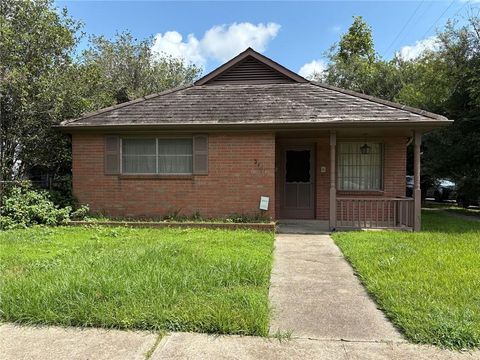
Active
$169,000
3
bds
|
2
ba
|
1,536
sqft
|
built
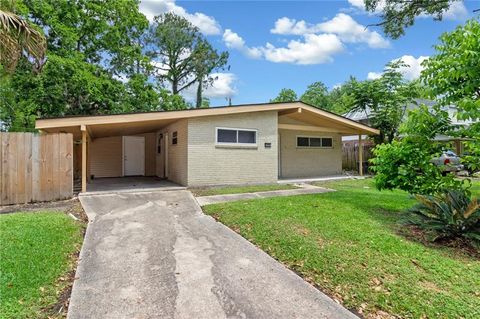
1972
4897 Cerise Ave, New Orleans, LA 70127
$304
Cash flow
9.4%
Cash-on-Cash Return
7.8%
Cap rate
0.9%
Rent to Value Ratio
Active
$395,000
3
bds
|
2
ba
|
1,823
sqft
|
built
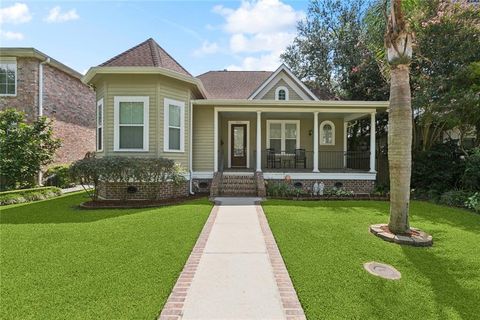
1946
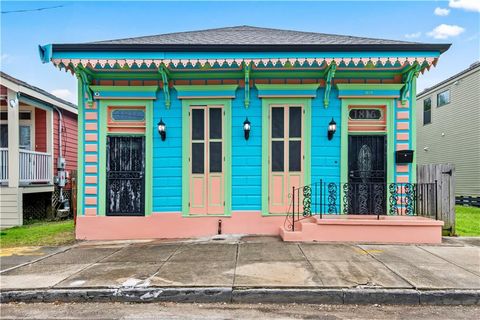
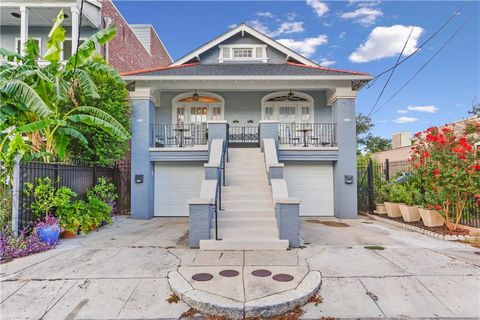
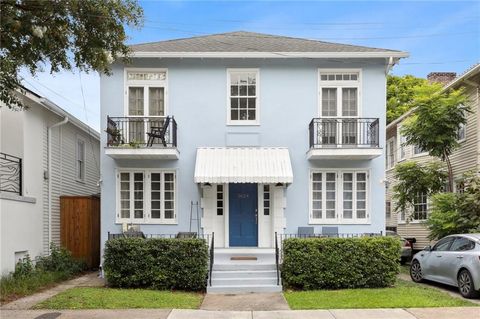
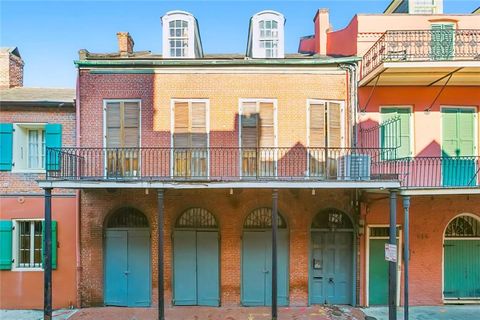
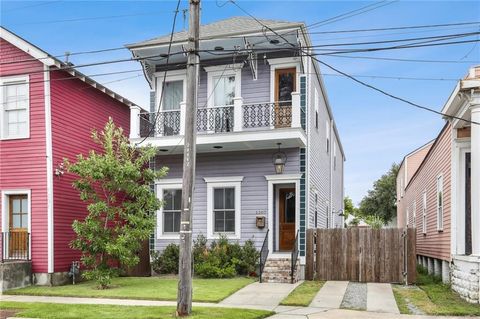
1814 Dumaine St, New Orleans, LA 70116
$63
Cash flow
0.8%
Cash-on-Cash Return
5.9%
Cap rate
0.7%
Rent to Value Ratio
Active
$399,000
3
bds
|
2
ba
|
1,198
sqft
|
built
1955
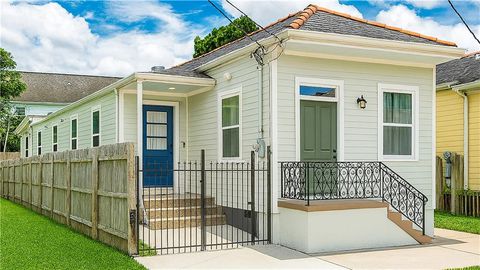
528 S Rocheblave St, New Orleans, LA 70119
$-853
Cash flow
-11.2%
Cash-on-Cash Return
3.1%
Cap rate
0.4%
Rent to Value Ratio
Active
$165,000
3
bds
|
2
ba
|
1,320
sqft
|
built
1940
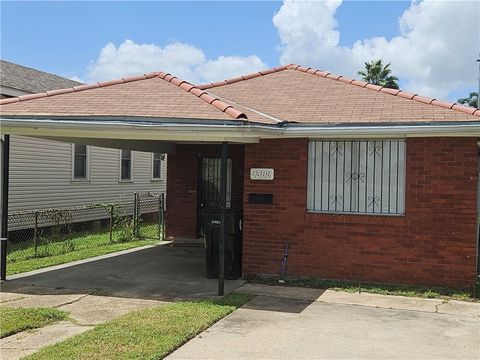
9308 Olive St, New Orleans, LA 70118
$392
Cash flow
12.4%
Cash-on-Cash Return
8.5%
Cap rate
1.0%
Rent to Value Ratio
Active
$225,000
3
bds
|
3
ba
|
1,656
sqft
|
built
1999
9133 Edinburgh St, New Orleans, LA 70118
$177
Cash flow
4.1%
Cash-on-Cash Return
6.6%
Cap rate
0.8%
Rent to Value Ratio
Active
$425,000
3
bds
|
2
ba
|
1,597
sqft
|
built
1964
5801 Tchoupitoulas St, New Orleans, LA 70115
$-217
Cash flow
-2.7%
Cash-on-Cash Return
5.1%
Cap rate
0.6%
Rent to Value Ratio
Active
$265,000
4
bds
|
2
ba
|
2,863
sqft
|
built
1966
5933 Dover Pl, New Orleans, LA 70131
$471
Cash flow
9.3%
Cash-on-Cash Return
7.8%
Cap rate
0.9%
Rent to Value Ratio
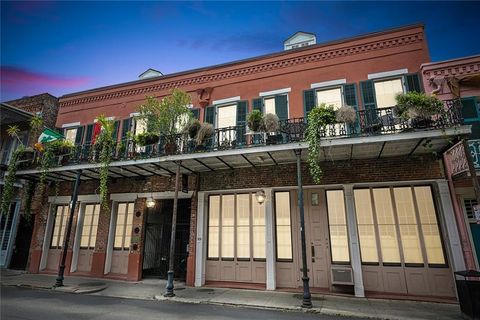
Active
$499,900
1
bds
|
1
ba
|
650
sqft
|
built
1840
931 Chartres St, New Orleans, LA 70116
$-1,124
Cash flow
-11.7%
Cash-on-Cash Return
3.0%
Cap rate
0.4%
Rent to Value Ratio
Active
$575,000
1
bds
|
1
ba
|
947
sqft
|
built
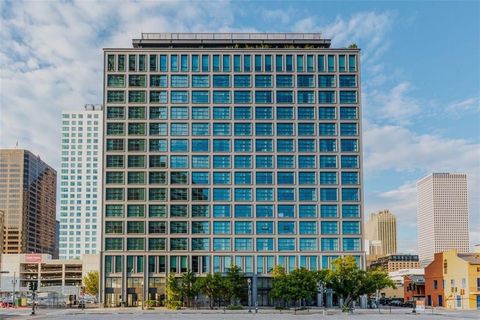
2018
1001 Julia St, New Orleans, LA 70113
$-306
Cash flow
-2.8%
Cash-on-Cash Return
5.0%
Cap rate
0.6%
Rent to Value Ratio
Active
$224,500
2
bds
|
2
ba
|
910
sqft
|
built
1908
1129 Ursulines Ave, New Orleans, LA 70116
$-27
Cash flow
-0.6%
Cash-on-Cash Return
5.5%
Cap rate
0.7%
Rent to Value Ratio
Active
$237,500
4
bds
|
3
ba
|
2,438
sqft
|
built
1960
4442 Knight Dr, New Orleans, LA 70127
$394
Cash flow
8.7%
Cash-on-Cash Return
7.7%
Cap rate
0.9%
Rent to Value Ratio
Active
$430,000
6
bds
|
4
ba
|
3,280
sqft
|
built
1925
1724 Fern St, New Orleans, LA 70118
$-655
Cash flow
-7.9%
Cash-on-Cash Return
3.9%
Cap rate
0.5%
Rent to Value Ratio
Active
$695,000
8
bds
|
4
ba
|
3,400
sqft
|
built
1940
3624 Dumaine St, New Orleans, LA 70119
$-1,771
Cash flow
-13.3%
Cash-on-Cash Return
2.6%
Cap rate
0.3%
Rent to Value Ratio
Active
$530,000
2
bds
|
2
ba
|
1,576
sqft
|
built
1910
404 Notre Dame St, New Orleans, LA 70130
$-300
Cash flow
-3.0%
Cash-on-Cash Return
5.0%
Cap rate
0.6%
Rent to Value Ratio
Active
$235,000
3
bds
|
2
ba
|
1,665
sqft
|
built
1972
4711 Eunice St, New Orleans, LA 70127
$-8
Cash flow
-0.2%
Cash-on-Cash Return
5.6%
Cap rate
0.7%
Rent to Value Ratio
Active
$445,000
3
bds
|
3
ba
|
1,498
sqft
|
built
2010
25307 Chef Menteur Hwy, New Orleans, LA 70129
$-105
Cash flow
-1.2%
Cash-on-Cash Return
5.4%
Cap rate
0.7%
Rent to Value Ratio
Active
$315,000
2
bds
|
2
ba
|
834
sqft
|
built
1900
1201 Canal St, New Orleans, LA 70112
$-111
Cash flow
-1.8%
Cash-on-Cash Return
5.3%
Cap rate
0.6%
Rent to Value Ratio
Active
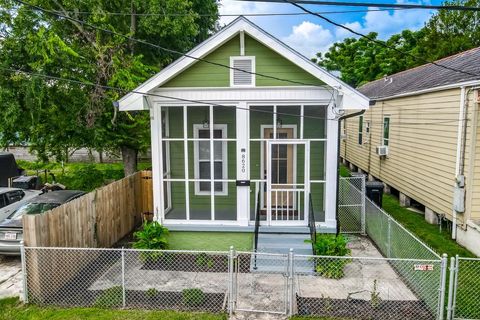
$349,900
3
bds
|
3
ba
|
1,457
sqft
|
built
1920
8620 Green St, New Orleans, LA 70118
$-414
Cash flow
-6.2%
Cash-on-Cash Return
4.3%
Cap rate
0.5%
Rent to Value Ratio
Active
$899,000
3
bds
|
3
ba
|
2,980
sqft
|
built
1900
73 Audubon Blvd, New Orleans, LA 70118
$-735
Cash flow
-4.3%
Cash-on-Cash Return
4.7%
Cap rate
0.6%
Rent to Value Ratio
Active
$350,000
4
bds
|
2
ba
|
2,880
sqft
|
built
1920
2531 Leonidas St, New Orleans, LA 70118
$-138
Cash flow
-2.1%
Cash-on-Cash Return
5.2%
Cap rate
0.6%
Rent to Value Ratio
Active
$199,900
3
bds
|
2
ba
|
1,272
sqft
|
built
1973
4006 N Miro St, New Orleans, LA 70117
$434
Cash flow
11.3%
Cash-on-Cash Return
8.3%
Cap rate
1.0%
Rent to Value Ratio
Active
$535,000
3
bds
|
2
ba
|
1,569
sqft
|
built
2008
5959 Argonne Blvd, New Orleans, LA 70124
$-807
Cash flow
-7.9%
Cash-on-Cash Return
3.9%
Cap rate
0.5%
Rent to Value Ratio
Active
$195,000
3
bds
|
2
ba
|
1,290
sqft
|
built
1971
5010 Mac Arthur Blvd, New Orleans, LA 70131
$319
Cash flow
8.5%
Cash-on-Cash Return
7.6%
Cap rate
0.9%
Rent to Value Ratio
Active
$499,000
1
bds
|
1
ba
|
947
sqft
|
built
2018
1001 Julia St, New Orleans, LA 70113
$54
Cash flow
0.6%
Cash-on-Cash Return
5.8%
Cap rate
0.7%
Rent to Value Ratio
Active
$999,990
5
bds
|
4
ba
|
3,511
sqft
|
built
1844
519 Madison St, New Orleans, LA 70116
$-2,731
Cash flow
-14.2%
Cash-on-Cash Return
2.4%
Cap rate
0.3%
Rent to Value Ratio
Active
$545,000
2
bds
|
3
ba
|
1,501
sqft
|
built
1950
4300 Annunciation St, New Orleans, LA 70115
$-1,061
Cash flow
-10.2%
Cash-on-Cash Return
3.3%
Cap rate
0.4%
Rent to Value Ratio
Active
$165,000
1
bds
|
1
ba
|
670
sqft
|
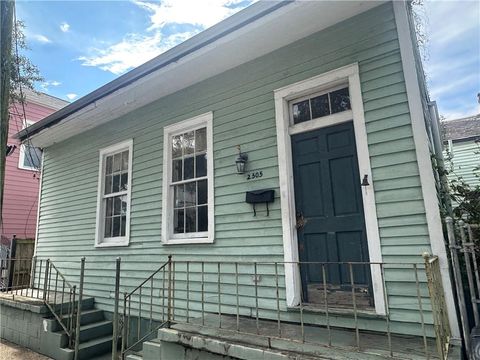
built
1932
2505 Laurel St, New Orleans, LA 70130
$461
Cash flow
14.6%
Cash-on-Cash Return
9.0%
Cap rate
1.1%
Rent to Value Ratio
Active
$99,500
2
bds
|
1
ba
|
1,099
sqft
|
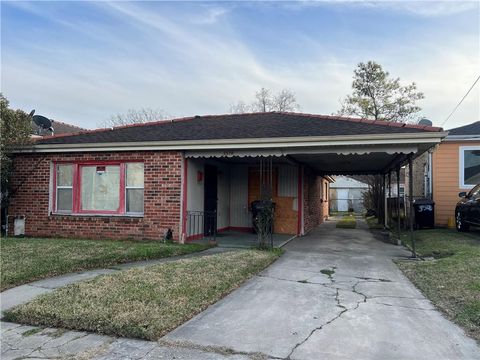
built
1955
3514 N Claiborne Ave, New Orleans, LA 70117
$426
Cash flow
22.3%
Cash-on-Cash Return
10.8%
Cap rate
1.3%
Rent to Value Ratio
Active
$354,000
4
bds
|
2
ba
|
1,820
sqft
|
built
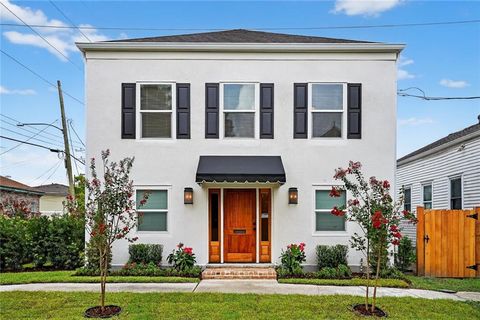
1943
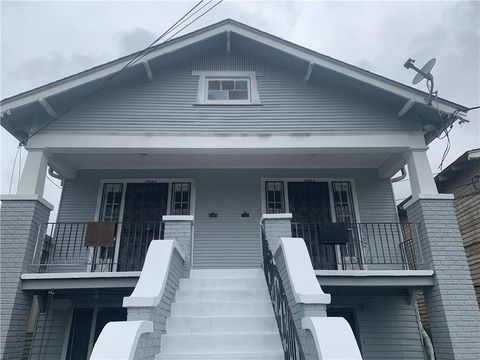
505 S Alexander St, New Orleans, LA 70119
$-433
Cash flow
-6.4%
Cash-on-Cash Return
4.2%
Cap rate
0.5%
Rent to Value Ratio
Active
$925,000
2
bds
|
2
ba
|
1,407
sqft
|
built
2018
1001 Julia St, New Orleans, LA 70113
$-30
Cash flow
-0.2%
Cash-on-Cash Return
5.6%
Cap rate
0.7%
Rent to Value Ratio
Active
$550,000
4
bds
|
4
ba
|
2,773
sqft
|
built
1959
3301 Nashville Ave, New Orleans, LA 70125
$-188
Cash flow
-1.8%
Cash-on-Cash Return
5.3%
Cap rate
0.6%
Rent to Value Ratio
Active
$399,000
3
bds
|
2
ba
|
1,475
sqft
|
built
1920
1810 Hillary St, New Orleans, LA 70118
$44
Cash flow
0.6%
Cash-on-Cash Return
5.8%
Cap rate
0.7%
Rent to Value Ratio
Active
$750,000
4
bds
|
3
ba
|
2,861
sqft
|
built
2021
1207 N Galvez St, New Orleans, LA 70119
$-2,307
Cash flow
-16.0%
Cash-on-Cash Return
2.0%
Cap rate
0.2%
Rent to Value Ratio
Active
$75,000
1
bds
|
1
ba
|
588
sqft
|
built
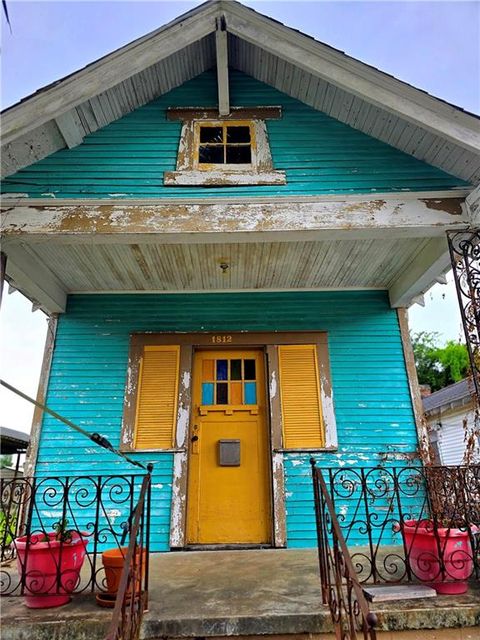
1920
1812 Pauline St, New Orleans, LA 70117
$611
Cash flow
42.5%
Cash-on-Cash Return
15.5%
Cap rate
1.9%
Rent to Value Ratio
Active
$199,000
3
bds
|
2
ba
|
1,320
sqft
|
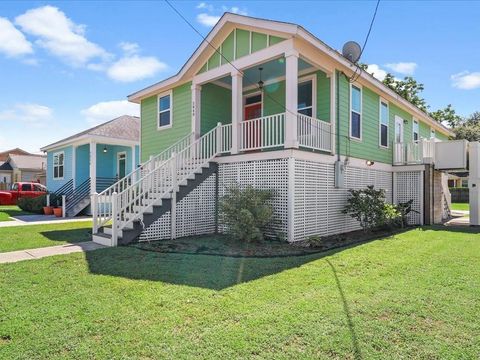
built
2015
5840 Eads St, New Orleans, LA 70122
$438
Cash flow
11.5%
Cash-on-Cash Return
8.3%
Cap rate
1.0%
Rent to Value Ratio
Active
$795,000
4
bds
|
5
ba
|
4,234
sqft
|
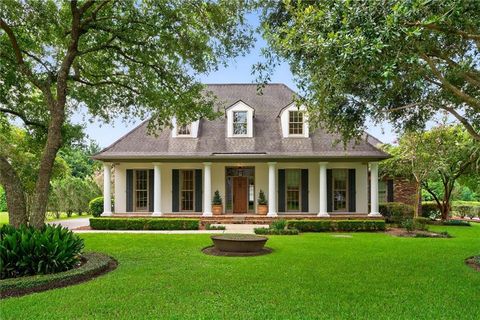
built
2006
122 English Turn Dr, New Orleans, LA 70131
$-173
Cash flow
-1.1%
Cash-on-Cash Return
5.4%
Cap rate
0.7%
Rent to Value Ratio