Lake Mary, FL Investment Properties for Sale
Browse homes for sale and investment properties in Lake Mary, FL. Refine your search by price, property type, or more.
Best cash flowing properties in Lake Mary, FL

Active
$145,000
1
bds
|
1
ba
|
648
sqft
|
built
1991
2585 Grassy Point Dr, Lake Mary, FL 32746
$78
Cash flow
2.8%
Cash-on-Cash Return
6.8%
Cap rate
1.0%
Rent to Value Ratio

Active
$168,900
1
bds
|
1
ba
|
935
sqft
|
built
2000
1321 Arbor Vista Loop, Lake Mary, FL 32746
$76
Cash flow
2.3%
Cash-on-Cash Return
6.7%
Cap rate
0.9%
Rent to Value Ratio
130 out of 135 properties for sale in Lake Mary, FL
Limited Results Shown
Create a free account, or log in to reveal all property listings and enjoy the complete experience.

Pending
$212,000
2
bds
|
3
ba
|
1,095
sqft
|
built
2001
1150 Vineland Pl, Lake Mary, FL 32746
$-285
Cash flow
-7.0%
Cash-on-Cash Return
4.5%
Cap rate
0.8%
Rent to Value Ratio
Active
$564,900
3
bds
|
2
ba
|
1,796
sqft
|
built
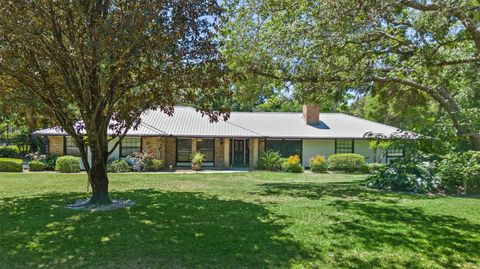
1981
530 Webster St, Lake Mary, FL 32746
$-1,510
Cash flow
-13.9%
Cash-on-Cash Return
2.9%
Cap rate
0.5%
Rent to Value Ratio

Pending
$765,000
4
bds
|
3
ba
|
2,546
sqft
|
built
2014
886 Sherbourne Cir, Lake Mary, FL 32746
$-2,146
Cash flow
-14.6%
Cash-on-Cash Return
2.8%
Cap rate
0.5%
Rent to Value Ratio

Pending
$415,500
4
bds
|
4
ba
|
2,168
sqft
|
built
2012
625 Pavia Loop, Lake Mary, FL 32746
$-1,277
Cash flow
-16.0%
Cash-on-Cash Return
2.5%
Cap rate
0.6%
Rent to Value Ratio
Active
$490,000
3
bds
|
3
ba
|
2,038
sqft
|
built
1986
408 S Winsome Ct, Lake Mary, FL 32746
$-1,056
Cash flow
-11.2%
Cash-on-Cash Return
3.6%
Cap rate
0.6%
Rent to Value Ratio
Active
$650,000
3
bds
|
3
ba
|
2,079
sqft
|
built
1990
220 Wimbledon Cir, Lake Mary, FL 32746
$-1,926
Cash flow
-15.5%
Cash-on-Cash Return
2.6%
Cap rate
0.5%
Rent to Value Ratio

Active
$199,700
2
bds
|
2
ba
|
1,242
sqft
|
built
2000
122 Vista Verdi Cir, Lake Mary, FL 32746
$25
Cash flow
0.7%
Cash-on-Cash Return
6.3%
Cap rate
0.9%
Rent to Value Ratio
Active
$630,000
4
bds
|
2
ba
|
2,310
sqft
|
built
1983
585 Mourning Dove Cir, Lake Mary, FL 32746
$-1,257
Cash flow
-10.4%
Cash-on-Cash Return
3.8%
Cap rate
0.6%
Rent to Value Ratio
Active
$1,199,000
4
bds
|
3
ba
|
3,289
sqft
|
built
1979
3420 Dawn Ct, Lake Mary, FL 32746
$-3,106
Cash flow
-13.5%
Cash-on-Cash Return
3.0%
Cap rate
0.4%
Rent to Value Ratio
Active
$495,000
3
bds
|
4
ba
|
2,295
sqft
|
built
2007
724 Greybull Run, Lake Mary, FL 32746
$-1,311
Cash flow
-13.8%
Cash-on-Cash Return
3.0%
Cap rate
0.6%
Rent to Value Ratio

Active
$525,000
3
bds
|
3
ba
|
2,418
sqft
|
built
2000
802 Pickfair Ter, Lake Mary, FL 32746
$-1,002
Cash flow
-10.0%
Cash-on-Cash Return
3.9%
Cap rate
0.6%
Rent to Value Ratio
Active
$385,000
2
bds
|
3
ba
|
1,412
sqft
|
built
1987
479 Cidermill Pl, Lake Mary, FL 32746
$-811
Cash flow
-11.0%
Cash-on-Cash Return
3.6%
Cap rate
0.6%
Rent to Value Ratio
Active
$1,424,000
4
bds
|
4
ba
|
3,496
sqft
|
built
2019
3883 Grassland Loop, Lake Mary, FL 32746
$-4,321
Cash flow
-15.8%
Cash-on-Cash Return
2.5%
Cap rate
0.4%
Rent to Value Ratio
Active
$495,000
4
bds
|
4
ba
|
2,187
sqft
|
built
2015
1795 Piedmont Pl, Lake Mary, FL 32746
$-1,249
Cash flow
-13.2%
Cash-on-Cash Return
3.1%
Cap rate
0.6%
Rent to Value Ratio
Active
$915,000
4
bds
|
4
ba
|
3,567
sqft
|
built
2019
1268 Patterson Ter, Lake Mary, FL 32746
$-2,801
Cash flow
-16.0%
Cash-on-Cash Return
2.5%
Cap rate
0.4%
Rent to Value Ratio

Active
$135,000
1
bds
|
1
ba
|
648
sqft
|
built
1991
2585 Grassy Point Dr, Lake Mary, FL 32746
$61
Cash flow
2.4%
Cash-on-Cash Return
6.7%
Cap rate
1.0%
Rent to Value Ratio
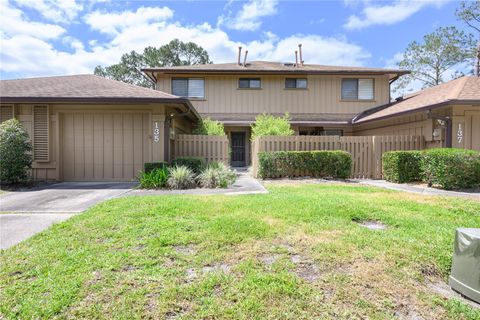
Active
$299,000
2
bds
|
3
ba
|
1,544
sqft
|
built
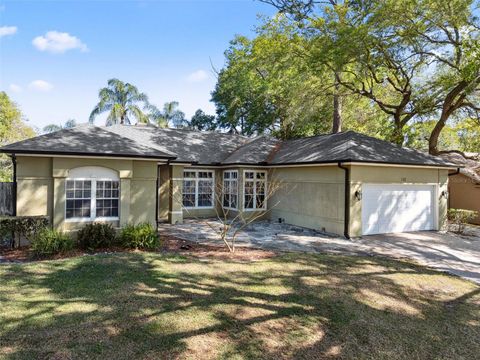
1985
135 Heron Bay Cir, Lake Mary, FL 32746
$-481
Cash flow
-8.4%
Cash-on-Cash Return
4.2%
Cap rate
0.7%
Rent to Value Ratio

Active
$177,900
2
bds
|
2
ba
|
899
sqft
|
built
1994
2516 Grassy Point Dr, Lake Mary, FL 32746
$20
Cash flow
0.6%
Cash-on-Cash Return
6.3%
Cap rate
0.9%
Rent to Value Ratio
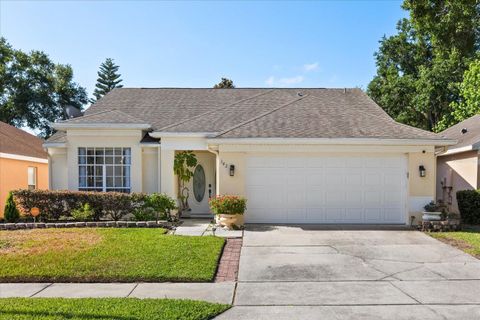
Active
$445,000
3
bds
|
2
ba
|
1,669
sqft
|
built
1996
342 Hanging Moss Cir, Lake Mary, FL 32746
$-793
Cash flow
-9.3%
Cash-on-Cash Return
4.0%
Cap rate
0.6%
Rent to Value Ratio

Active
$160,000
1
bds
|
1
ba
|
837
sqft
|
built
2000
1325 Rotonda Pt, Lake Mary, FL 32746
$-358
Cash flow
-11.7%
Cash-on-Cash Return
3.5%
Cap rate
0.9%
Rent to Value Ratio
Active
$839,000
4
bds
|
3
ba
|
2,600
sqft
|
built
1983
203 E Greentree Ln, Lake Mary, FL 32746
$-2,678
Cash flow
-16.7%
Cash-on-Cash Return
2.3%
Cap rate
0.4%
Rent to Value Ratio
Active
$499,500
4
bds
|
2
ba
|
2,039
sqft
|
built
1986
404 N Sundance Dr, Lake Mary, FL 32746
$-1,141
Cash flow
-11.9%
Cash-on-Cash Return
3.4%
Cap rate
0.6%
Rent to Value Ratio

Active
$1,050,000
5
bds
|
4
ba
|
3,665
sqft
|
built
1997
1570 Westover Loop, Lake Mary, FL 32746
$-2,251
Cash flow
-11.2%
Cash-on-Cash Return
3.6%
Cap rate
0.6%
Rent to Value Ratio

Active
$295,000
3
bds
|
2
ba
|
1,731
sqft
|
built
2000
143 Villa Di Este Ter, Lake Mary, FL 32746
$-989
Cash flow
-17.5%
Cash-on-Cash Return
2.1%
Cap rate
0.7%
Rent to Value Ratio
Active
$2,220,000
4
bds
|
4
ba
|
5,009
sqft
|
built
2007
4 Island Dr, Lake Mary, FL 32746
$-7,076
Cash flow
-16.6%
Cash-on-Cash Return
2.3%
Cap rate
0.4%
Rent to Value Ratio
Active
$575,000
3
bds
|
2
ba
|
2,181
sqft
|
built
1989
148 Oak View Cir, Lake Mary, FL 32746
$-1,353
Cash flow
-12.3%
Cash-on-Cash Return
3.3%
Cap rate
0.5%
Rent to Value Ratio
Active
$145,000
1
bds
|
1
ba
|
648
sqft
|
built
1991
2585 Grassy Point Dr, Lake Mary, FL 32746
$78
Cash flow
2.8%
Cash-on-Cash Return
6.8%
Cap rate
1.0%
Rent to Value Ratio
Active
$544,000
3
bds
|
3
ba
|
2,788
sqft
|
built
1990
738 Powderhorn Cir, Lake Mary, FL 32746
$-798
Cash flow
-7.7%
Cash-on-Cash Return
4.4%
Cap rate
0.6%
Rent to Value Ratio
Pending
$430,000
3
bds
|
4
ba
|
1,989
sqft
|
built
2015
810 Greybull Run, Lake Mary, FL 32746
$-895
Cash flow
-10.9%
Cash-on-Cash Return
3.7%
Cap rate
0.6%
Rent to Value Ratio

Active
$147,500
1
bds
|
1
ba
|
674
sqft
|
built
1991
2608 Grassy Point Dr, Lake Mary, FL 32746
$59
Cash flow
2.1%
Cash-on-Cash Return
6.6%
Cap rate
0.9%
Rent to Value Ratio

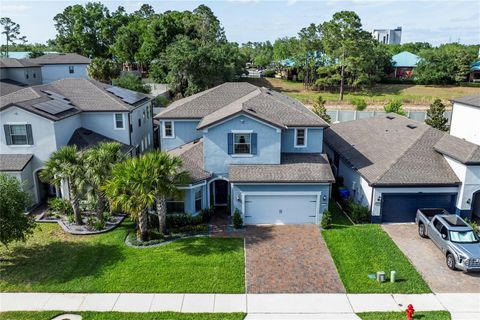
Active
$415,000
2
bds
|
3
ba
|
1,642
sqft
|
built
2019
1010 Lychee Ct, Lake Mary, FL 32746
$-1,059
Cash flow
-13.3%
Cash-on-Cash Return
3.1%
Cap rate
0.6%
Rent to Value Ratio

Active
$179,000
1
bds
|
1
ba
|
715
sqft
|
built
1992
2513 Grassy Point Dr, Lake Mary, FL 32746
$-479
Cash flow
-14.0%
Cash-on-Cash Return
2.9%
Cap rate
0.8%
Rent to Value Ratio
Active
$168,900
1
bds
|
1
ba
|
935
sqft
|
built
2000
1321 Arbor Vista Loop, Lake Mary, FL 32746
$76
Cash flow
2.3%
Cash-on-Cash Return
6.7%
Cap rate
0.9%
Rent to Value Ratio
Active
$449,000
3
bds
|
4
ba
|
2,295
sqft
|
built
2007
728 Greybull Run, Lake Mary, FL 32746
$-943
Cash flow
-11.0%
Cash-on-Cash Return
3.6%
Cap rate
0.6%
Rent to Value Ratio
Active
$412,000
3
bds
|
3
ba
|
1,539
sqft
|
built
1987
842 E Charing Cross Cir, Lake Mary, FL 32746
$-655
Cash flow
-8.3%
Cash-on-Cash Return
4.2%
Cap rate
0.6%
Rent to Value Ratio

Active
$230,000
2
bds
|
2
ba
|
1,242
sqft
|
built
2000
1321 Arbor Vista Loop, Lake Mary, FL 32746
$-664
Cash flow
-15.1%
Cash-on-Cash Return
2.7%
Cap rate
0.8%
Rent to Value Ratio

Active
$1,518,000
4
bds
|
4
ba
|
4,282
sqft
|
built
2016
3687 Farm Bell Pl, Lake Mary, FL 32746
$-5,233
Cash flow
-18.0%
Cash-on-Cash Return
2.0%
Cap rate
0.3%
Rent to Value Ratio
Active
$1,249,000
5
bds
|
5
ba
|
3,835
sqft
|
built
2003
1185 Cypress Loft Pl, Lake Mary, FL 32746
$-2,838
Cash flow
-11.9%
Cash-on-Cash Return
3.4%
Cap rate
0.5%
Rent to Value Ratio

Active
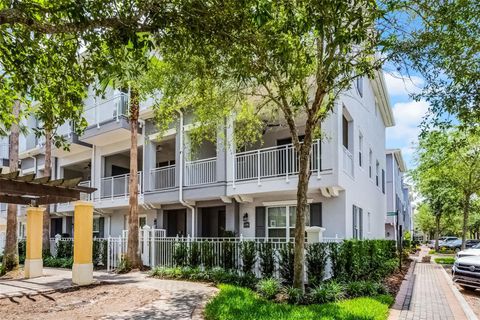
$415,000
2
bds
|
3
ba
|
1,667
sqft
|
built
2020
936 Wild Date Ln, Lake Mary, FL 32746
$-1,090
Cash flow
-13.7%
Cash-on-Cash Return
3.0%
Cap rate
0.6%
Rent to Value Ratio
Active
$1,599,999
5
bds
|
5
ba
|
4,294
sqft
|
built
2015
3955 Equine Cv, Lake Mary, FL 32746
$-4,514
Cash flow
-14.7%
Cash-on-Cash Return
2.8%
Cap rate
0.4%
Rent to Value Ratio