Las Vegas, NV Investment Properties for Sale
Browse homes for sale and investment properties in Las Vegas, NV. Refine your search by price, property type, or more.
Best cash flowing properties in Las Vegas, NV

Active
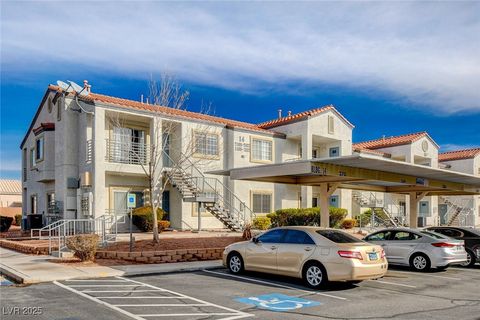
$193,900
2
bds
|
2
ba
|
988
sqft
|
built
1986
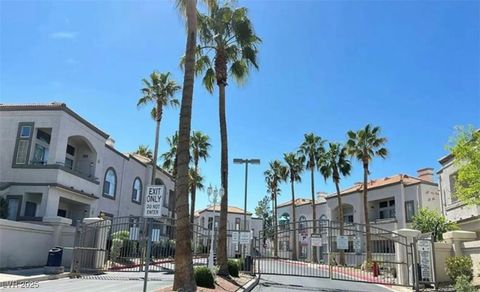
4050 Pacific Harbors Dr, Las Vegas, NV 89121
$-377
Cash flow
-10.1%
Cash-on-Cash Return
3.9%
Cap rate
0.7%
Rent to Value Ratio
Active
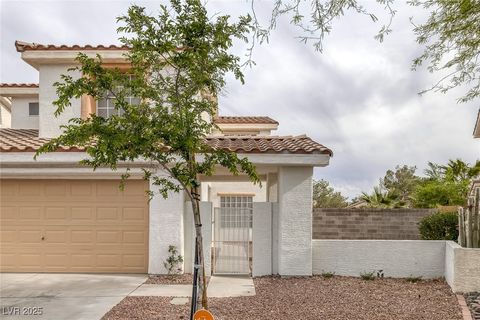
$185,000
3
bds
|
2
ba
|
1,140
sqft
|
built
1998
3318 N Decatur Blvd, Las Vegas, NV 89130
$-409
Cash flow
-11.5%
Cash-on-Cash Return
3.6%
Cap rate
0.9%
Rent to Value Ratio
6,294 out of 6,429 properties for sale in Las Vegas, NV
Limited Results Shown
Create a free account, or log in to reveal all property listings and enjoy the complete experience.
Active
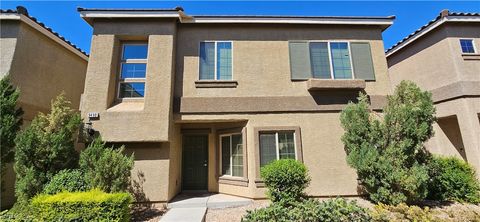
$445,000
3
bds
|
3
ba
|
1,674
sqft
|
built
1997
8005 Exploration Ave, Las Vegas, NV 89131
$-1,106
Cash flow
-13.0%
Cash-on-Cash Return
3.3%
Cap rate
0.4%
Rent to Value Ratio
Active
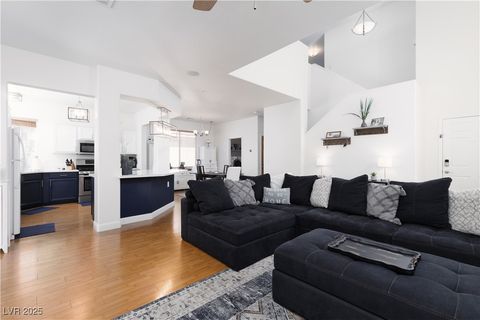
$485,000
4
bds
|
3
ba
|
2,236
sqft
|
built
2012
9490 Alma Ridge Ave, Las Vegas, NV 89178
$-1,516
Cash flow
-16.3%
Cash-on-Cash Return
2.5%
Cap rate
0.4%
Rent to Value Ratio
Active
$458,000
3
bds
|
3
ba
|
2,091
sqft
|
built
2000
9029 Tumblewood Ave, Las Vegas, NV 89143
$-1,097
Cash flow
-12.5%
Cash-on-Cash Return
3.4%
Cap rate
0.5%
Rent to Value Ratio
Active
$439,900
3
bds
|
3
ba
|
2,060
sqft
|
built
1996
7228 Chic Ave, Las Vegas, NV 89129
$-916
Cash flow
-10.9%
Cash-on-Cash Return
3.8%
Cap rate
0.5%
Rent to Value Ratio
Active
$219,900
2
bds
|
2
ba
|
896
sqft
|
built
1987
2970 Juniper Hills Blvd, Las Vegas, NV 89142
$-538
Cash flow
-12.8%
Cash-on-Cash Return
3.3%
Cap rate
0.6%
Rent to Value Ratio
Active
$193,900
2
bds
|
2
ba
|
988
sqft
|
built
1986
4050 Pacific Harbors Dr, Las Vegas, NV 89121
$-377
Cash flow
-10.1%
Cash-on-Cash Return
3.9%
Cap rate
0.7%
Rent to Value Ratio
Active
$524,900
4
bds
|
2
ba
|
2,349
sqft
|
built
1995
5232 Saranac Rd, Las Vegas, NV 89130
$-1,674
Cash flow
-16.6%
Cash-on-Cash Return
2.4%
Cap rate
0.4%
Rent to Value Ratio
Active
$655,000
3
bds
|
3
ba
|
2,236
sqft
|
built
1993
7813 Paper Flower Ct, Las Vegas, NV 89128
$-1,461
Cash flow
-11.6%
Cash-on-Cash Return
3.6%
Cap rate
0.5%
Rent to Value Ratio
Active
$750,000
4
bds
|
3
ba
|
2,704
sqft
|
built
2021
9839 Berkley Brook Ct, Las Vegas, NV 89141
$-2,038
Cash flow
-14.2%
Cash-on-Cash Return
3.0%
Cap rate
0.5%
Rent to Value Ratio
Active
$565,000
4
bds
|
3
ba
|
2,715
sqft
|
built
2022
9239 Albus Hills Ave, Las Vegas, NV 89143
$-1,557
Cash flow
-14.4%
Cash-on-Cash Return
3.0%
Cap rate
0.5%
Rent to Value Ratio
Active
$774,900
4
bds
|
5
ba
|
4,850
sqft
|
built
2006
9472 Ojibwa Ave, Las Vegas, NV 89149
$-1,734
Cash flow
-11.7%
Cash-on-Cash Return
3.6%
Cap rate
0.5%
Rent to Value Ratio
Active
$429,999
4
bds
|
2
ba
|
1,902
sqft
|
built
1963
4301 Fortune Ave, Las Vegas, NV 89107
$-875
Cash flow
-10.6%
Cash-on-Cash Return
3.8%
Cap rate
0.5%
Rent to Value Ratio
Active
$469,900
4
bds
|
3
ba
|
1,875
sqft
|
built
2001
10142 Rice Paper St, Las Vegas, NV 89183
$-1,144
Cash flow
-12.7%
Cash-on-Cash Return
3.3%
Cap rate
0.5%
Rent to Value Ratio
Active
$675,000
4
bds
|
3
ba
|
3,330
sqft
|
built
1993
8128 Bay Pines Ave, Las Vegas, NV 89128
$-1,716
Cash flow
-13.3%
Cash-on-Cash Return
3.2%
Cap rate
0.5%
Rent to Value Ratio

Active
$359,999
3
bds
|
3
ba
|
1,300
sqft
|
built
2006
9148 Alluring Ave, Las Vegas, NV 89149
$-840
Cash flow
-12.2%
Cash-on-Cash Return
3.5%
Cap rate
0.5%
Rent to Value Ratio
Active
$959,000
3
bds
|
3
ba
|
2,693
sqft
|
built
2003
3663 Coventry Gardens Dr, Las Vegas, NV 89135
$-3,114
Cash flow
-16.9%
Cash-on-Cash Return
2.4%
Cap rate
0.4%
Rent to Value Ratio
Active
$185,000
3
bds
|
2
ba
|
1,140
sqft
|
built
1998
3318 N Decatur Blvd, Las Vegas, NV 89130
$-409
Cash flow
-11.5%
Cash-on-Cash Return
3.6%
Cap rate
0.9%
Rent to Value Ratio
Active
$799,999
5
bds
|
3
ba
|
3,557
sqft
|
built
1991
3340 Shallow Pond Dr, Las Vegas, NV 89117
$-2,209
Cash flow
-14.4%
Cash-on-Cash Return
3.0%
Cap rate
0.4%
Rent to Value Ratio
Active
$639,000
3
bds
|
2
ba
|
1,967
sqft
|
built
2002
19 Dryden Park Ave, Las Vegas, NV 89148
$-2,244
Cash flow
-18.3%
Cash-on-Cash Return
2.1%
Cap rate
0.3%
Rent to Value Ratio
Active
$1,199,000
4
bds
|
4
ba
|
4,314
sqft
|
built
1990
1931 Fox Canyon Cir, Las Vegas, NV 89117
$-3,835
Cash flow
-16.7%
Cash-on-Cash Return
2.4%
Cap rate
0.4%
Rent to Value Ratio

Active
$349,900
3
bds
|
3
ba
|
1,611
sqft
|
built
2007
10455 Alpine Edge Ave, Las Vegas, NV 89129
$-877
Cash flow
-13.1%
Cash-on-Cash Return
3.3%
Cap rate
0.5%
Rent to Value Ratio
Active
$2,199,888
6
bds
|
5
ba
|
5,305
sqft
|
built
1995
7436 Oak Grove Ave, Las Vegas, NV 89117
$-7,512
Cash flow
-17.8%
Cash-on-Cash Return
2.2%
Cap rate
0.3%
Rent to Value Ratio
Active
$404,900
3
bds
|
2
ba
|
1,396
sqft
|
built
2002
5043 Naff Ridge Dr, Las Vegas, NV 89131
$-914
Cash flow
-11.8%
Cash-on-Cash Return
3.6%
Cap rate
0.5%
Rent to Value Ratio
Active
$584,998
4
bds
|
4
ba
|
2,971
sqft
|
built
2013
8494 Langhorne Creek St, Las Vegas, NV 89139
$-1,531
Cash flow
-13.7%
Cash-on-Cash Return
3.1%
Cap rate
0.5%
Rent to Value Ratio
Active
$1,995,000
5
bds
|
5
ba
|
4,821
sqft
|
built
2000
2111 Bogart Ct, Las Vegas, NV 89117
$-4,274
Cash flow
-11.2%
Cash-on-Cash Return
3.7%
Cap rate
0.5%
Rent to Value Ratio
Active
$295,000
3
bds
|
2
ba
|
1,223
sqft
|
built
2004
3515 Cactus Shadow St, Las Vegas, NV 89129
$-816
Cash flow
-14.4%
Cash-on-Cash Return
2.9%
Cap rate
0.5%
Rent to Value Ratio
Active
$649,900
3
bds
|
3
ba
|
2,657
sqft
|
built
2009
6647 Brooklyn Heights St, Las Vegas, NV 89166
$-2,324
Cash flow
-18.7%
Cash-on-Cash Return
2.0%
Cap rate
0.3%
Rent to Value Ratio
Active
$1,399,000
4
bds
|
4
ba
|
3,855
sqft
|
built
2002
9301 Queen Charlotte Dr, Las Vegas, NV 89145
$-5,349
Cash flow
-19.9%
Cash-on-Cash Return
1.7%
Cap rate
0.3%
Rent to Value Ratio
Active
$1,100,000
3
bds
|
4
ba
|
3,275
sqft
|
built
2003
4738 Laurel Canyon St, Las Vegas, NV 89129
$-3,750
Cash flow
-17.8%
Cash-on-Cash Return
2.2%
Cap rate
0.4%
Rent to Value Ratio
Active
$615,000
4
bds
|
3
ba
|
2,418
sqft
|
built
1990
7624 Nocturne Ct, Las Vegas, NV 89128
$-1,904
Cash flow
-16.2%
Cash-on-Cash Return
2.6%
Cap rate
0.4%
Rent to Value Ratio
Active
$399,900
3
bds
|
3
ba
|
1,478
sqft
|
built
2003
1043 Monte De Oro Ave, Las Vegas, NV 89183
$-881
Cash flow
-11.5%
Cash-on-Cash Return
3.6%
Cap rate
0.5%
Rent to Value Ratio

Active
$189,900
2
bds
|
2
ba
|
997
sqft
|
built
1989
2700 N Rainbow Blvd, Las Vegas, NV 89108
$-415
Cash flow
-11.4%
Cash-on-Cash Return
3.6%
Cap rate
0.7%
Rent to Value Ratio
Active
$279,900
2
bds
|
2
ba
|
1,025
sqft
|
built
1998
3125 N Buffalo Dr, Las Vegas, NV 89128
$-972
Cash flow
-18.1%
Cash-on-Cash Return
2.1%
Cap rate
0.5%
Rent to Value Ratio
Active
$795,000
4
bds
|
3
ba
|
2,722
sqft
|
built
2000
10548 Ettenmoor Ave, Las Vegas, NV 89135
$-2,369
Cash flow
-15.5%
Cash-on-Cash Return
2.7%
Cap rate
0.4%
Rent to Value Ratio
Active
$779,900
3
bds
|
3
ba
|
2,012
sqft
|
built
1993
916 Pro Players Dr, Las Vegas, NV 89134
$-2,634
Cash flow
-17.6%
Cash-on-Cash Return
2.2%
Cap rate
0.4%
Rent to Value Ratio
Active
$328,900
2
bds
|
2
ba
|
1,247
sqft
|
built
1994
1000 Grammy Dr, Las Vegas, NV 89145
$-747
Cash flow
-11.8%
Cash-on-Cash Return
3.5%
Cap rate
0.5%
Rent to Value Ratio
Active
$4,800,000
8
bds
|
6
ba
|
5,041
sqft
|
built
1996
6325 Guy Ave, Las Vegas, NV 89131
$-20,960
Cash flow
-22.8%
Cash-on-Cash Return
1.0%
Cap rate
0.2%
Rent to Value Ratio
Active
$244,999
2
bds
|
2
ba
|
900
sqft
|
built
1990
2136 Bavington Dr, Las Vegas, NV 89108
$-648
Cash flow
-13.8%
Cash-on-Cash Return
3.1%
Cap rate
0.6%
Rent to Value Ratio
Active
$260,000
2
bds
|
2
ba
|
1,074
sqft
|
built
1992
2028 Bavington Dr, Las Vegas, NV 89108
$-722
Cash flow
-14.5%
Cash-on-Cash Return
2.9%
Cap rate
0.5%
Rent to Value Ratio
Active
$159,900
2
bds
|
1
ba
|
918
sqft
|
built
1963
212 Orland St, Las Vegas, NV 89107
$-472
Cash flow
-15.4%
Cash-on-Cash Return
2.7%
Cap rate
0.6%
Rent to Value Ratio